PRT Bands – the ProRealTime trend following indicator

Forums ProRealTime English forum General trading discussions PRT Bands – the ProRealTime trend following indicator

Tagged: 

Viewing 15 posts - 1 through 15 (of 36 total)
  • #141809

    ProRealTime now includes the PRT Bands indicator in its arsenal of technical indicators.


    What is PRT Bands and how to use it?

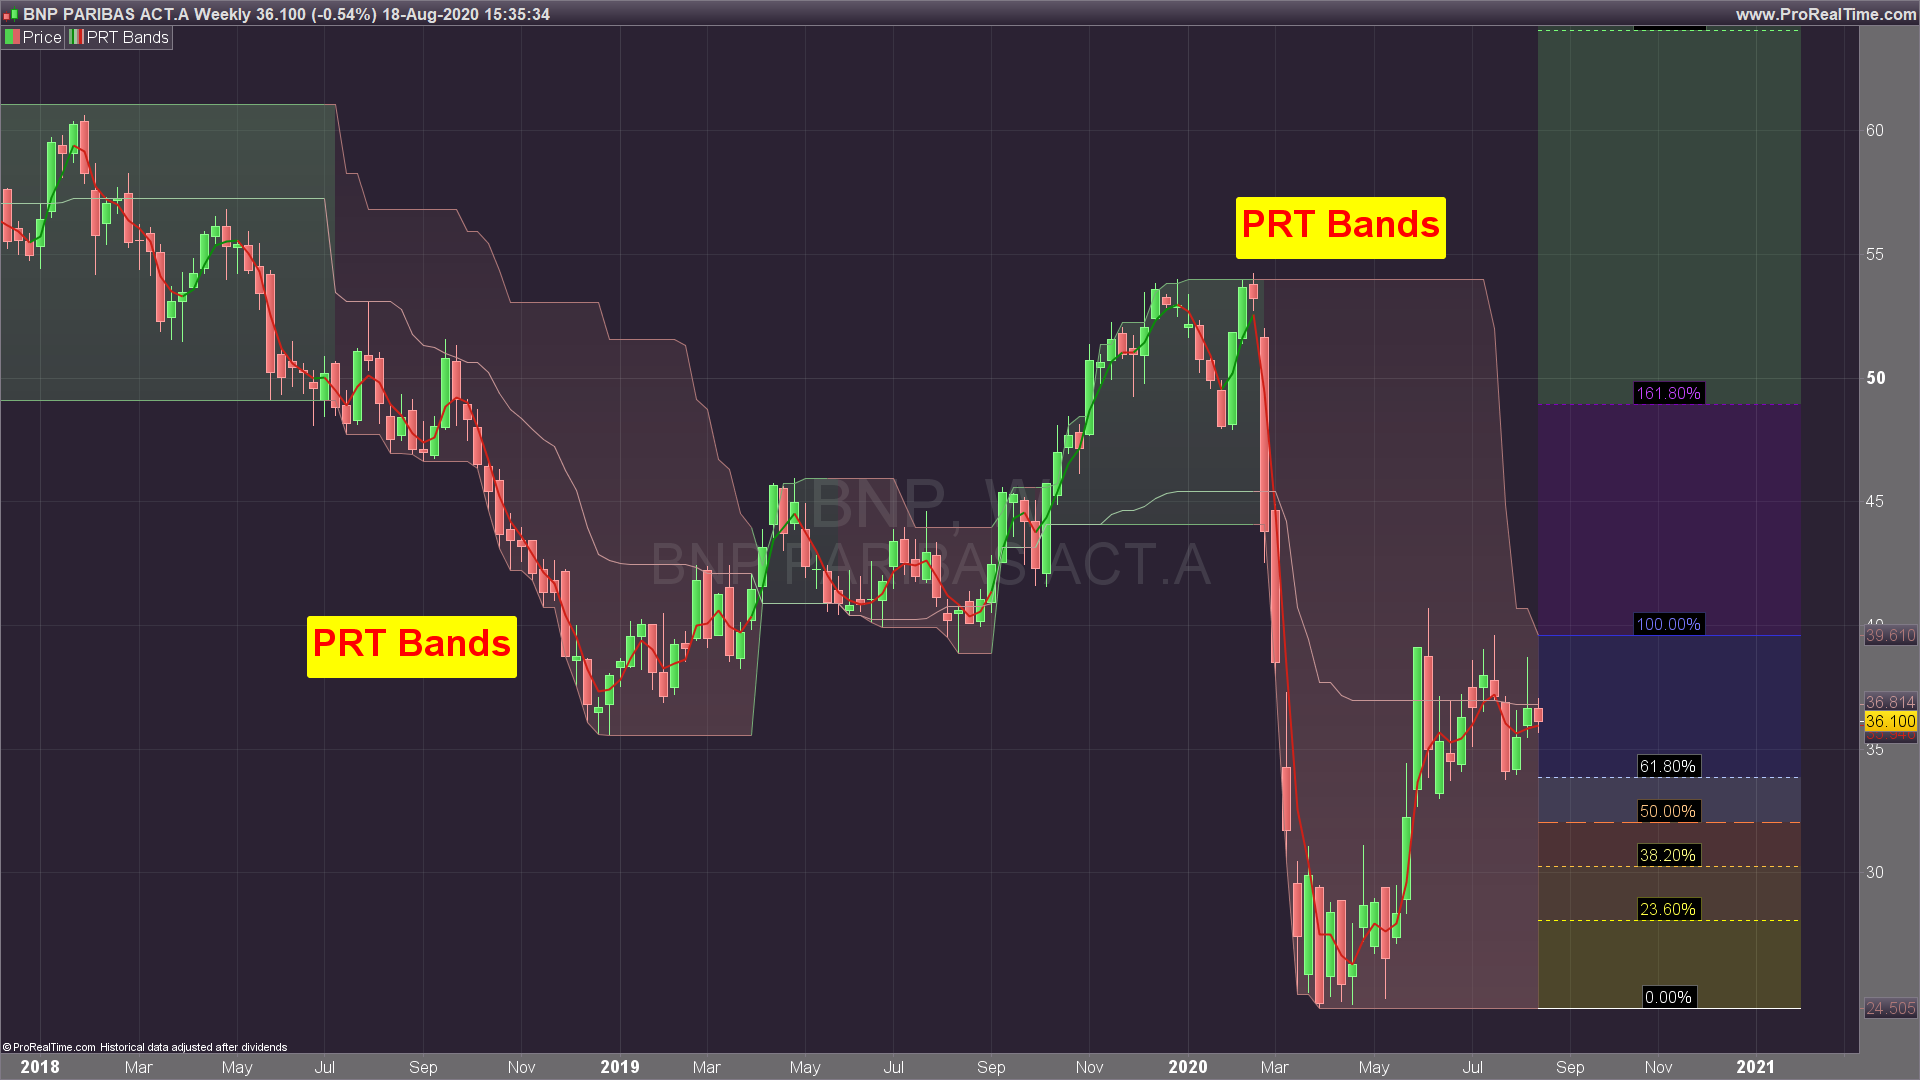
    PRT Bands is a visual indicator which simplifies detecting and following increasing market trends. This indicator is only available from ProRealTime.

    PRT Bands may help you to:

    • identify trend reversals
    • identify and follow rising trends
    • mesure the intensity of a trend
    • find potential entry and exit points

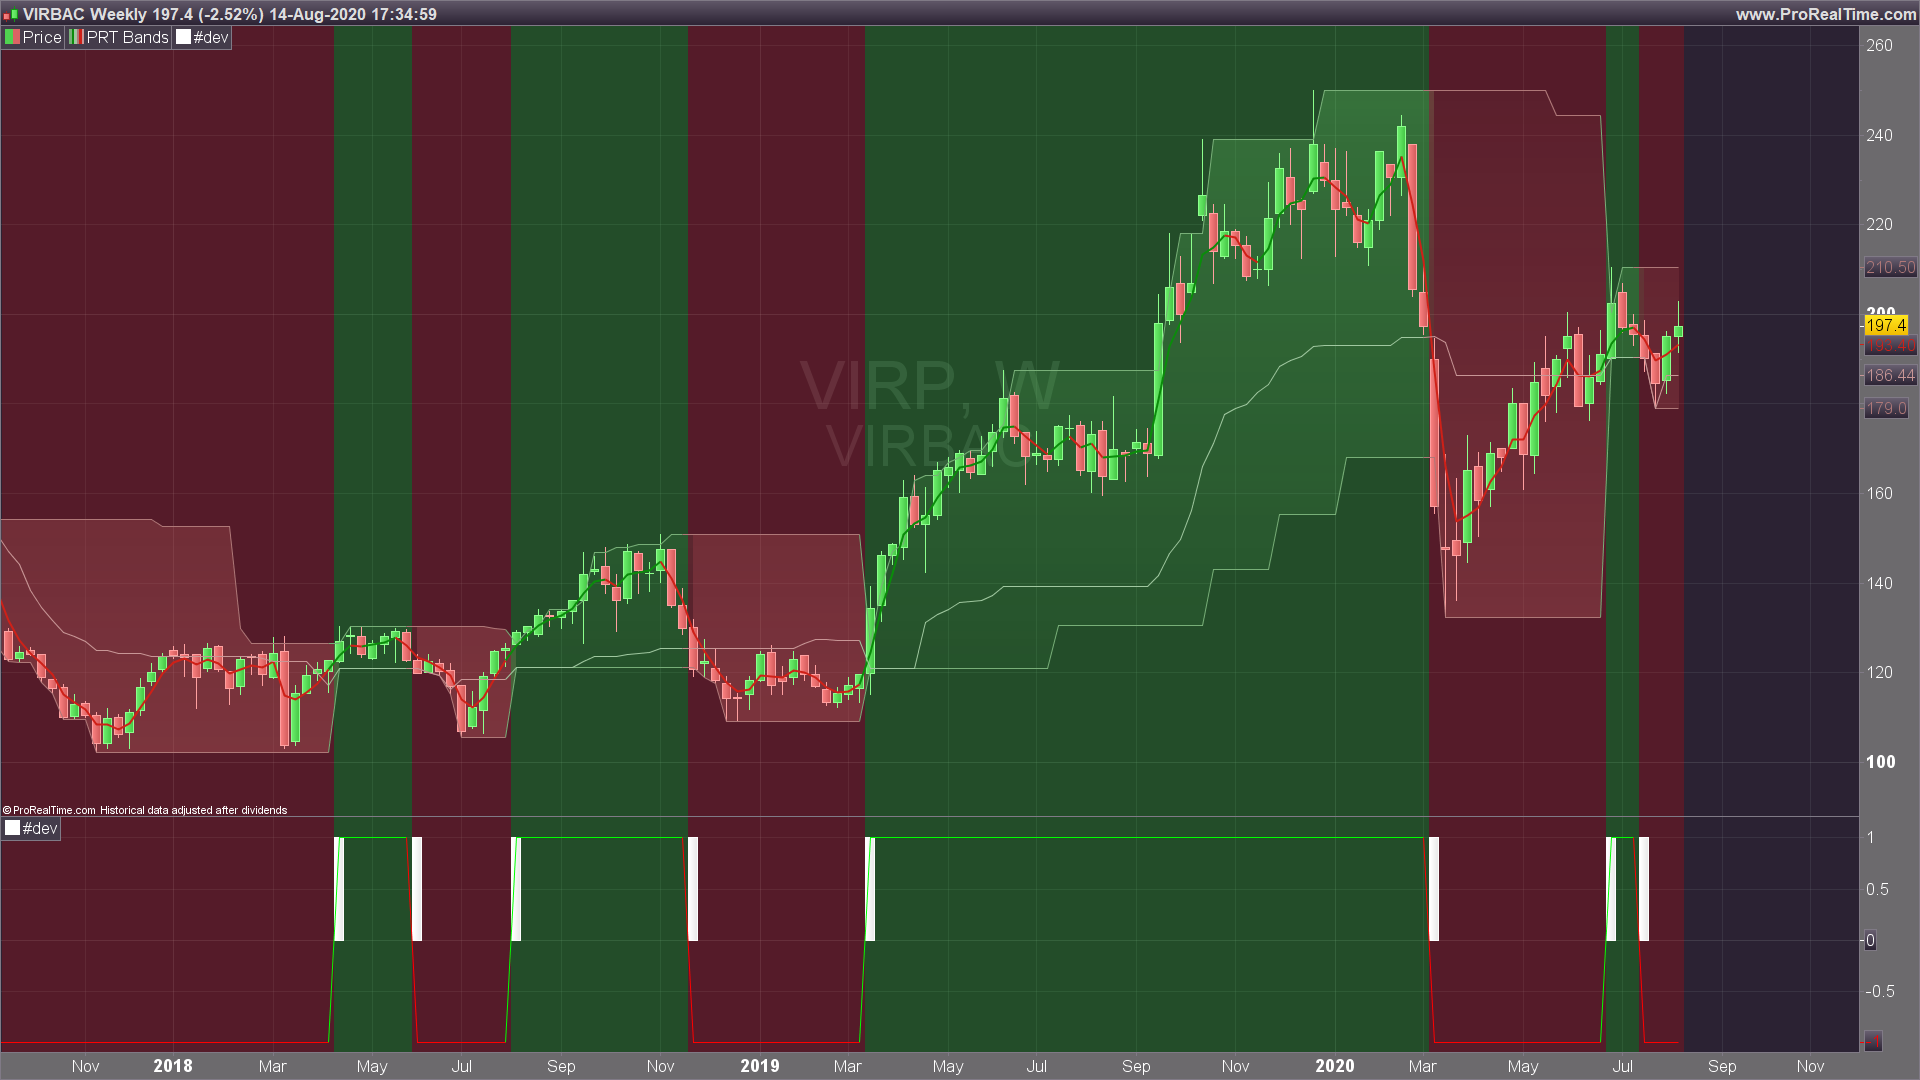
    This indicator was designed for use with stocks that may have high bullish potential such as small and medium caps or technological stocks. It is used primarily with long chart timeframes (ex: daily or weekly).

    Detect the beginning of a trend

    When the price breaks out of the top line of a bearish channel of the indicator, the beginning of a potential bullish trend is detected.

    The possible change of the trend from a downward trend to an upward trend is indicated by the change of color of the trend lines from red to green.

    View current upward trends

    When the price is inside a green channel, the trend of the security is upwards. An upwards trend is caracterized by its capacity to regularly make new highs. Statistically, the trend tends to continue.

    If you do not have a position, it may be an opportunity for you to enter this trend by identifying the entry point the most adapted to your own strategy and investment objectives and to try to benefit from its future progression.

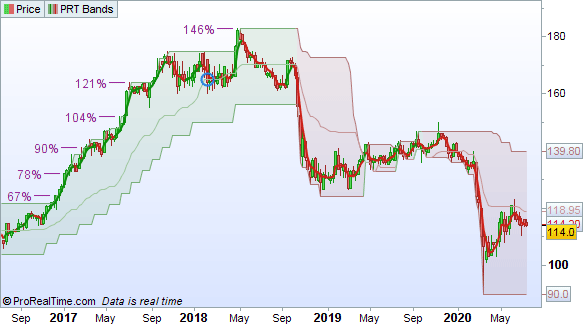
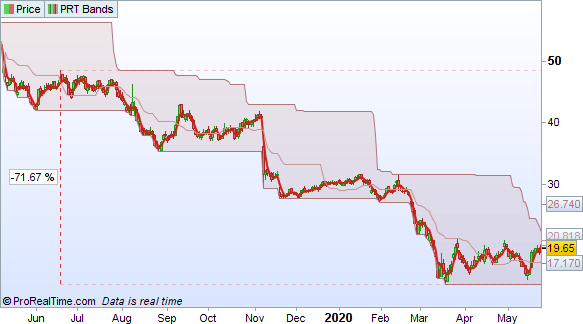
    Don’t catch a “falling knife”

    We have a tendancy to see a security whose price has “fallen enough” and to try to find a support which could hold in order to buy at a low price and hope to sell again at a higher price.

    But we also have a tendancy to forget that in the absence of a strong bullish signal, a downward trend can continue for a long time.

    With the indicator PRT Bands, as long as the price stays within a downward band, we could interpret that a trend reversal has not necessarily happened and opening a buying position could be dangerous.

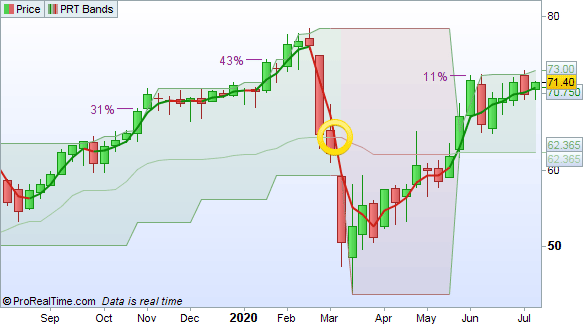
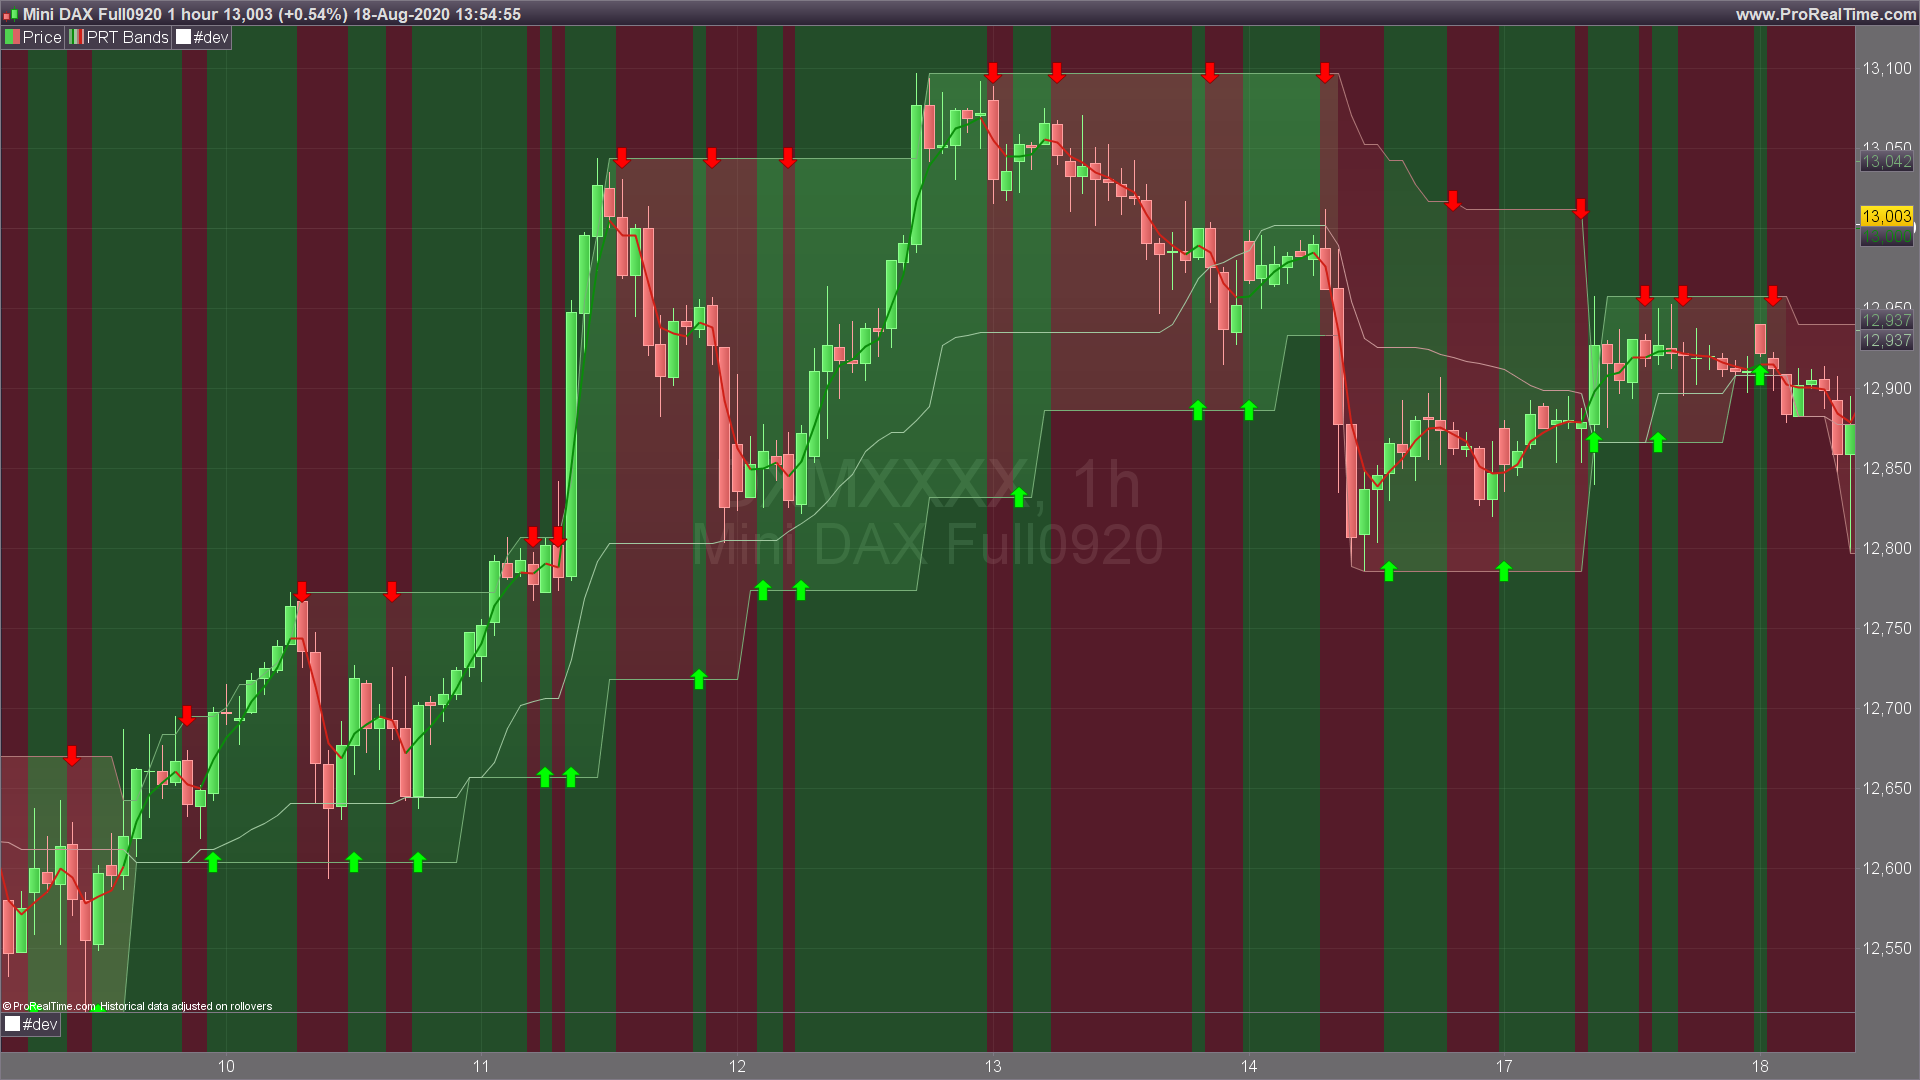
    Find an entry point with the short-term line

    The indicator displays a short term trend line which stays close to the price movements and allows you to better filter price fluctuations.

    During increasing trend phases, stocks sometimes experience movements of price consolidation. This case will be represented by an increasing channel (underlying trend), but with a decreasing short term line.

    When this short term line is increasing again, it could be possible to look for a point to enter the underlying increasing trend.

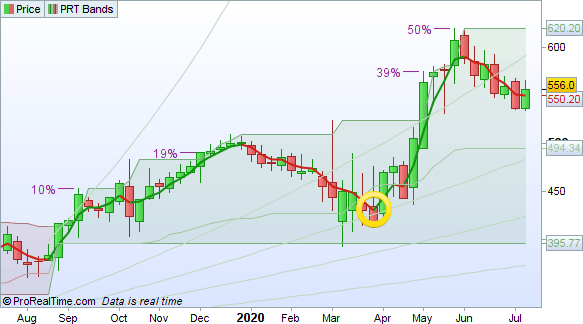
    Follow the mid-term trend

    In the middle of a channel, a bold line is displayed. This line represents the mid-term trend.

    When the short term line which closesly follows the price crosses under the mid-term line, it can indicate a weakening of the trend. This can be an opportunity to reduce the size of a position or possibly close it.

    Also, when the short term line crosses over the mid term line, it is possible to look for a point to enter the trend.

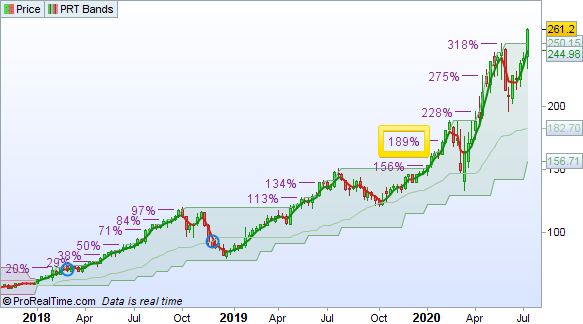
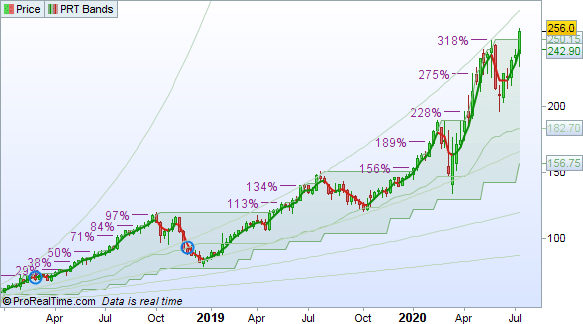
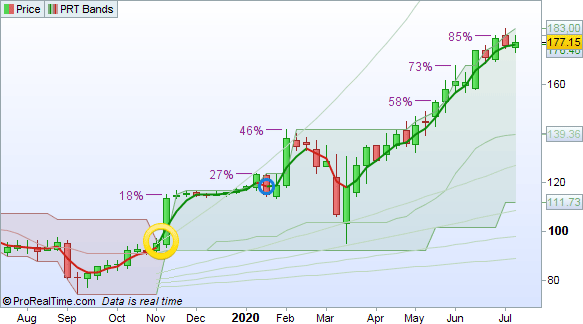
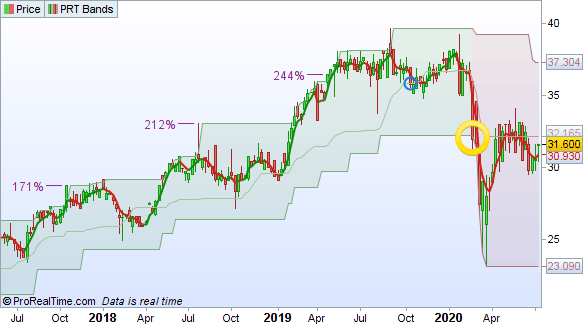
    Quickly measure the progression of the trend

    In order to avoid using a different tool to measure the progress of the trend, it is regularly displayed, as the trend progresses.

    This is also a feature which has a psychological impact and can encourage you to hold a winning position while the trend continues to be good.

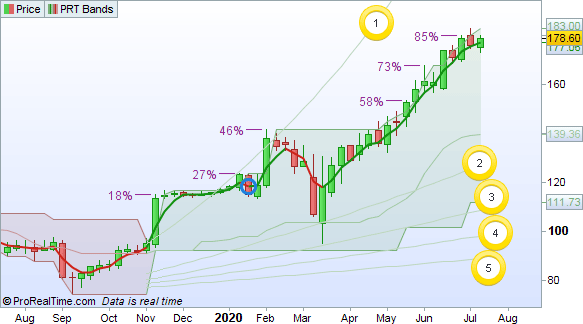
    Quickly evaluate the speed of the trend

    The indicator also displays a set of 5 lines showing the speed of the trend. These lines serve as a reference.

    In this way, a trend which follows or crosses over the first line would be considered very fast, and a trend which is underneath the 5 line would be considered very slow. Some investors may prefer to enter the market in a faster trend.

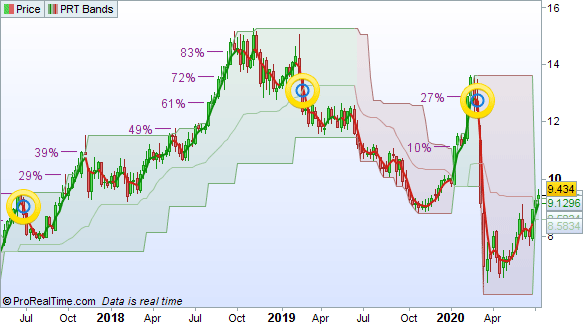
    Weakening of the trend

    The indicator indicates by blue circles zones of potential weakining of the trend. These blue circles can be used as elements of your consideration if your money management strategy includes taking partial profits.

    Consider leaving the trend when it is giving the impression of weakening further

    Did you benefit from a nice rising trend for several weeks or months or years? The next step is to figure out when to leave the trend. The bullish trend when it weakens can leave space for a bearish trend.

    The possible change of trend from increasing to decreasing can occur when the price closes on the bottom of a channel. This change is represented by a change of color of the trend lines from green to red.

    5 users thanked author for this post.
    #141822

    I propose to collect your impressions on this new indicator in this topic. You can also share here your findings and strategies related to this indicator, feel free to post to start your discussions 🙂

    I will add to the top of the topic the next news related to the PRT Bands indicator, including the addition of screeners and new instructions to come to allow us to create new codes from it. To stay up to date with topic posts, you can subscribe to this topic by clicking on “subscribe” at the top right of the first post.

    PRT Bands official help manual: https://www.prorealtime.com/en/help-manual/prorealtime-bands (same description as above).

    Programming instructions for PRT Bands are available! see the examples in the online documentation of the site:

    PRTBANDSUP ; PRTBANDSDOWN ; PRTBANDSMEDIUMTERM ; PRTBANDSSHORTTERM

    (please note that these instructions are only available in prorealtime software and will be deployed in the upcoming weeks with other PRT version associated with brokers, such as IG).

    If you want to be updated with fresh news about PRT Bands, I suggest you subscribe to this topic by clicking on “subscribe” at the top right of the first post of the page.


    list of coding examples (will be updated continuously):

    1. PRT Bands trend inverting (from red to green and vice-versa) https://www.prorealcode.com/topic/prt-bands-the-prorealtime-trend-following-indicator/#post-141822
    2. detection of the direction of the short-term line and the precise moment of its change of direction (PRTBandsShortTerm): https://www.prorealcode.com/topic/prt-bands-the-prorealtime-trend-following-indicator/#post-141969
    3. proximity to the price of the upper band in a long-term downtrend (potential breakout): https://www.prorealcode.com/topic/prt-bands-the-prorealtime-trend-following-indicator/#post-141971

    more complete list of PRT Bands coding examples: https://www.prorealcode.com/topic/prt-bands-trend-following-prorealtime/#post-139864


    Example #1: 

    Detect the trend change (from bearish to bullish trend), channel change from red to green

    The change in trend of the PRT Bands indicator (change from red or green or vice versa). The price Close crosses the upper or lower band, but you need to know first if we were bearish or bullish.

    In the example below, we detect this trend reversal to color the bottom of the chart according to “trend” (1 = bullish; -1 = bearish), the “signal” variable returns the precise moment when the trend is therefore useful for those who want to screen this starting signal for trend following.


    3 users thanked author for this post.
    #141873

    That looks very interesting, thanks 🙂

    1 user thanked author for this post.
    #141939

    Interesting

    But in 10.3 i can only find the indicator

    not the parts (prtbandsup and prtbandsdown) in the probuilder functions list

    #141940

    Ok i read to fast

    Have to wait for it as i am with IG

    (sorry cant edit)

    #141949

    Thank you PRT and Nicolas!

    We may now not need any other Indicator! 🙂

    I’m dying to turn PRT Bands into an Auto-System … will this be possible in v10.3?


    #141963

    PRT Bands will be released for IG customers next week.

    2 users thanked author for this post.
    #141969

    Example 2:

    Trend of the PRTBandsShortTerm line : (signal & trend)


    1 user thanked author for this post.
    #141971

    Example 3:

    The bearish trend is active since 3 months in weekly timeframe and the price is resting above the 61.8% retracement between the 2 long terms bands, this potentially signal a new uptrend coming with a breakout of the upper band.

    Do not hesitate to post your ideas afterwards, I will try to program them as soon as possible!

    1 user thanked author for this post.
    #142079

    Thank you Nicolas. I guess this indicator is an adaptation of the indicator previously owned by Trendfrance.

    However I can’t use the functions PRTBandsUp and PRTBandsDown for the moment.

    #142081

    Thank you Nicolas. I guess this indicator is an adaptation of the indicator previously owned by Trendfrance.

    However I can’t use the functions PRTBandsUp and PRTBandsDown for the moment.

    Sorry, I just saw you said it will be available soon.

    #142091

    Indeed, if you are with IG programming instructions will come next week or so 🙂

    1 user thanked author for this post.
    #144989

    Has any one figured how to simply establish that there´s a trend? For example, I don´t want make an entry at the exact point where price crosses over the upper band. I do however want to know if the price is in the green or the red area. Example: “if trend = green and shortterm line > shortterm line [1] then entry. I may have just missed something in the manual but asking for help anyway.

    #144993

    Here is the code you are requesting, buy entry when the trend is bullish (in green zone) and when the short term line just made a hook from descending to ascending state:


    1 user thanked author for this post.
    #145003

    Excellent, thank you very much Nicolas!

Viewing 15 posts - 1 through 15 (of 36 total)

Create your free account now and post your request to benefit from the help of the community
Register or Login