Hi there.
I am either making a classic syntax error here or I am missing a piece of the code puzzle!….
Backtesting only.
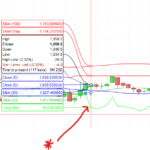
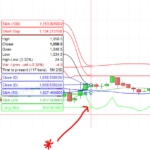
I am looking for a visual line between the trade entry bar and the trade exit bar (all entered trades).
Long trade entry/exit = green line
Short trade entry/exit = red line
The line needs to remain on the chart, for a visual evaluation of the backtest process.
// ========================================================================
// STRATEGY: DMI-ADX Crossover with Stop Loss + Opposite Signal Exit
// ========================================================================
// BT-DMI-testV3.0.3viasupport

// === INPUTS ===
myDMIperiod = myDMIperiod // 10 // optimize from 1 to 20 via PRT Platform
myATRperiod = 14
myATRmultiplier = 2.5
myRiskPercent = 5 // Risk percentage (5%)
myInitialBalance = 100000 // Starting capital
myADXThreshold = 20 // Minimum ADX value for trend strength confirmation

// === INDICATORS ===
myDIplus = DIPLUS[myDMIperiod]
myDIminus = DIMINUS[myDMIperiod]
myADX = ADX[myDMIperiod]
myATR = AVERAGETRUERANGE[myATRperiod]

// === SIGNALS ===
// Basic DMI crossover signals - SAME BAR ENTRY
myLongSignal = myDIplus CROSSES OVER myDIminus
myShortSignal = myDIminus CROSSES OVER myDIplus

// ADX trend strength filter
myADXStrong = myADX > myADXThreshold

// Final signals with filter applied
myLongSignal = myLongSignal AND myADXStrong
myShortSignal = myShortSignal AND myADXStrong

// === STOP LOSS DISTANCE ===
myStopLossDistance = myATR * myATRmultiplier

// === RISK MANAGEMENT ===
// Initialize account balance tracking
ONCE myCurrentBalance = myInitialBalance
ONCE myPreviousEquity = myInitialBalance
ONCE myProfitLoss = 0

// Update account balance based on closed positions
IF BarsSince(LongOnMarket) = 0 OR BarsSince(ShortOnMarket) = 0 THEN
// New position opened
myPreviousEquity = myCurrentBalance
ENDIF

// If position was closed on previous bar, update the balance
IF (LongOnMarket[1] AND NOT LongOnMarket) OR (ShortOnMarket[1] AND NOT ShortOnMarket) THEN
// Calculate profit/loss from the closed position
IF LongOnMarket[1] THEN
myProfitLoss = (close[1] - POSITIONPRICE[1]) * COUNTOFPOSITION[1]
ELSE
myProfitLoss = (POSITIONPRICE[1] - close[1]) * ABS(COUNTOFPOSITION[1])
ENDIF

// Update current balance
myCurrentBalance = myCurrentBalance + myProfitLoss
ENDIF

// Calculate position size based on risk
myRiskAmount = myCurrentBalance * (myRiskPercent / 100)

// Calculate position size based on stop loss distance
IF myStopLossDistance > 0 THEN
myRiskBasedPositionSize = ROUND(myRiskAmount / myStopLossDistance)
// Ensure minimum position size of 1
IF myRiskBasedPositionSize < 1 THEN
myRiskBasedPositionSize = 1
ENDIF
ELSE
myRiskBasedPositionSize = 1
ENDIF

// === STATE FLAGS ===
// Initialize these variables only once to maintain state between bars
ONCE myReverseToLong = 0
ONCE myReverseToShort = 0
ONCE myEntryPrice = 0
ONCE myLongStopLevel = 0
ONCE myShortStopLevel = 0
ONCE myLongEntryBar = 0
ONCE myShortEntryBar = 0

// === POSITION MANAGEMENT ===
IF LongOnMarket THEN
// Store entry price when entering a position
IF BarsSince(LongOnMarket) = 0 THEN
myEntryPrice = close
myLongStopLevel = myEntryPrice - myStopLossDistance
myLongEntryBar = BarIndex
ENDIF

// 1. Check stop loss
IF low <= (myEntryPrice - myStopLossDistance) THEN
SELL AT MARKET
DRAWSEGMENT(myLongEntryBar, myLongStopLevel, BarIndex, myLongStopLevel) COLOURED(0,255,0)
myLongStopLevel = undefined
ELSE
// 2. Check for reversal
IF myShortSignal THEN
SELL AT MARKET
DRAWSEGMENT(myLongEntryBar, myLongStopLevel, BarIndex, myLongStopLevel) COLOURED(0,255,0)
myReverseToShort = 1
myLongStopLevel = undefined
ENDIF
ENDIF
ENDIF

IF ShortOnMarket THEN
// Store entry price when entering a position
IF BarsSince(ShortOnMarket) = 0 THEN
myEntryPrice = close
myShortStopLevel = myEntryPrice + myStopLossDistance
myShortEntryBar = BarIndex
ENDIF

// 1. Check stop loss
IF high >= (myEntryPrice + myStopLossDistance) THEN
EXITSHORT AT MARKET
DRAWSEGMENT(myShortEntryBar, myShortStopLevel, BarIndex, myShortStopLevel) COLOURED(255,0,0)
myShortStopLevel = undefined
ELSE
// 2. Check for reversal
IF myLongSignal THEN
EXITSHORT AT MARKET
DRAWSEGMENT(myShortEntryBar, myShortStopLevel, BarIndex, myShortStopLevel) COLOURED(255,0,0)
myReverseToLong = 1
myShortStopLevel = undefined
ENDIF
ENDIF
ENDIF

// === ENTRY WHEN FLAT ===
IF NOT LongOnMarket AND NOT ShortOnMarket THEN
IF myReverseToLong THEN
BUY myRiskBasedPositionSize SHARES AT MARKET
myReverseToLong = 0
ELSE
IF myReverseToShort THEN
SELLSHORT myRiskBasedPositionSize SHARES AT MARKET
myReverseToShort = 0
ELSE
IF myLongSignal THEN
BUY myRiskBasedPositionSize SHARES AT MARKET
ELSE
IF myShortSignal THEN
SELLSHORT myRiskBasedPositionSize SHARES AT MARKET
ENDIF
ENDIF
ENDIF
ENDIF
ENDIF

// === VISUALIZATION USING DRAWSEGMENT ===
// Draw active stop loss lines while positions are open
IF LongOnMarket THEN
DRAWSEGMENT(myLongEntryBar, myLongStopLevel, BarIndex, myLongStopLevel) COLOURED(0,255,0)
ENDIF

IF ShortOnMarket THEN
DRAWSEGMENT(myShortEntryBar, myShortStopLevel, BarIndex, myShortStopLevel) COLOURED(255,0,0)
ENDIF

// === PRINT TRADE INFORMATION ===
// Display trade information in a table for debugging
PRINT myEntryPrice AS "Entry Price" COLOURED(255,255,255) FILLCOLOR(0,0,128)
PRINT myLongStopLevel AS "Long Stop" COLOURED(255,255,255) FILLCOLOR(0,128,0)
PRINT myShortStopLevel AS "Short Stop" COLOURED(255,255,255) FILLCOLOR(128,0,0)
PRINT myRiskBasedPositionSize AS "Position Size" COLOURED(255,255,255) FILLCOLOR(0,0,128)
PRINT myCurrentBalance AS "Account Balance" COLOURED(255,255,255) FILLCOLOR(0,0,128)

// Signal visualization variable
IF myLongSignal THEN
mySignalVisualization = 1
ELSIF myShortSignal THEN
mySignalVisualization = -1
ELSE
mySignalVisualization = 0
ENDIF

// graph mySignalVisualization
There are syntax errors on the DRAWSEGMENT x2 and the ENDIF !!!
I cant see why the error occur?
As always, any code guidance is much appreciated.
With thanks,
NT


