Pivot Point Hi Low Indicator?

Viewing 15 posts - 1 through 15 (of 15 total)
  • Author
    Posts
  • #12382 quote
    Travis ClaytonTravis Clayton
    Participant
    New

    Thank you in advance for looking at this post. I have been trying to code an indicator that only shows the last highest high of 7 days and only the lowest low of 7 days with an arrow up or down. The code i have so far is below, but it does not look correct. Can anyone here see what i am doing wrong. Once I get it right, i want to add a moving average to the indicator to return a chart that looks something like:

    https://www.youtube.com/watch?v=kVyMj1zDHCY

    Current Code:

    PPH = highest [7] (high)
    PPL = lowest [7] (low)
    
    if pph [0] > high [7] then
    
    DRAWARROWDOWN(barindex[1],high[1])coloured(255,10,10)
    endif
    if ppl [0] < low [7] then
    DRAWARROWUP(barindex[1],low[1])coloured(10,255,10)
    endif
    a = pph
    b = ppl
    
    RETURN a COLOURED (0,255,255) as "weightedaverage [1]", b COLOURED (0,255,255) as "weighted average [1]"


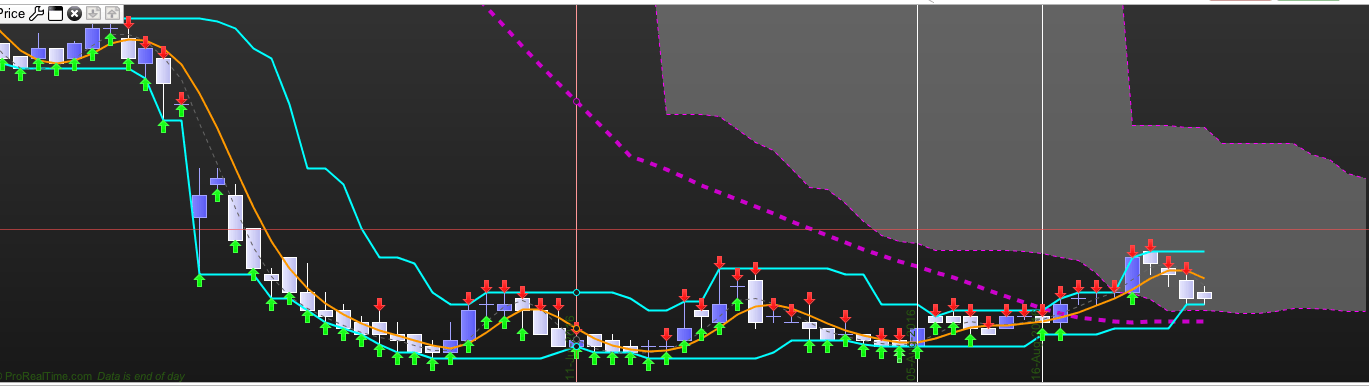
    Also attached is a picture of what the chart looks like with this code. HELP!!????

    Screen-Shot-2016-08-29-at-8.56.59-PM.png Screen-Shot-2016-08-29-at-8.56.59-PM.png
    #12390 quote
    NicolasNicolas
    Keymaster
    Legend

    So you want to throw arrows on chart when you are breaking the highest high and lowest low of the last 7 periods?

    #12462 quote
    Travis ClaytonTravis Clayton
    Participant
    New

    Hi Nicolas,

    I am wanting to identify the highest high of the past 7 days and the lowest low of the past seven days. I then want to apply a line/segment or moving average to  those points as is shown in the youtube link. I also want to create a CMO indicator that is based on the highs and lows of the created indicator. I have tried to code this myself, but lack the coding knowledge to achieve this. The nearest i have been able to achieve is a segment on a the high. Any ideas?

    Regards,

    Travis

    #12466 quote
    NicolasNicolas
    Keymaster
    Legend

    The highest high and lowest low of the past 7 days is nothing more than a donchian channel of 7 periods 🙂

    About the CMO indicator, could you please explain me a bit? I prefer words than a youtube video, please.

    #12480 quote
    bardbard
    Participant
    Average
    #12490 quote
    NicolasNicolas
    Keymaster
    Legend

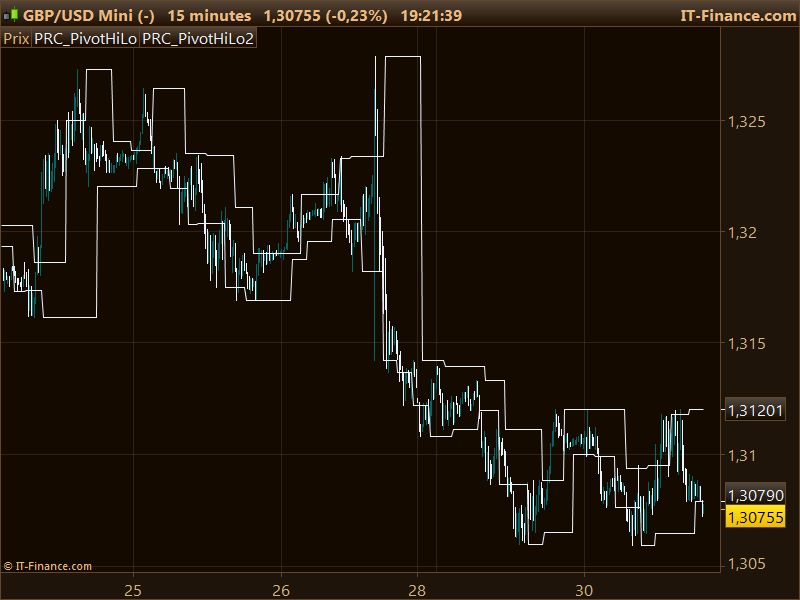
    Ok thanks, I coded it. Please find attached the indicators and how it feels on PRT 10.2

    Indicator also added to the Library : http://www.prorealcode.com/prorealtime-indicators/bar-count-reversals-pivot-points-highlow/

    PRC_PivotHiLo.itf pivot-high-low.png pivot-high-low.png
    #48008 quote
    zuzito28zuzito28
    Participant
    Junior

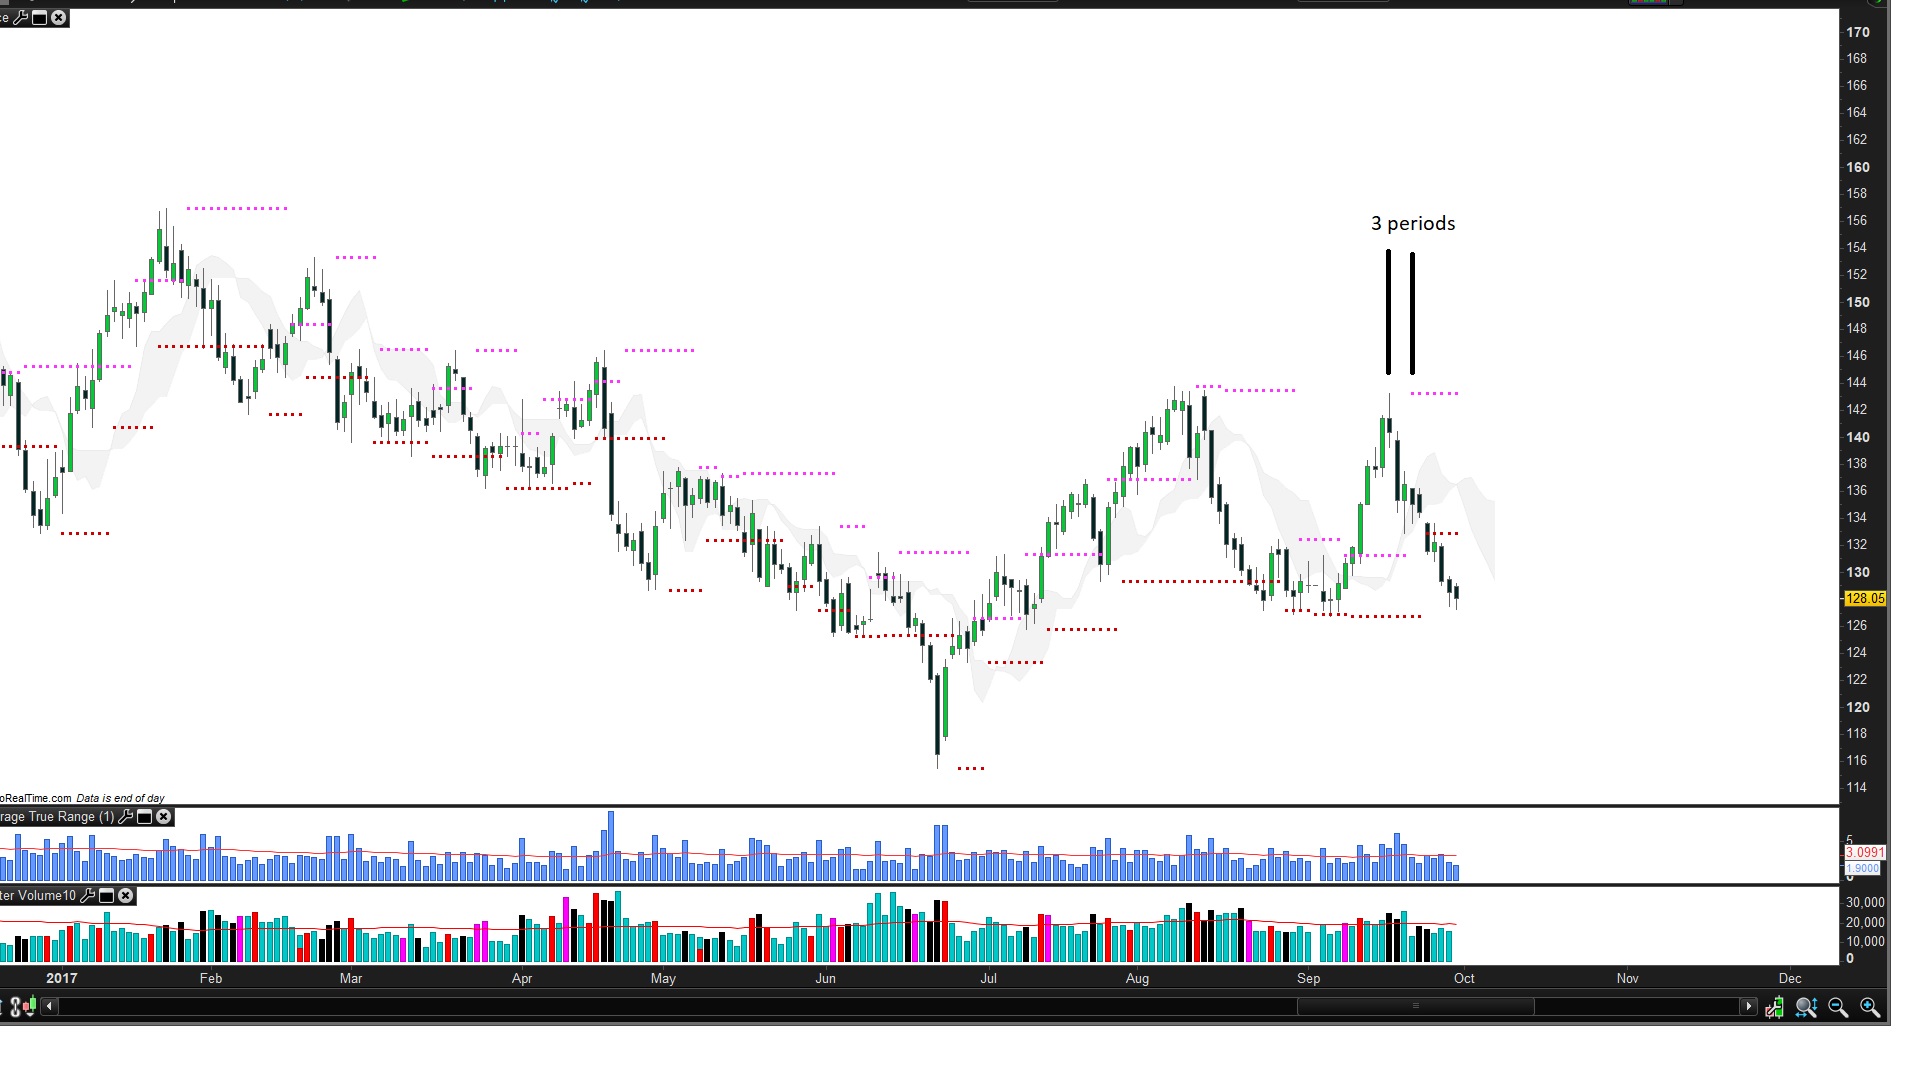
    thank you for indi.  But why it shows pivots 3 periods forvard ? How can I change it?

    Bez-názvu.jpg Bez-názvu.jpg
    #48019 quote
    NicolasNicolas
    Keymaster
    Legend

    Because the detected levels are available 3 bars later 🙂 and also because more than 1 year ago, it was not possible to plot in the past, this is now possible with version 10.3.

    #48022 quote
    zuzito28zuzito28
    Participant
    Junior

    Thank’s.. How can I change code to plot pivots x periods back ? If I use period 4  , plot pivots 4 periods backward…

    This version is little bit chaotic for me.

    #48029 quote
    NicolasNicolas
    Keymaster
    Legend

    You can replace the code of the indicator with this one:

    //PRC_PivotHiLo
    //30.08.2016
    //Nicolas @ www.prorealcode.com
    //Sharing ProRealTime knowledge
    
    p = 4
    
    period = round(p/2)+1
    hh = high[period]
    ll = low[period]
    countH = 0
    countL = 0
    for i = 1 to period-1 do
    if high[i]<hh then
    countH=countH+1
    endif
    if low[i]>ll then
    countL=countL+1
    endif
    next
    for i = period+1 to p+1 do
    if high[i]<hh then
    countH=countH+1
    endif
    if low[i]>ll then
    countL=countL+1
    endif
    next
    
    if countH=p then
    pivotH = high[period]
    endif
    if countL=p then
    pivotL = low[period]
    endif
    
    drawtext("•",barindex[period],pivotH) 
    drawtext("•",barindex[period],pivotL)
    
    RETURN //pivotH, pivotL

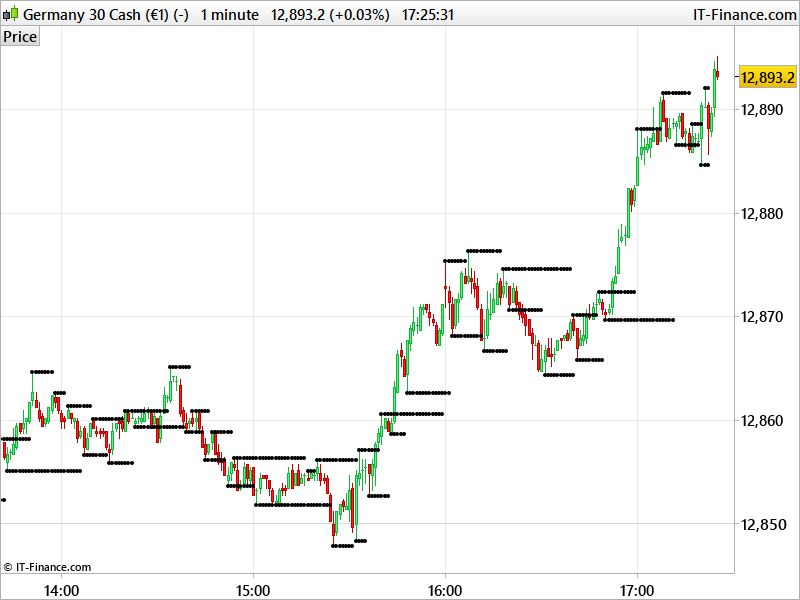
    Now, dots begin to draw at the right bar in the past until a new highest high or lowest low is discovered.

    turning-points-indicator.png turning-points-indicator.png
    #48052 quote
    zuzito28zuzito28
    Participant
    Junior

    Thank you. Works well. last thing, color is black. how can I change it?


    Thank you very much.

    #48082 quote
    NicolasNicolas
    Keymaster
    Legend

    Just the RGB color you want for each of the dots code, example (red for lower ones and green for upper ones)

    drawtext("•",barindex[period],pivotH) coloured(0,255,0)
    drawtext("•",barindex[period],pivotL) coloured(255,0,0)
    #48087 quote
    zuzito28zuzito28
    Participant
    Junior

    Thank you.

    I compre this pivotHiLo with tradingview pivot HiLo.  Is possible add this formula ?    ” //h1 is a pivot of h if it holds for the full length ”

    ” //The length defines how many periods a high or low must hold to be a “relevant pivot”   ”

    Tradingview code

    study(title=”Pivot Points H/L”, shorttitle=”Pivots H/L”, overlay=true)
    len = input(14, minval=1, title=”Length”)
    //The length defines how many periods a high or low must hold to be a “relevant pivot”

    h = highest(len)
    //The highest high over the length
    h1 = dev(h, len) ? na : h
    //h1 is a pivot of h if it holds for the full length
    hpivot = fixnan(h1)
    //creates a series which is equal to the last pivot

    l = lowest(len)
    l1 = dev(l, len) ? na : l
    lpivot = fixnan(l1)
    //repeated for lows

    plot(hpivot, color=blue, linewidth=2, offset= -len+1)
    plot(lpivot, color=purple, linewidth=2, offset= -len+1)
    //plot(h1, color=black, style=circles, linewidth=4, offset= -len+1)
    //plot(l1, color=black, style=circles, linewidth=4, offset= -len+1)

    #48088 quote
    NicolasNicolas
    Keymaster
    Legend
    #48093 quote
    zuzito28zuzito28
    Participant
    Junior

    Ok.  Thank you very much.

Viewing 15 posts - 1 through 15 (of 15 total)

  • You must be logged in to reply to this topic.

ProRealAI ProRealAI New

Stuck on this ProBuilder code?

Describe what this topic is trying to build, in plain English, and ProRealAI writes the ProRealTime™ indicator, screener or system for you.

Available in 7 languages
Try ProRealAI

Pivot Point Hi Low Indicator?


ProBuilder: Indicators & Custom Tools

New Reply
Author
Summary

This topic contains 14 replies,
has 4 voices, and was last updated by zuzito28zuzito28

8 years, 12 months ago.

Topic Details
Forum: ProBuilder: Indicators & Custom Tools
Language: English
Started: 08/29/2016
Status: Active
Attachments: 5 files
ProRealCode ProRealCode
Loading...