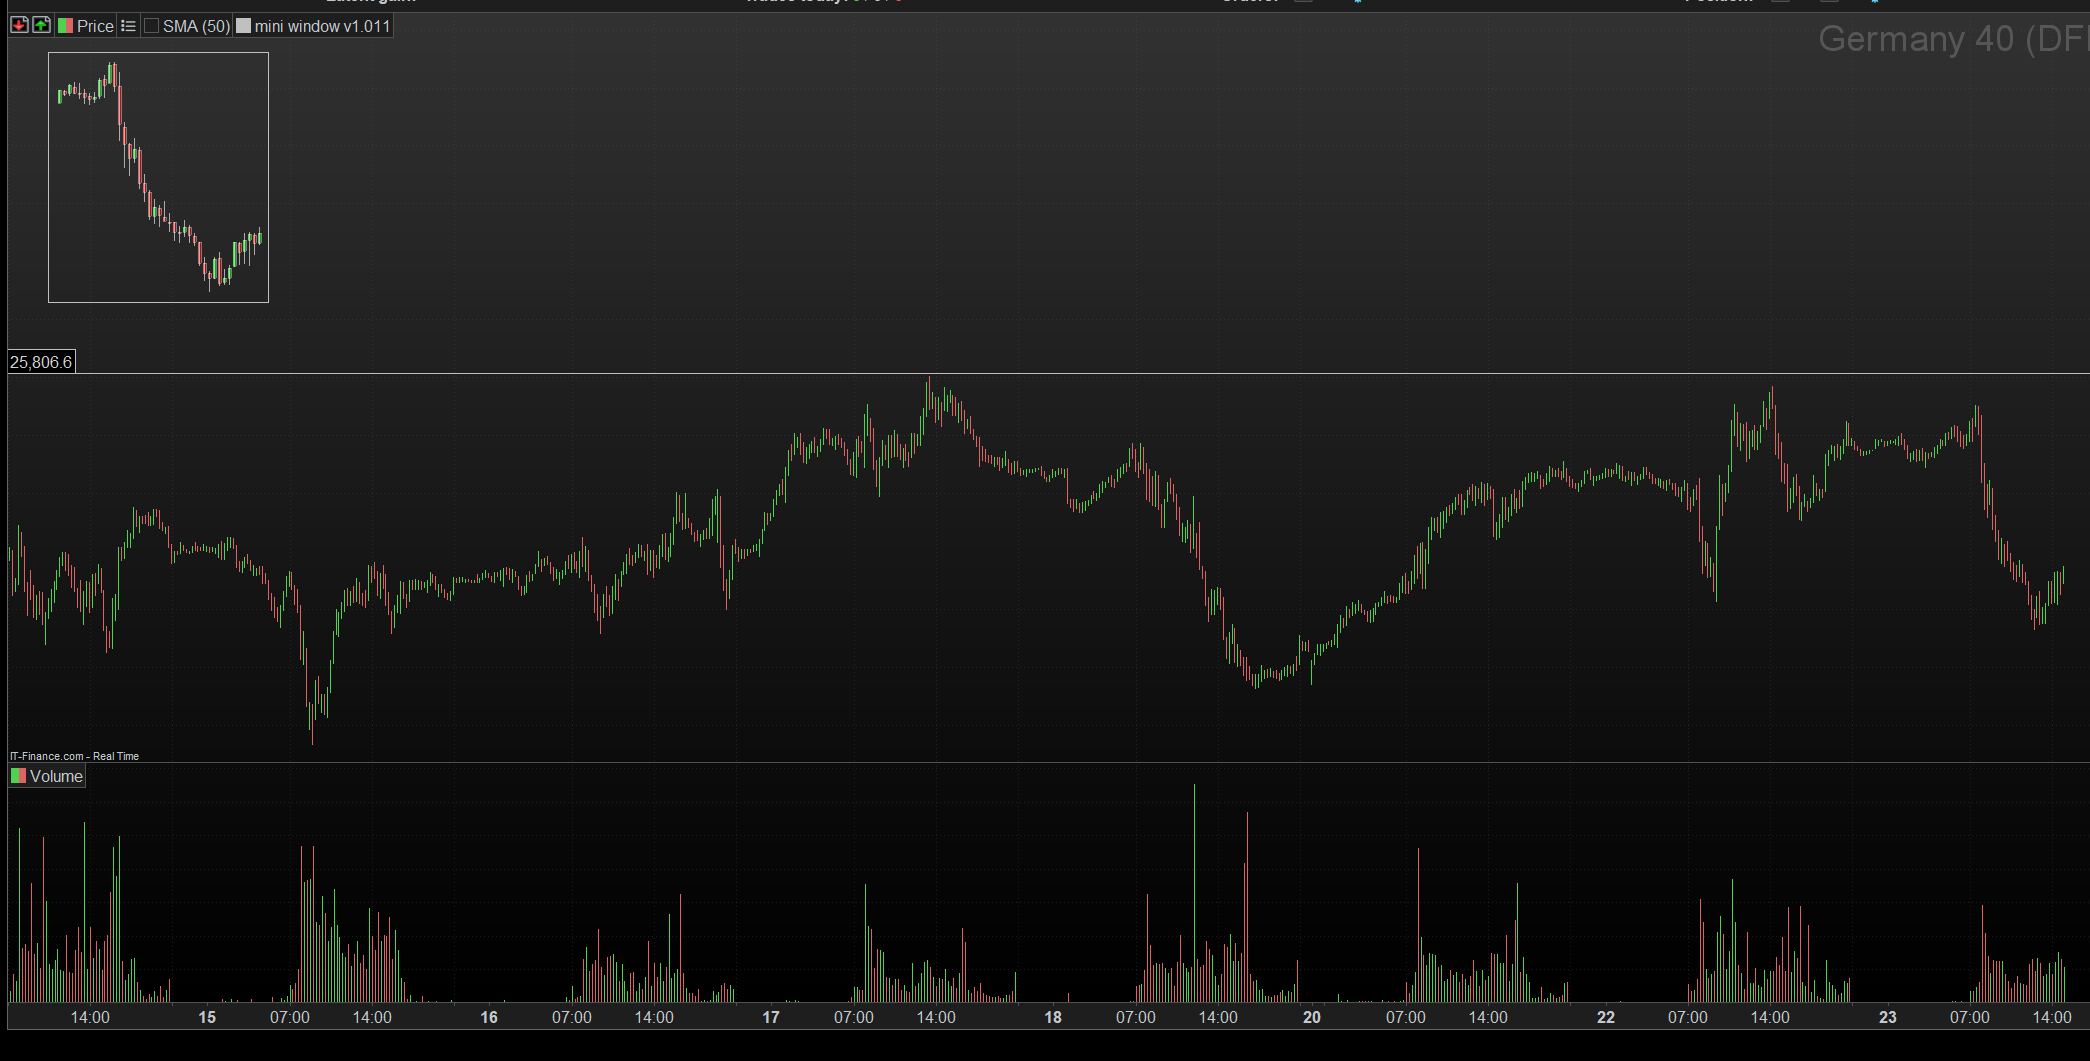
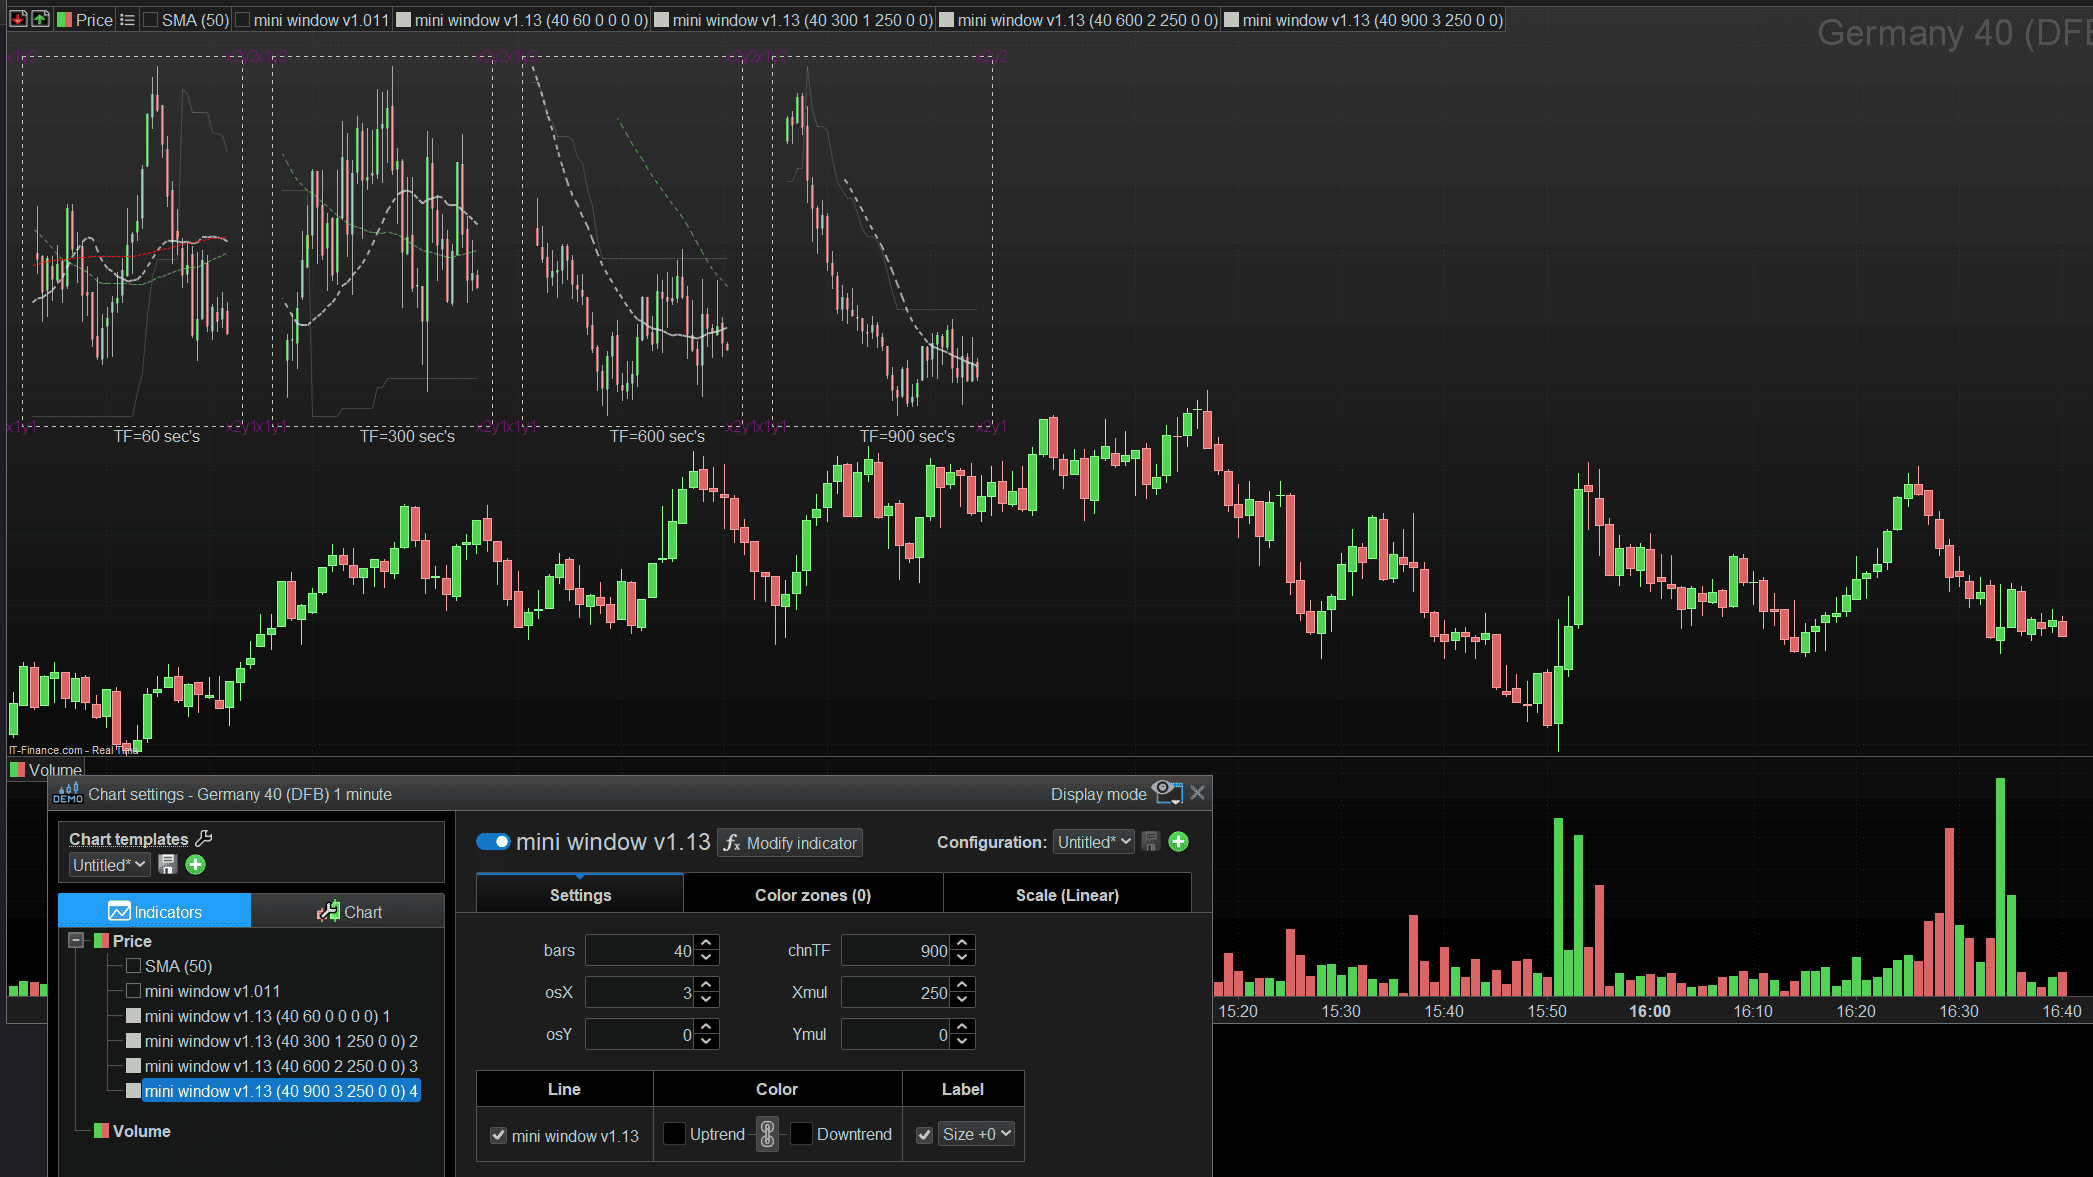
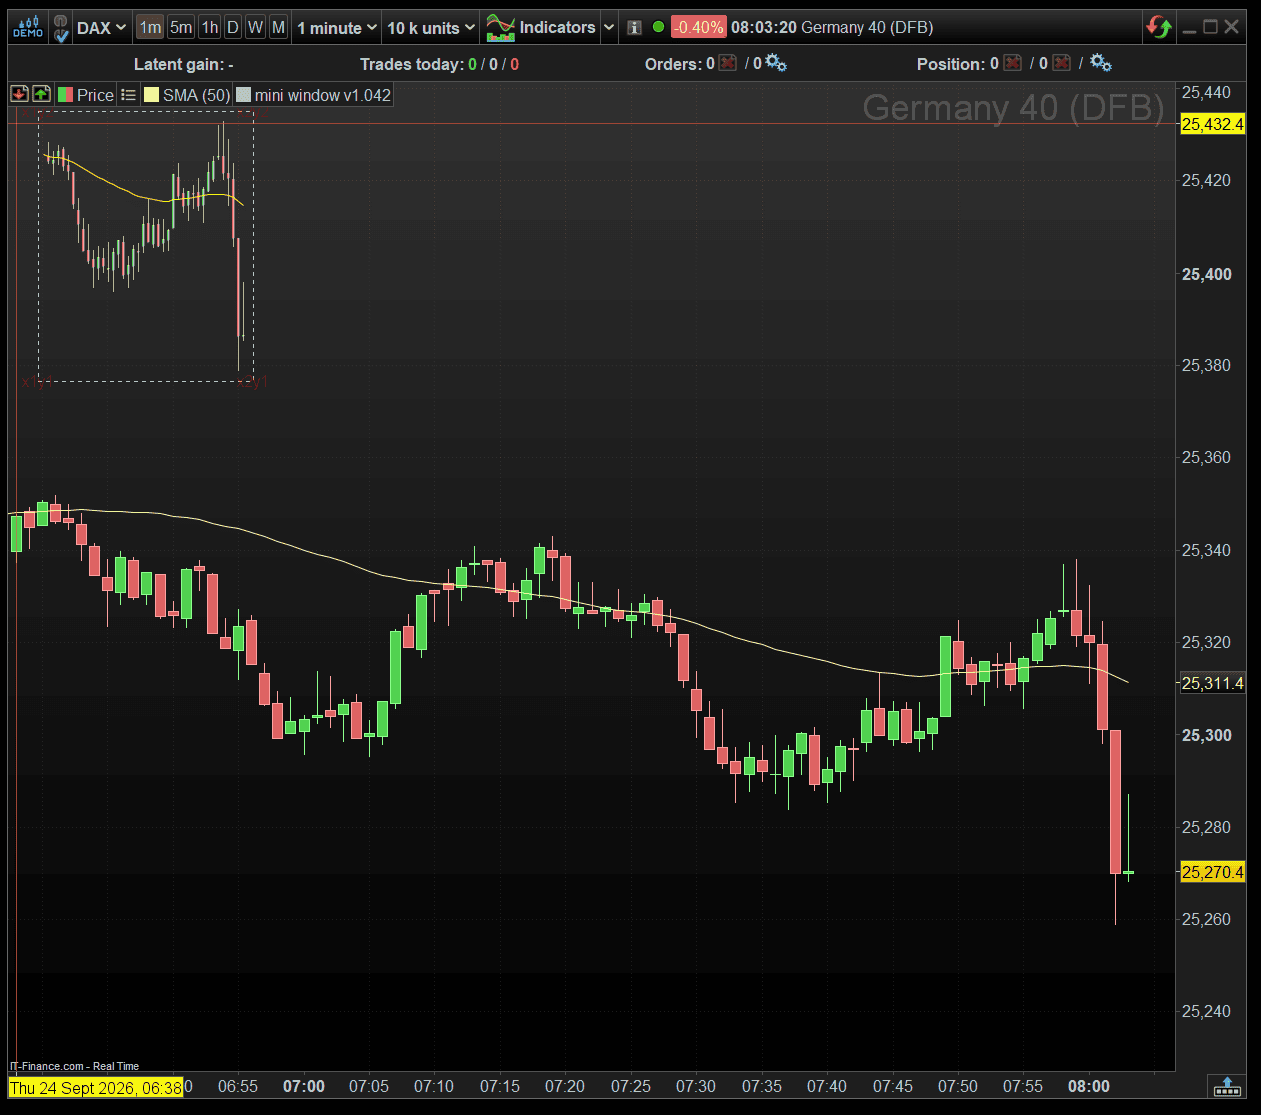
Now the mini window shows the candles, the next step is to add the indicators you may have on a full chart to aid reference of the bars. Here I take a Simple Moving Average and add to the window.
The main structure stay similar barring some variable names and equation changes, but the major change is the determining the higher high and lower low elements in the window..
In the prior version, this was done with the candle high and low, but, ‘indicator(s)’ could be higher and/or lower than the candles. Two arrays hold the value from each element to be displayed, and there is an extra section to find the highest and lowest from them. Though open and close are not needed, I’m treating them all as if there were indicator outputs.
There is a section to draw the indicator line using segments, which is from the bar centrers of the previous point to the new point.
Also note, most of code is inside a isLastBarUpdate block but the ‘Average’ keyword is outside. The OHLC values are embedded constants in PRT so when using inside isLastBarUpdate, (to skip historic bars,) all there values exist for each bar. But for Average , this is not the same and its output values are calculated on each bar. So, though code could be written to look back at the appropriate close values to get the Average LB bar output values, they would have to be stored in an array for later use. Here the simple solution is to put it outside the isLastBarUpdate and assume that the performance difference between the stock Average code running on all bars is faster than a custom code on a select number of bars.. Keeping it simple also allows stock/custom indicators to be usable and avoid re-inventing the wheel for each indicator/type.
defparam drawonlastbaronly = true

//timeframe(15minutes)

avg = average[50](close)  // got to be outside of islastbarupdate
// to populate prior bar values

if islastbarupdate then

LB = 40-1                       // lookback bars 0-39
sizeBar = 5                   // frame bar size pixels
winX =  max(sizeBar*LB,250)   // width of frame
winy =  min(winX,350)         // height of frame

// ------------------ absolute coords
ax1 = 40            // indent from left chart edge to left frame edge
ax2 = ax1 + winX    // right frame edge

ay1 = -40           // indent from top chart edge to top frame edge
ay2 = ay1 - winY    // bottom frame edge


// ------------------OHLC
// ------------------ lowest & highest over LB bars
$indL[0] = min(lowest[LB](open),open)    // max of open
$indH[0] = max(highest[LB](open),open)   // min of open
$indL[1] = min(lowest[LB](low),low)      // max of low
$indH[1] = max(highest[LB](low),low)     // min of low
$indL[2] = min(lowest[LB](high),high)    // max of high
$indH[2] = max(highest[LB](high),high)   // min of high
$indL[3] = min(lowest[LB](close),close)  // max of close
$indH[3] = max(highest[LB](close),close) // min of close


// ------------------ indicators
$indL[4] = min(lowest[LB](avg),avg)    // max of close
$indH[4] = max(highest[LB](avg),avg)   // min of close

// ---------------------------------------------------------------- candle range
// find the HH/LL of all items, $indL[] and $indH[].

for i = 0 to lastset($indH)

if i = 0 then
LL = $indL[i]              // start at a default, 1st in list!
HH = $indH[i]
elsif $indL[i] < LL then      //  further LL
LL = $indL[i]
elsif $indH[i] > HH then      // further HH
HH = $indH[i]
endif

next

loRef= LL   // lowest low from LB bars of $indL[]
HiRef= HH   // highest high from LB bars of $indH[]

hiLoRng = HiRef-LoRef                // vertical range over LB bars
ref = (winY)/hilorng                 // point to pixels conversion constant

// ---------------------------------------------------------------- candle display

for i = 0 to LB

xref = ax1 + (sizeBar * i) // reference to center of bar

op =  ay2+((open [LB-i]-loref)*ref) // pixel conversions
hi =  ay2+((high [LB-i]-loref)*ref) // take the difference between the current ohlc values
lo =  ay2+((low  [LB-i]-loref)*ref) // and the lowest low. LB-1 reverses the index to i.
cl =  ay2+((close[LB-i]-loref)*ref) // multiply by constant. reference all to frame bottom edge.


x1 = xref
x2 = xref

y1 = op
y2 = cl

// ------------------------------------------------ draw candles body
if op>cl then // bear candle
drawrectangle(x1-1,y1,x2+1,y2)anchor(topLeft,xshift,yshift)coloured("red",155)bordercolor("white",100)
else // bull candle
drawrectangle(x1-1,y1,x2+1,y2)anchor(topLeft,xshift,yshift)coloured("lime",155)bordercolor("white",100)
endif
// ------------------------------------------------ draw candles wicks
y1 = hi
y2 = lo
drawsegment(x1,y1,x2,y2)anchor(topLeft,xshift,yshift)coloured("white",155)
next

// ---------------------------------------------------------------- draw line

for i = 0 to LB
xref = ax1 + (sizeBar * i) // reference to center of bar

av =   ay2+((avg[LB-i]  -loref)*ref)
av1 =  ay2+((avg[LB-i+1]-loref)*ref) // +1 for prior position

x1 = xref-5 // -5 is so the segment is draw from the last position to the new position
x2 = xref


y1 = av1
y2 = av
drawsegment(x1,y1,x2,y2)anchor(topLeft,xshift,yshift)coloured("yellow",255)
next

// ---------------------------------------------------------------- rectangle border

indent = 10 // outside of frame

x1 = ax1 - indent
x2 = ax1 + (LB*sizeBar ) +indent   // max left width

y1 = 0 + ay2 - indent            // max top height
y2 = y1 + winY + (2 * indent)

drawrectangle(x1,y1,x2,y2)anchor(topleft,xshift,yshift)style(dottedline,1)
// corner references
a=100
drawtext("x1y1",x1,y1)coloured("red",a)anchor(topleft,xshift,yshift)
drawtext("x2y2",x2,y2)coloured("red",a)anchor(topleft,xshift,yshift)
drawtext("x1y2",x1,y2)coloured("red",a)anchor(topleft,xshift,yshift)
drawtext("x2y1",x2,y1)coloured("red",a)anchor(topleft,xshift,yshift)


endif // skip historic bars

return