Hi T-rader,
i have done a test from start DAX 24 hours quota (from 02.08.2010) and then checked the most important parameters again with Walk forward.
Since the algo is based on 24 quotations, a test before 2.8.2010 makes only limited sense.
I have only played around with data before 2010 to test out whether the algo would have survived the financial crisis 2007-2008.
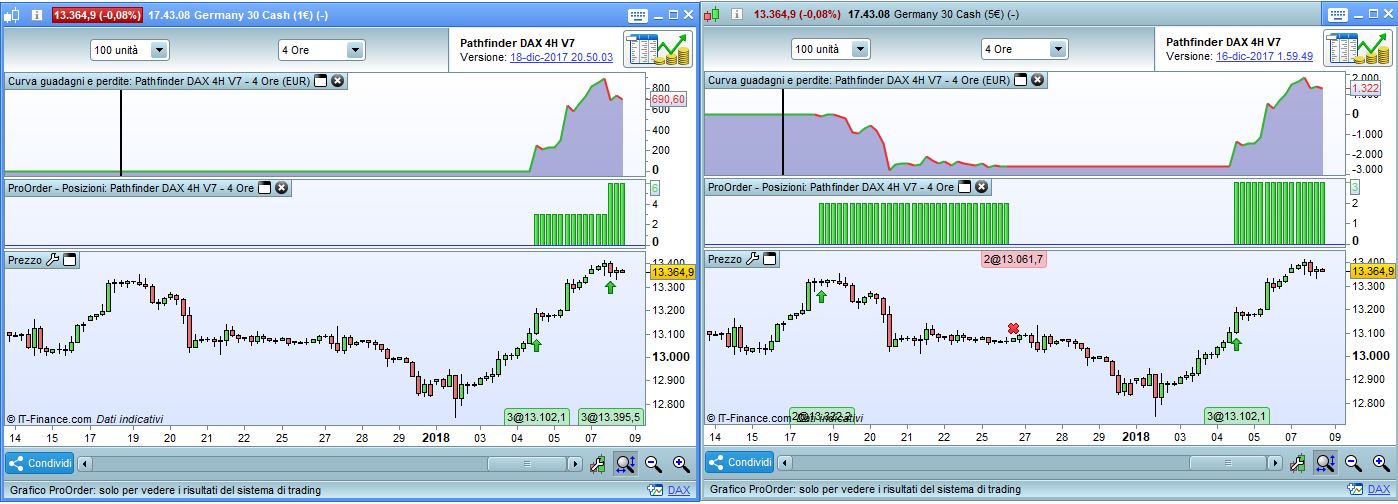
DAX V8 has earned its first Euros today – 131 pips, the result in demo and life is the same.
…and another position opens before we’ve even had a chance to spend our first fantasy winnings on virtual beer.
Hi Wisko,
Yes, I always check some parameters (see attached code) from top to bottom. Additionally I checked the most important parameters with WFW.
In my opinion, the parameters settings are very stable and only minor changes make sense.
// define intraday trading window
ONCE startTime                    = 90000  // start time of trading window in CET - do not change
ONCE endTime                      = 220000 // end time of trading window in CET - do not change

// define instrument signalline with help of multiple smoothed averages
ONCE periodFirstMA                = 5    // 5 is center of gravity, do not change
ONCE periodSecondMA               = 10   // 10 is center of gravity, do not change
ONCE periodThirdMA                = 3    // heartbeat of the instrument - do not change

// define filter parameter
ONCE periodLongMA                 = 450  // period lenght of the long moving average that works as filter - verify all 6 months
ONCE periodShortMA                = 40   // period lenght of the short moving average that works as filter - verify all 6 months

// define position and money management parameter
// size calculation: size = positionSize * trendMultiplier * saisonalPatternMultiplier
ONCE positionSize                 = 1    // default start size - do not check
ONCE trendMultiplier              = 2    // >1 with dynamic position sizing; 1 without - depends on your risk
ONCE maxPositionSizePerTrade      = 6    // maximum size per trade - depends on your risk
ONCE maxPositionSizeLong          = 9    // maximum size for a long position - depends on your risk
ONCE maxPositionSizeShort         = 9    // maximum size for a short position - depends on your risk

ONCE stopLossLong                 = 5    //3.5 in % - verify all 6 months
ONCE stopLossShort                = 2.5  // in % - verify all 6 months
ONCE takeProfitLong               = 3    // in % - verify all 6 months
ONCE takeProfitShort              = 3    //1.5 in % - verify all 6 months

ONCE trailingStartLong            = 1.5  //1.25 in % - verify all 6 months
ONCE trailingStartShort           = 0.75 //0.5 in % - verify all 6 months
ONCE trailingStepLong             = 0.5  // in % - verify all 6 months
ONCE trailingStepShort            = 0.5  // in % - verify all 6 months

ONCE maxCandlesLongWithProfit     = 16   //15 take long profit latest after x candles - verify all 6 months
ONCE maxCandlesShortWithProfit    = 5    // take short profit latest after x candles - verify all 6 months
ONCE maxCandlesLongWithoutProfit  = 75   //70 limit long loss latest after x candles - verify all 6 months
ONCE maxCandlesShortWithoutProfit = 70   // limit short loss latest after x candles - verify all 6 months

// define saisonal position multiplier for each month 1-15 / 16-31 (>0 - long / <0 - short / 0 no trade) - verify all 6 months
ONCE January1                     = 1 //1
ONCE January2                     = 0 //2 0
ONCE February1                    = 3 //3
ONCE February2                    = 1 //1
ONCE March1                       = 3 //3 1
ONCE March2                       = 3 //3
ONCE April1                       = 3 //2 3
ONCE April2                       = 3 //3
ONCE May1                         = 1 //1
ONCE May2                         = 3 //3
ONCE June1                        = 1 //1
ONCE June2                        = 3 //3
ONCE July1                        = 3 //3
ONCE July2                        = 0 //0
ONCE August1                      = 1 //1
ONCE August2                      = 1 //0 x
ONCE September1                   = 2 //2
ONCE September2                   = 0 //0
ONCE October1                     = 2 //3
ONCE October2                     = 2 //2
ONCE November1                    = 0 //0
ONCE November2                    = 3 //3
ONCE December1                    = 2 //2
ONCE December2                    = 2 //2
@Vonasi
there are no fantasy gains, I trade V8 live and for 131 euro I can drink more Guiness than I can handle : -)
but you’re right if it will really work, nobody knows for sure, the system looks good to me, provides a statistical advantage.
On the other hand, it is a very optimized approach and there is of course the risk of going bankrupt because the system is very active.
I have done it with my possible for my requirements, everyone has to check it, everybody should understand how the system works and what kind of risk one takes. Run it first in demo and then trade with a small size live – these are my recommendations for everyone
Hello Reiner.
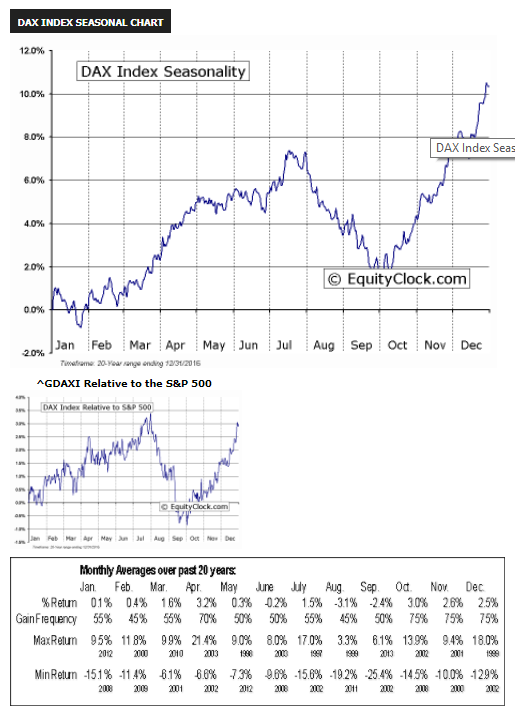
I’m still playing catch up with your Pathfinder strategies and there are an awful lot of posts to read through! The seasonality factor seems fascinating and I believe would be a benefit to any strategy. I’m interested in knowing what method you use to decide what seasonal multiplier to apply to each half month. I’m guessing that you use EquityClock.com for the statistical info but then how do you convert the information as in the image attached to get the final multipliers like this?
ONCE January1                     = 1 //1
ONCE January2                     = 0 //2 0
ONCE February1                    = 3 //3
ONCE February2                    = 1 //1
ONCE March1                       = 3 //3 1
ONCE March2                       = 3 //3
ONCE April1                       = 3 //2 3
ONCE April2                       = 3 //3
ONCE May1                         = 1 //1
ONCE May2                         = 3 //3
ONCE June1                        = 1 //1
ONCE June2                        = 3 //3
ONCE July1                        = 3 //3
ONCE July2                        = 0 //0
ONCE August1                      = 1 //1
ONCE August2                      = 1 //0 x
ONCE September1                   = 2 //2
ONCE September2                   = 0 //0
ONCE October1                     = 2 //3
ONCE October2                     = 2 //2
ONCE November1                    = 0 //0
ONCE November2                    = 3 //3
ONCE December1                    = 2 //2
ONCE December2                    = 2 //2
Hi Vonasi,
I determine the seasonalities in three steps.
- First, I use a daily data based Pathfinder version to determine the seasonality over the maximum available time 30-50 years.
- Then I determine the seasonality for the last 10 years or from the start of the backtest (usually 2.8.2010 – on this date IG introduced the 24-hour quoting for the most indices)
- as quality assurance I compare my version with available sources such as equityclock.com
I optimize each time unit from 0 – 3.
- 0 – means trading has not produced a positive result in the last few years
- 1 – no clear trend, but the opportunity is to be traded
- 2 – good chance-risk ratio
- 3 – very good chance-risk ratio
I always prefer to trade the chance (1-3) and only take zero if there is clearly no positive return in the past. The drawdown (<30%) and a good profit-loss ratio (>70%) is more important to me than a high profit. I usually prioritize the recent past (step 2). If the optimization results are close to each other, I always take the lower value (nearly the same result with lower risk).
let’s check the current DAX saisonal profile:
ONCE January1                      = 2    //0 risk(2) *changed from 3
ONCE January2                      = 0    //3 ok
ONCE February1                     = 3    //3 ok
ONCE February2                     = 3    //0 risk(3)
ONCE March1                        = 3    //0 risk(3)
ONCE March2                        = 2    //3 ok
ONCE April1                        = 2    //3 ok *changed from 1
ONCE April2                        = 3    //3 ok
ONCE May1                          = 1    //0 risk(1)
ONCE May2                          = 2    //0 risk(2)
ONCE June1                         = 1    //1 ok
ONCE June2                         = 2    //3 ok
ONCE July1                         = 3    //1 chance
ONCE July2                         = 2    //3 ok
ONCE August1                       = 2    //1 chance
ONCE August2                       = 1    //3 ok *changed from 3
ONCE September1                    = 3    //0 risk(3)
ONCE September2                    = 0    //0 ok
ONCE October1                      = 3    //0 risk(3)
ONCE October2                      = 3    //3 ok *changed from 2
ONCE November1                     = 2    //1 chance *changed from 1
ONCE November2                     = 3    //3 ok
ONCE December1                     = 3    //1 chance
ONCE December2                     = 2    //3 ok
in the comment you will find the best value for the maximum available time (for the DAX approx. 30 years).
Many ok’s means a match of short and longtime seasonality (frequently occurs in commodities) and is the perfect setting. Frequent risk(x) means that seasonality has shifted because e.g. many indices are in a bull market since 2009.
I prefer to split up the month in two parts to handle better e.g. DAX future and option expiration.
Seasonal profiles provide an additional statistical advantage if the future behaves like the past, due events as future expiration, window dressing or holiday seasons.
In my experience seasonality works well in 4H or 1d time units but it’s just a filter and not a holy grail!
Best regards,
Reiner
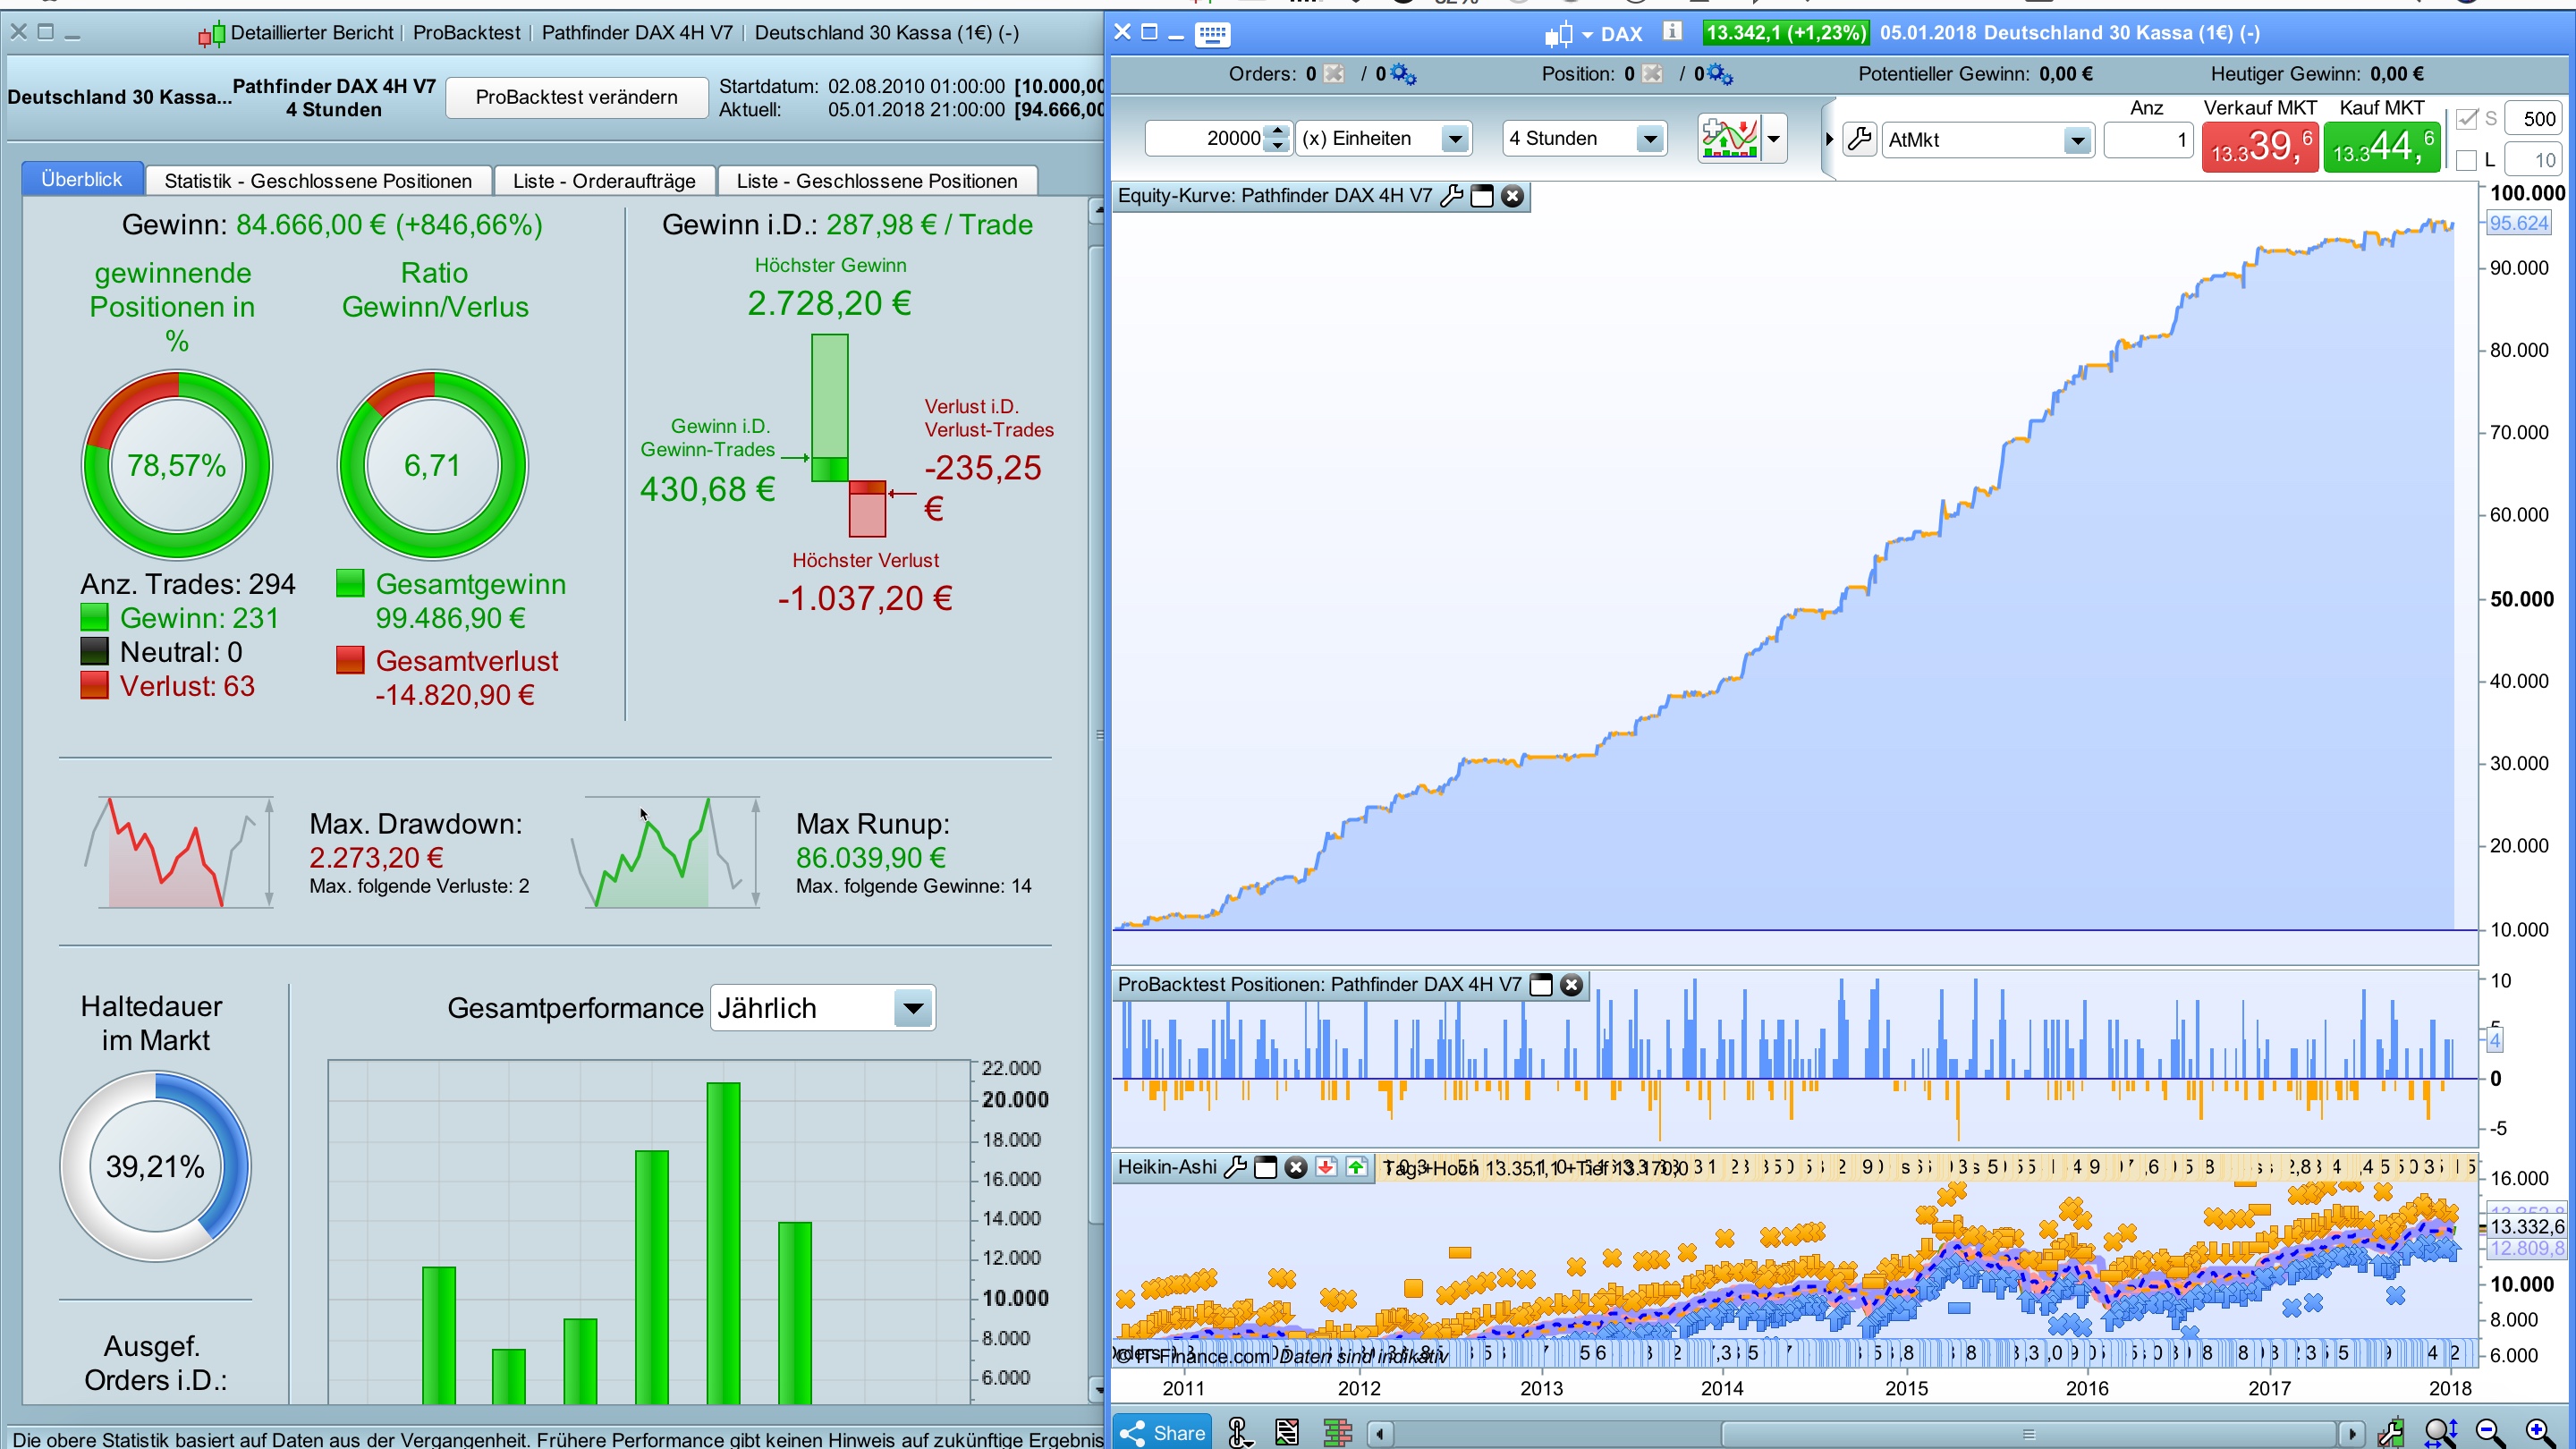
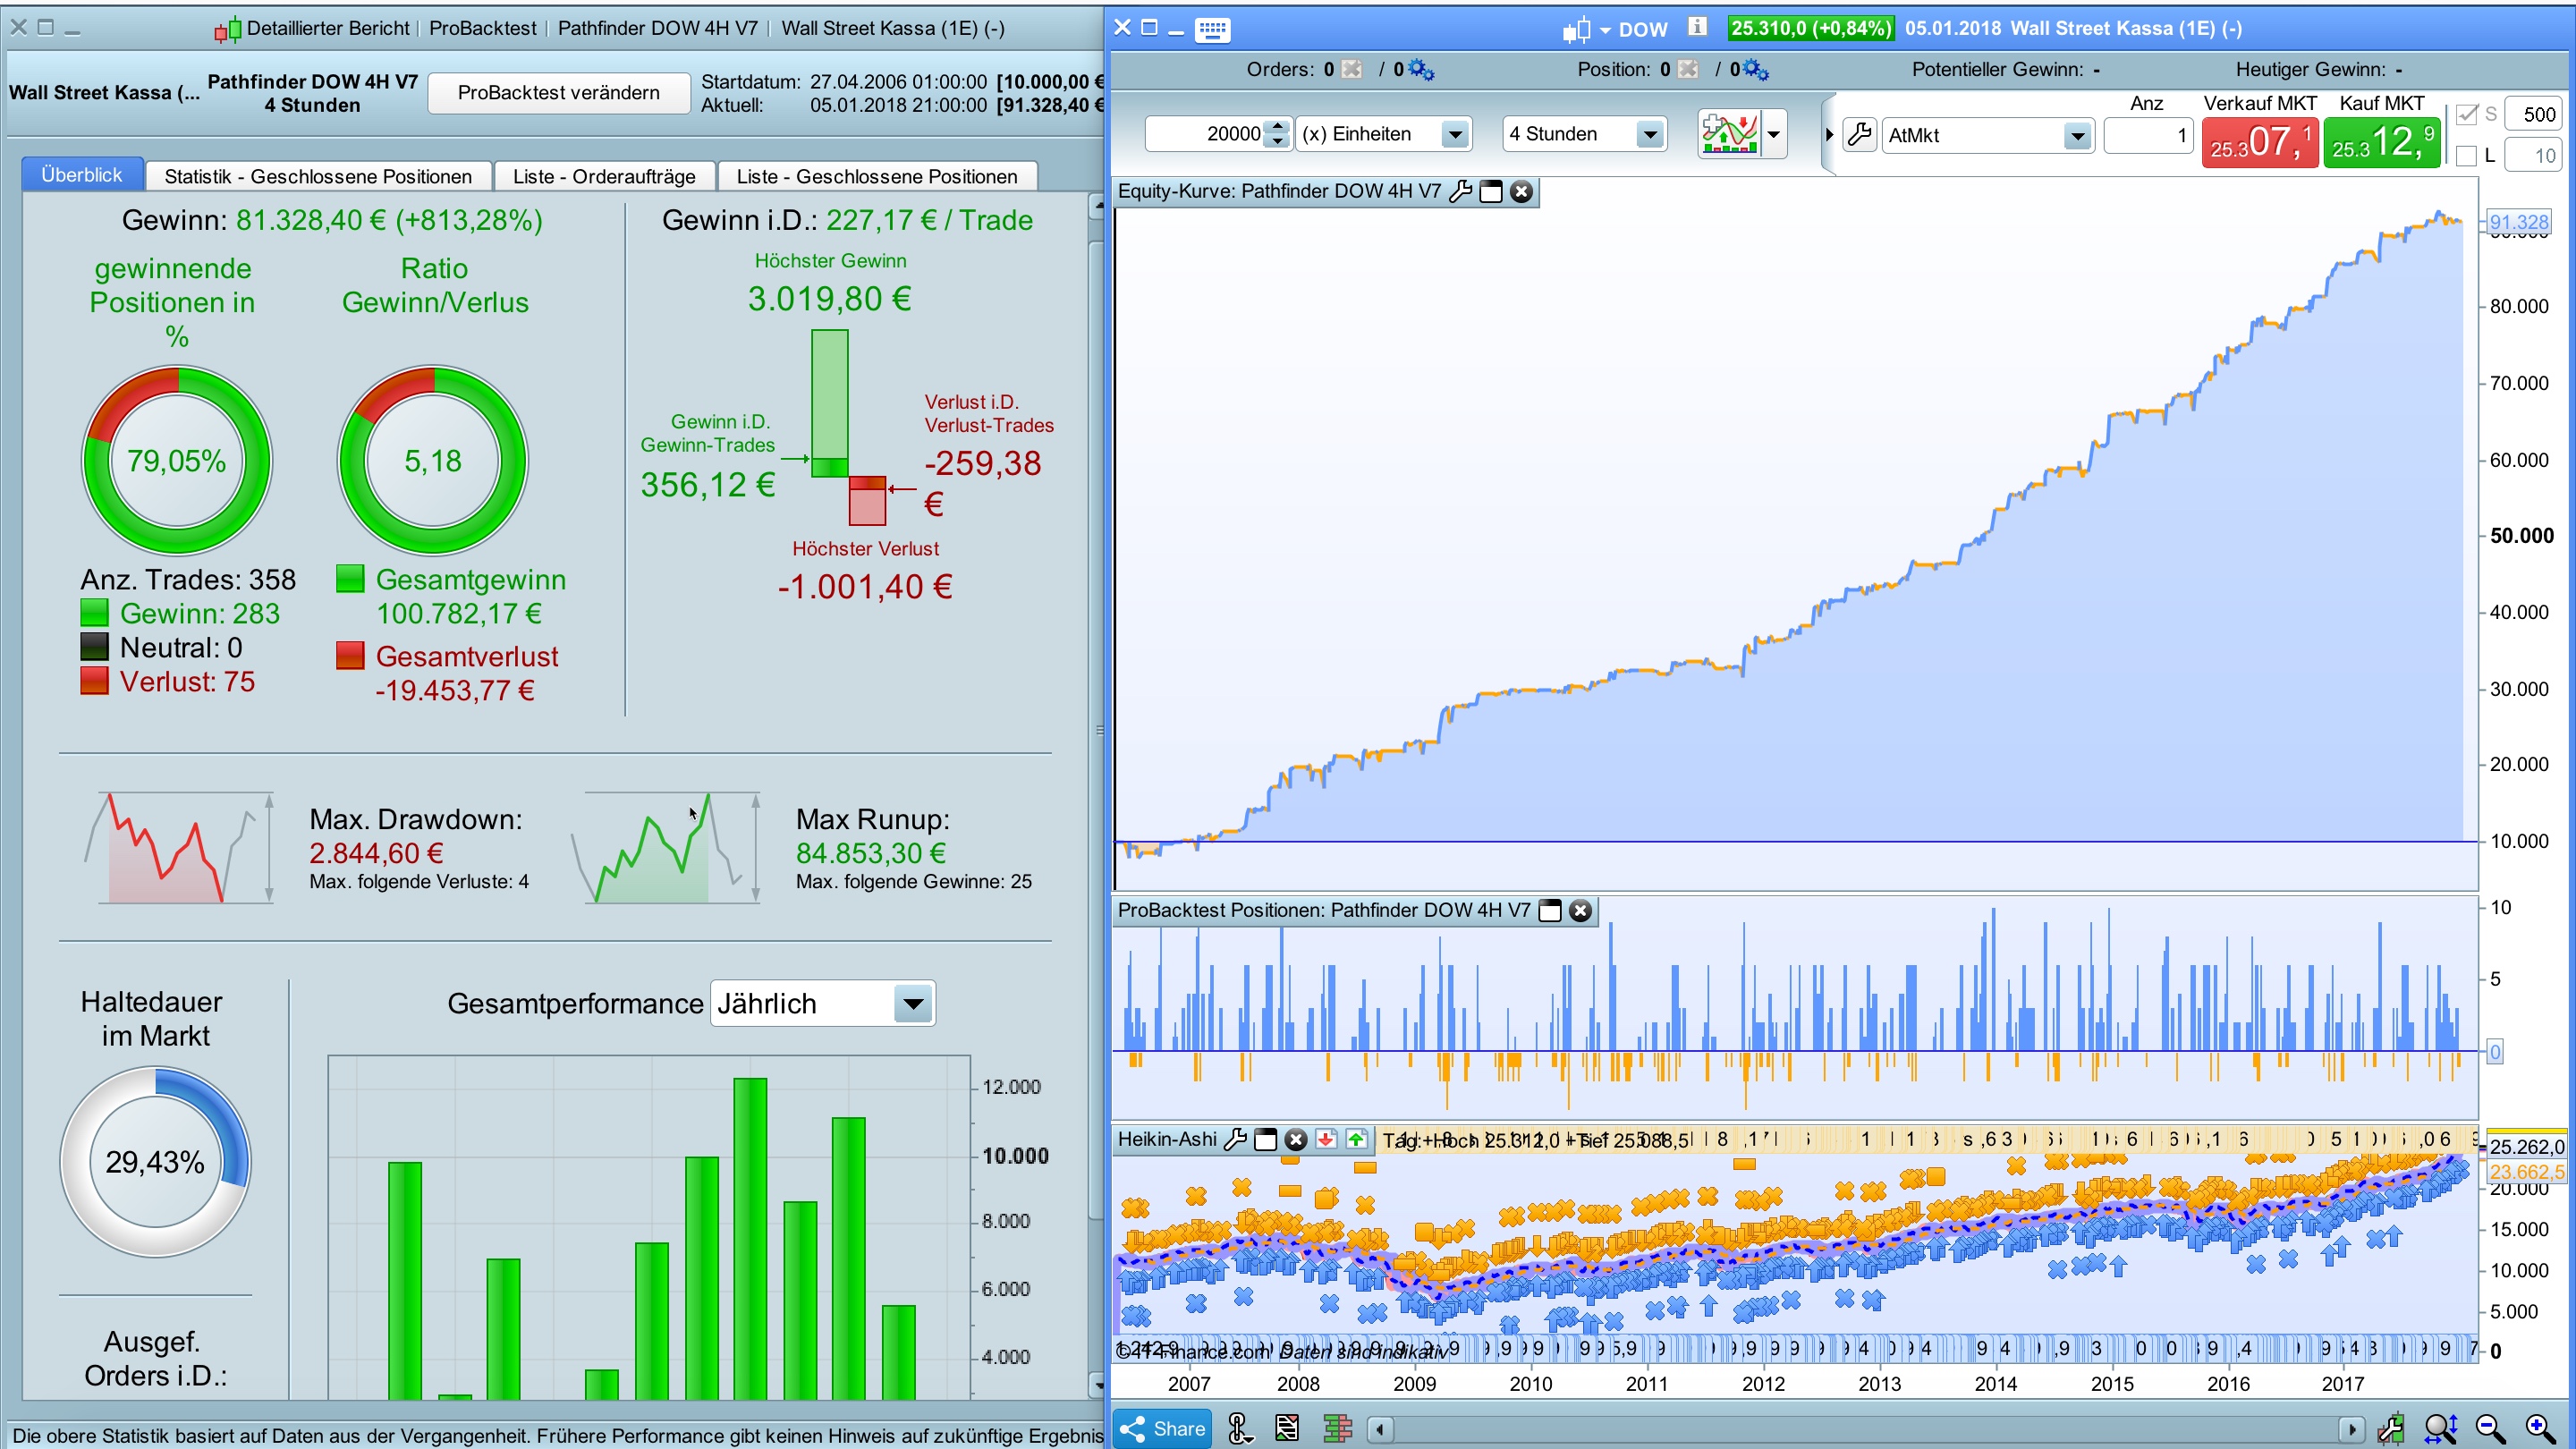
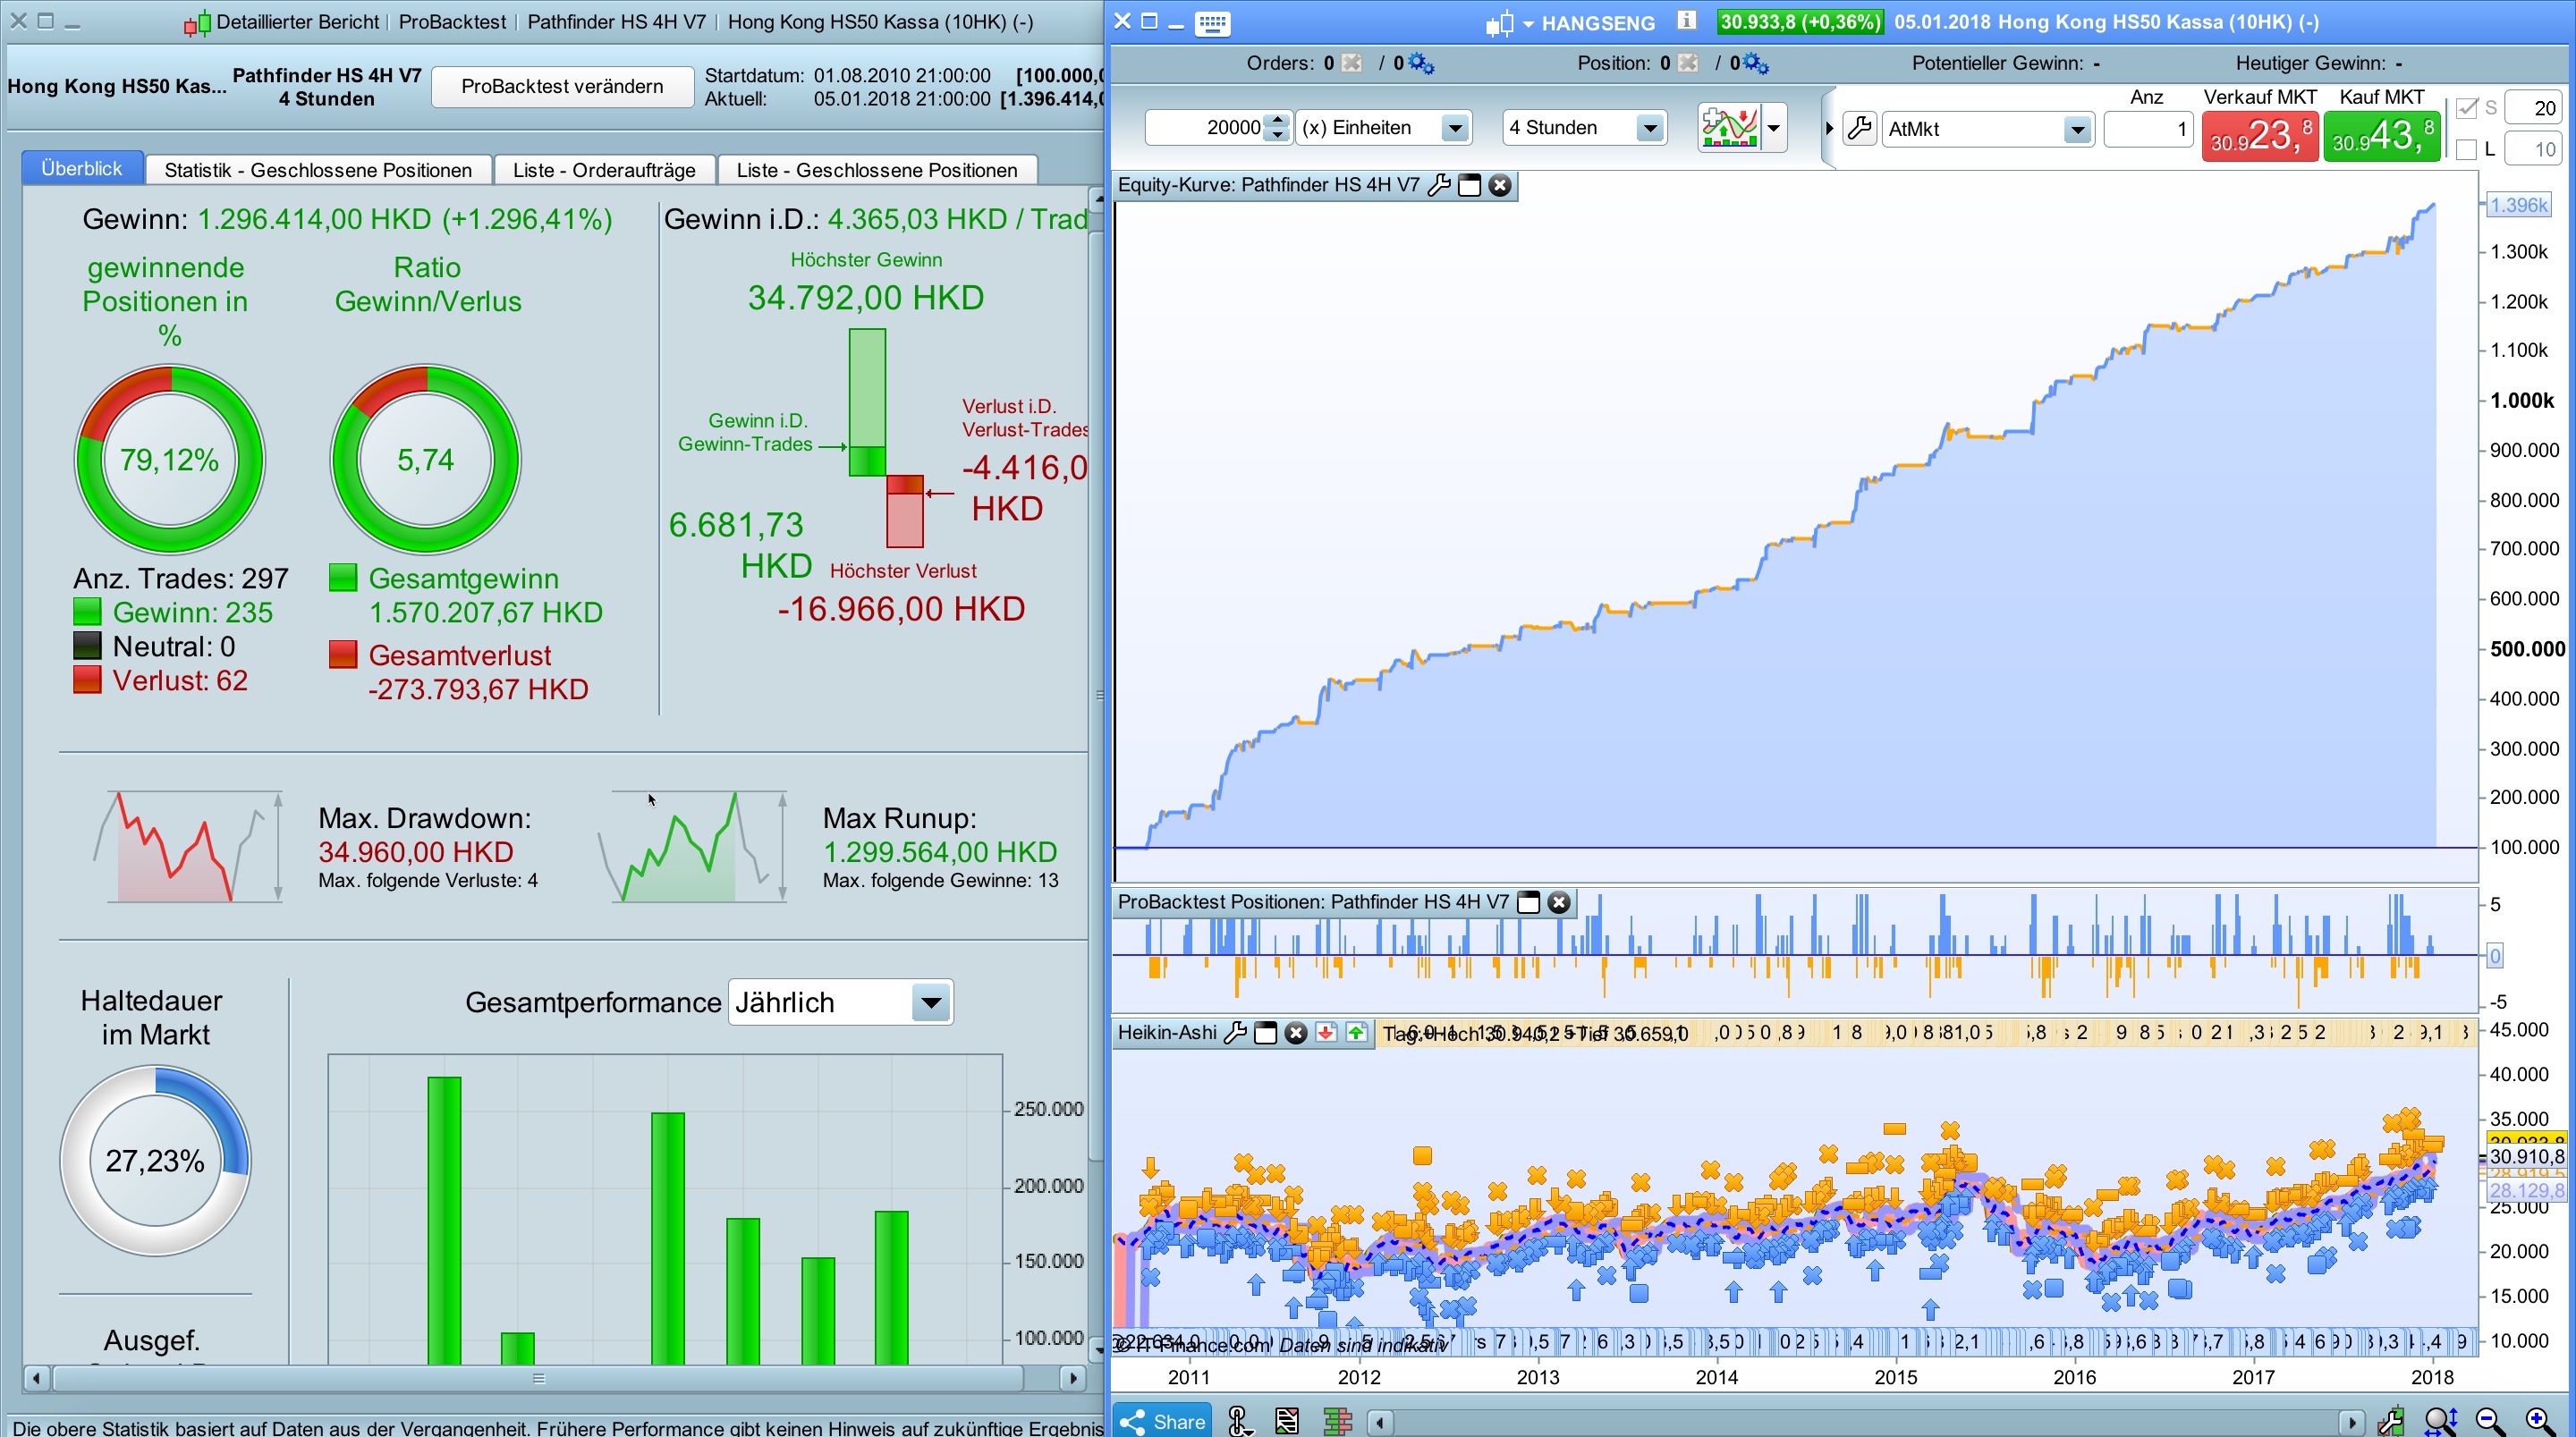
Hi guys,
in the following you will find the current Pathfinder 4H V7 for DAX, DOW and HS.
I checked and adjusted all parameters (tag *changed from) and added a small fix that Wisko has reported.
@pfeiler could you be so kind and update the dropbox and the first page – Thanks
Please find attached the DAX version.
the bullish markets have led to many Pathfinder robots being long, I hope that the trend will continue next week 🙂
DAX V8 has closed two trades with profit and made 198 points so far, enough for a pizza and a couple of beers. Demo and life with the same results.
Thank you very much Reiner for your very detailed answer to my question.
I am absolutely convinced that seasonality is something that should be in every traders toolbox (especially for cyclical commodities) and it is very interesting to see your take on it. Now I need to go away and write an indicator that analyses the past to give half monthly probability results for the year. Damn there goes another week of my life where I never see the sunlight. I wonder if there might be some merit and improved performance in having seasonal adjustments to one or to decimal places rather than the fixed 0,1,2,3 that you use.
Dax V8 seems to be doing well so far although my pizza and beer is still virtual. Sod’s law it will start on a losing streak if I put it live!
I’ve just posted two indicators to the library that might be of interest to all those on here who are interested in seasonality.
They are Seasonality Analysis and Seasonality Analysis Graph.
I hope they are useful. I hope to produce a version based on weeks or half months but there is a lot of repetition in the code required which bores the pants off me so my motivation has moved to other projects at the moment. I’m also working on converting it to a walk forward seasonality analysis indicator after reading this:
http://systemtradersuccess.com/seasonal-strategies-built-right-way/
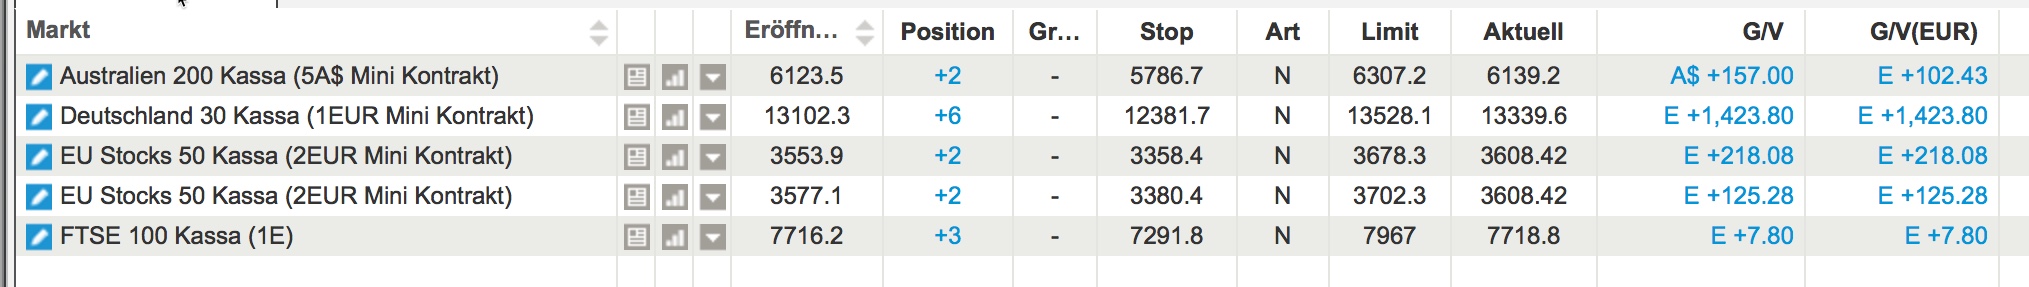
Hi guys and hi Reiner, first of all thank you for sharing your trading system and for a newbie like me is something genius. I have a difference today between demo and real, i started the TS the same day but i stopped the real one the 19 of december to stop the loss. Today i have this situation, it could be that the demo one knows the last loss so doesn’t open another trade today?