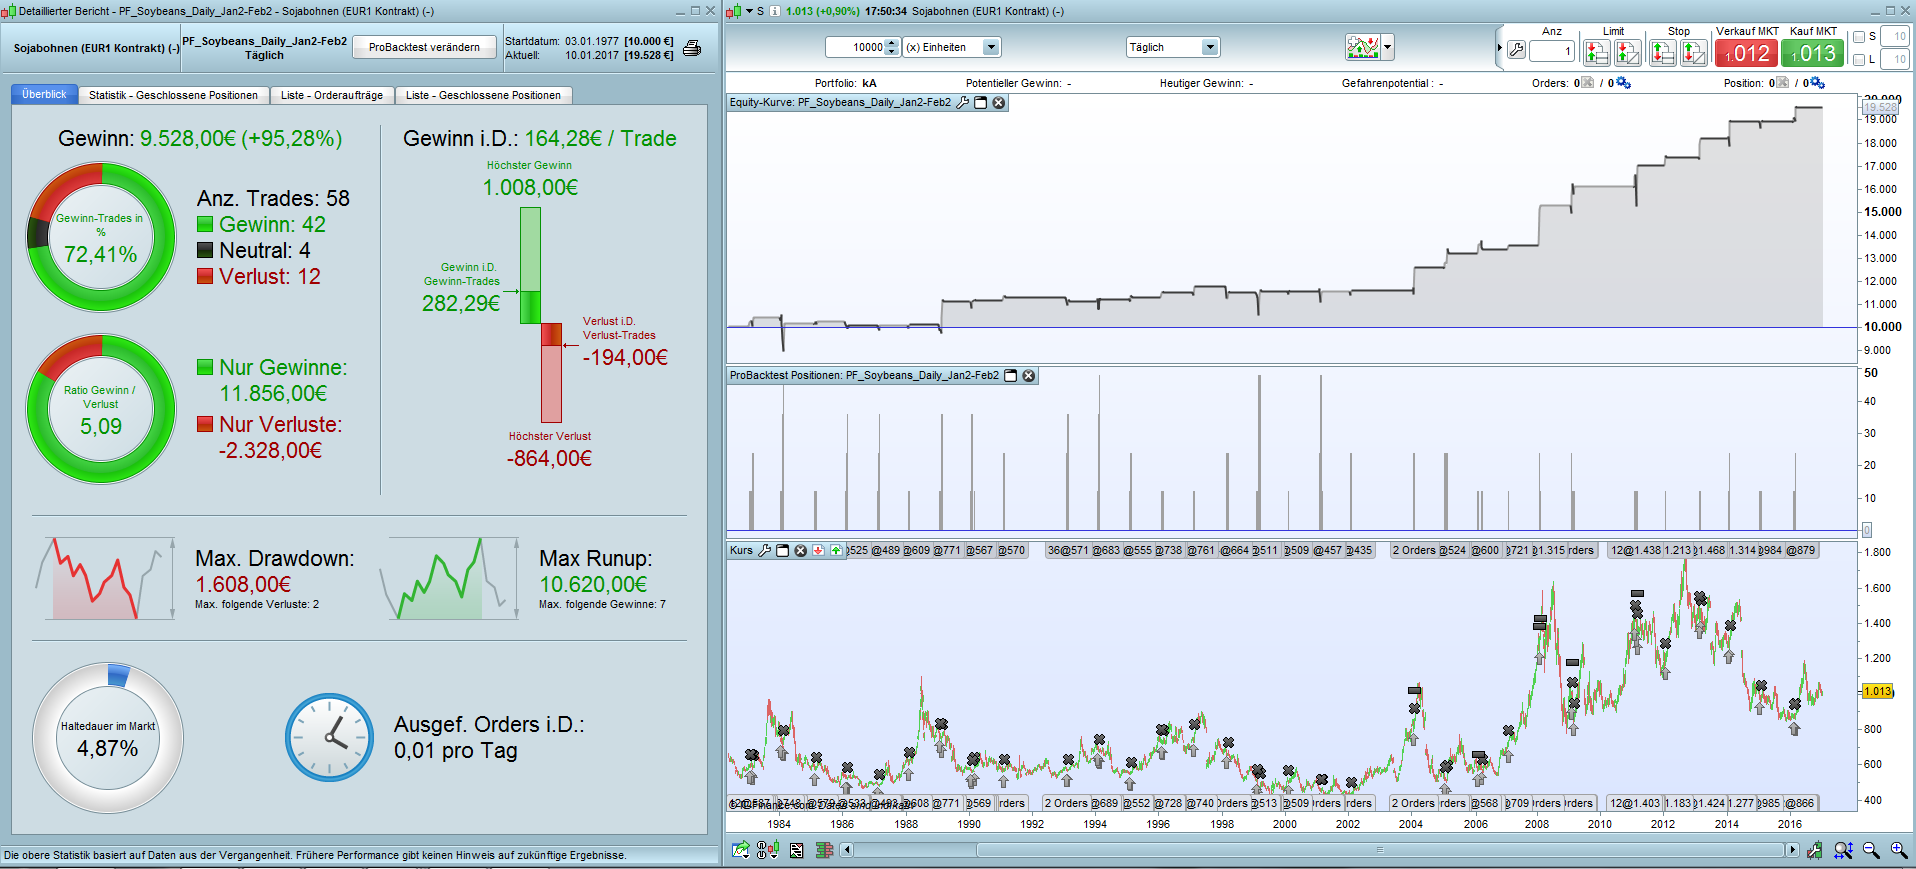
Soybeans (Jan2-Feb2) – pretty good performing since ca. 2000
 Mark
MarkParticipant
Senior
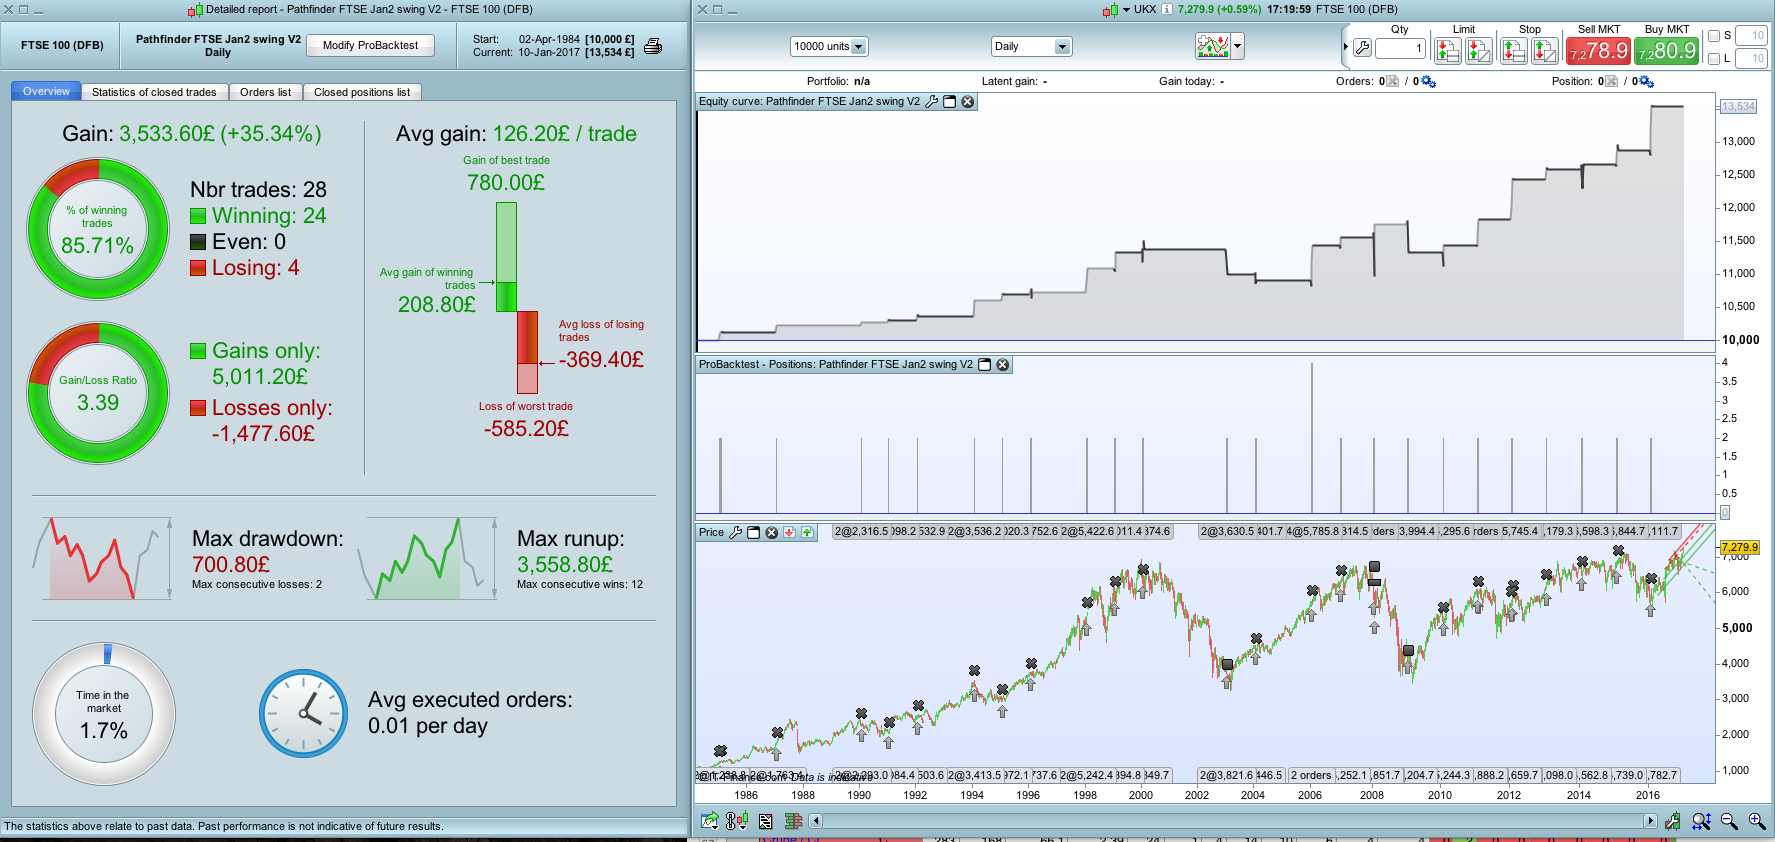
Im going to retry FTSE now and post it
MarkParticipant
Senior
Im still a little unsure how to use this information in live trading…
run all the algos live?
Run all in demo and enter live market manually?
pick 1 or 2 each month or all of them?
Its a bit of a mind masher
Jesús, great job as well. I wonder if you have seen that F1 also could be profitable. I added F2 and make some small changes and your you are right the last years were profitabel. In my opinion only a B rating.
MarkParticipant
Senior
Heres the FTSE Jan2 to check…
Mark, we’ll rate every setup and only the best come into the hall of fame. I know guys who use the robots for life trading with IG cfds and other use the algos in demo and buy ETFs.
Hi guys
Great work and a nice spirit.
I can also help if I understand the process correctly. Made an attempt on OMX for JAN2 and for JAN2-MAY1. Please give me some feedback if I’m on track:)
 Alco
AlcoParticipant
Senior
Guys, keep in mind we probably have a higher spread if we trade automatic cfd’s with indices. For example, I look at the dax and almost every position is opened at 01:00. So we have a 5 pip spread.
MarkParticipant
Senior
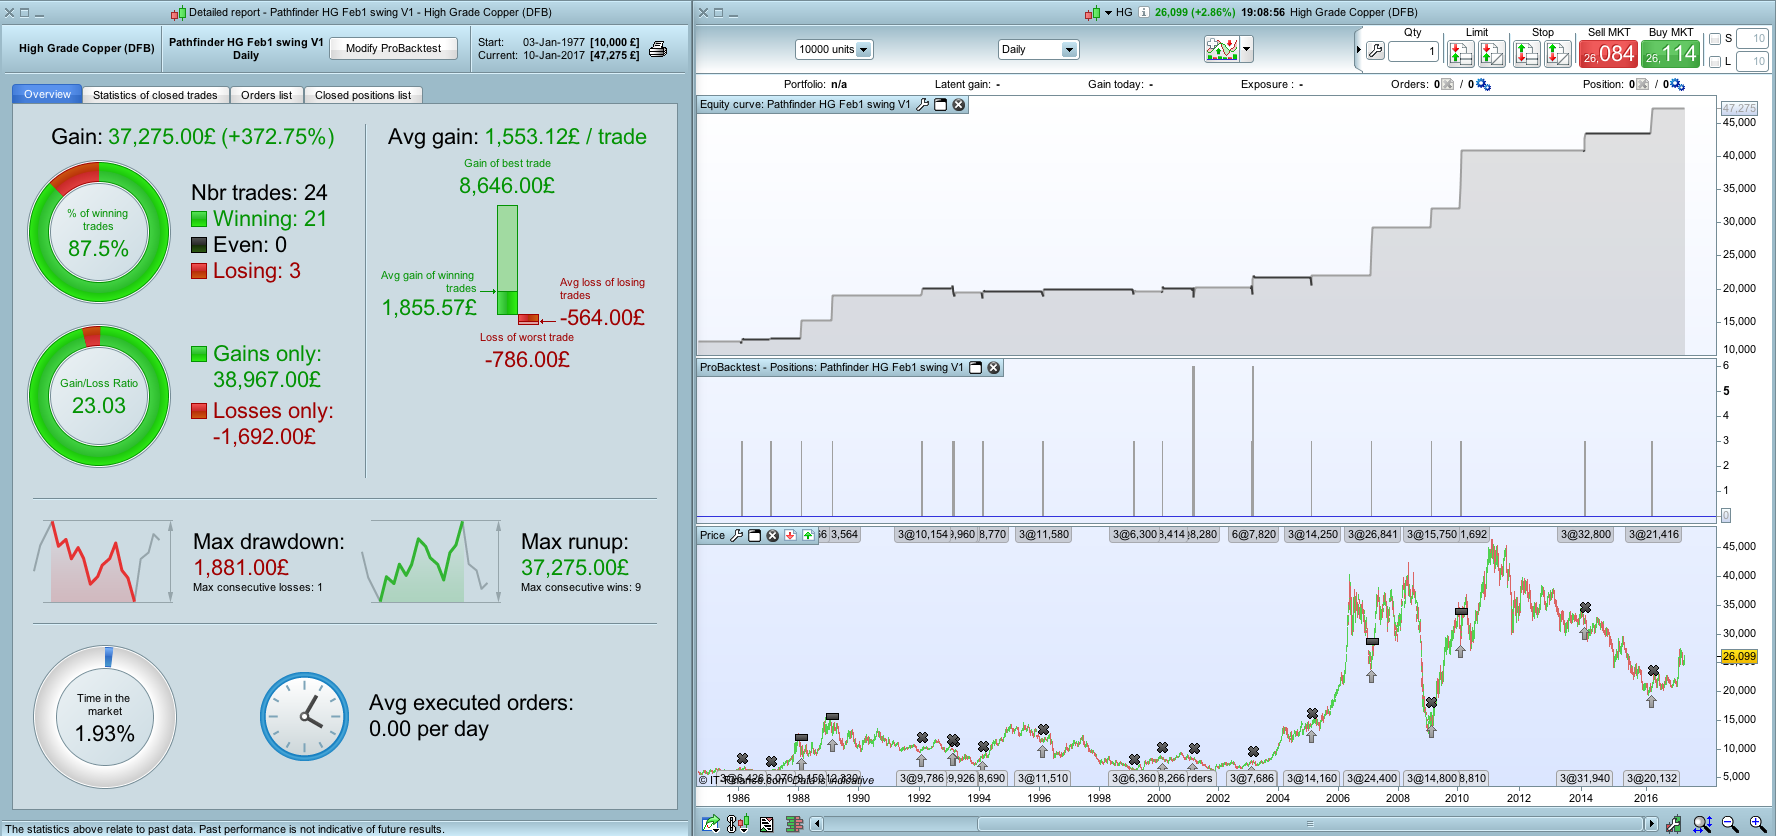
Heres the result for HG Copper for Feb1, looks good, can someone check?
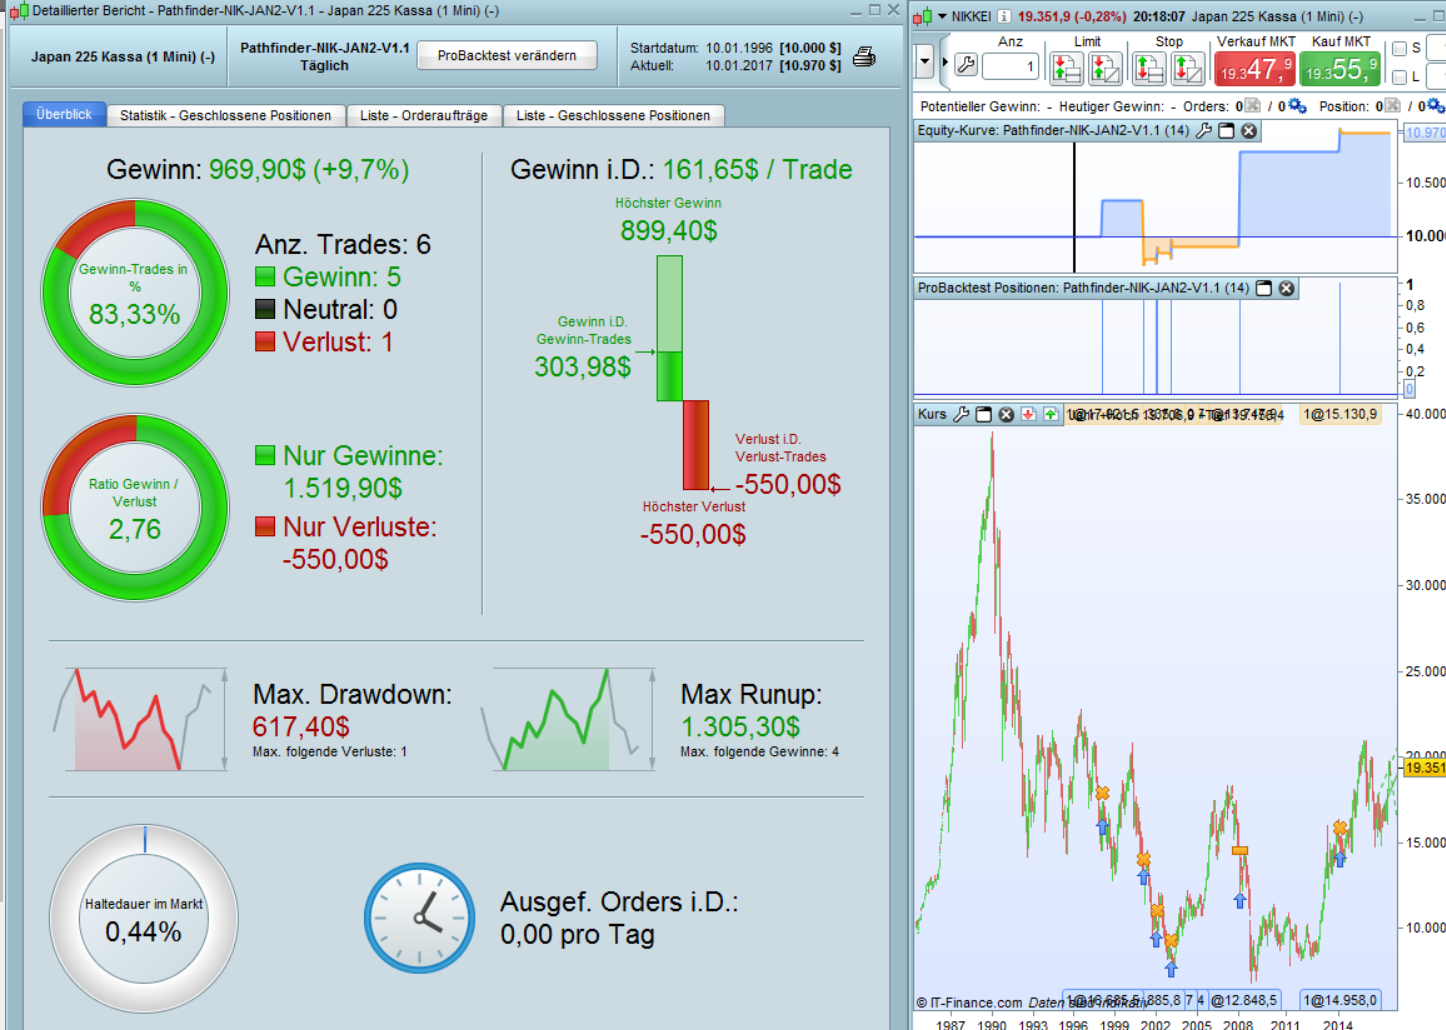
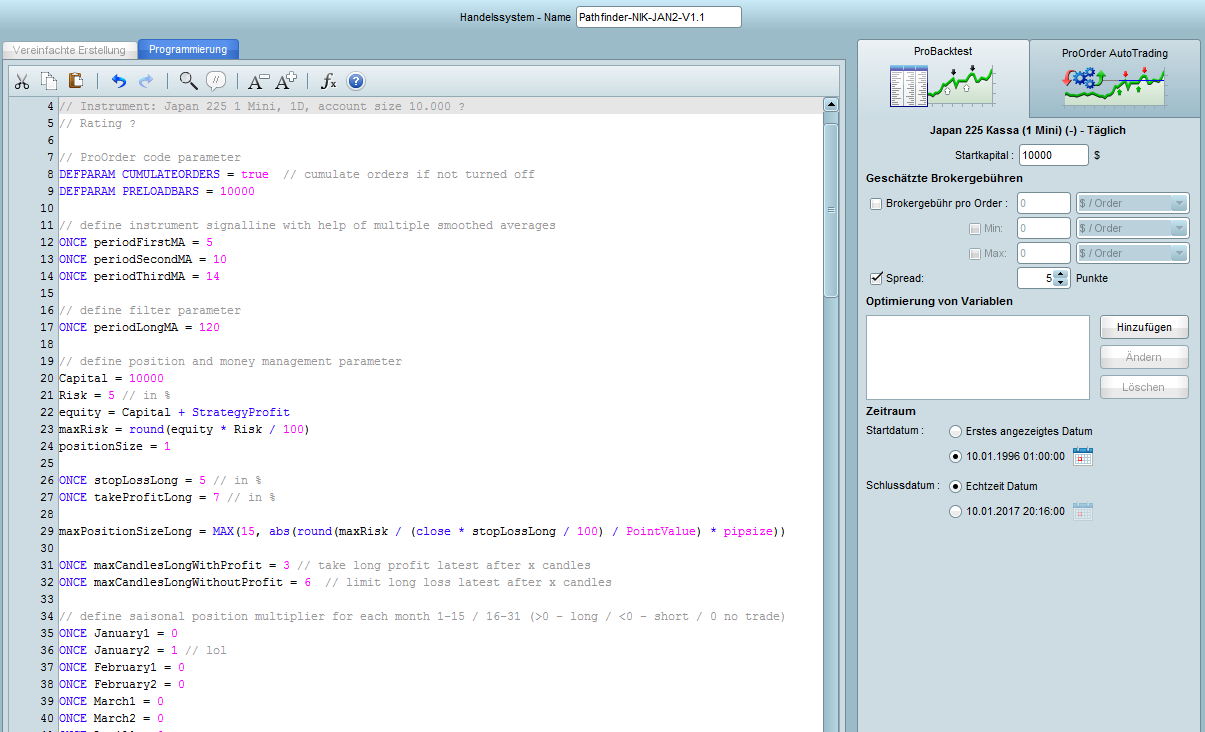
Nikkei / Japan 225 / Jan2
My contribution to the Hall of SHAME:
Only 9.5% profit, only 6 Trades and a drawdown that melts all profits.
It had a lucky hit in 1995, that made a huge profit, but from 1996 it did not generate any money.
Anyhow Nikkei should be a nice instrument to trade, because it is changing a lot. Maybe in a later period.
Don’t trade it in JAN2, we will loose money with it.
So next step is match better.
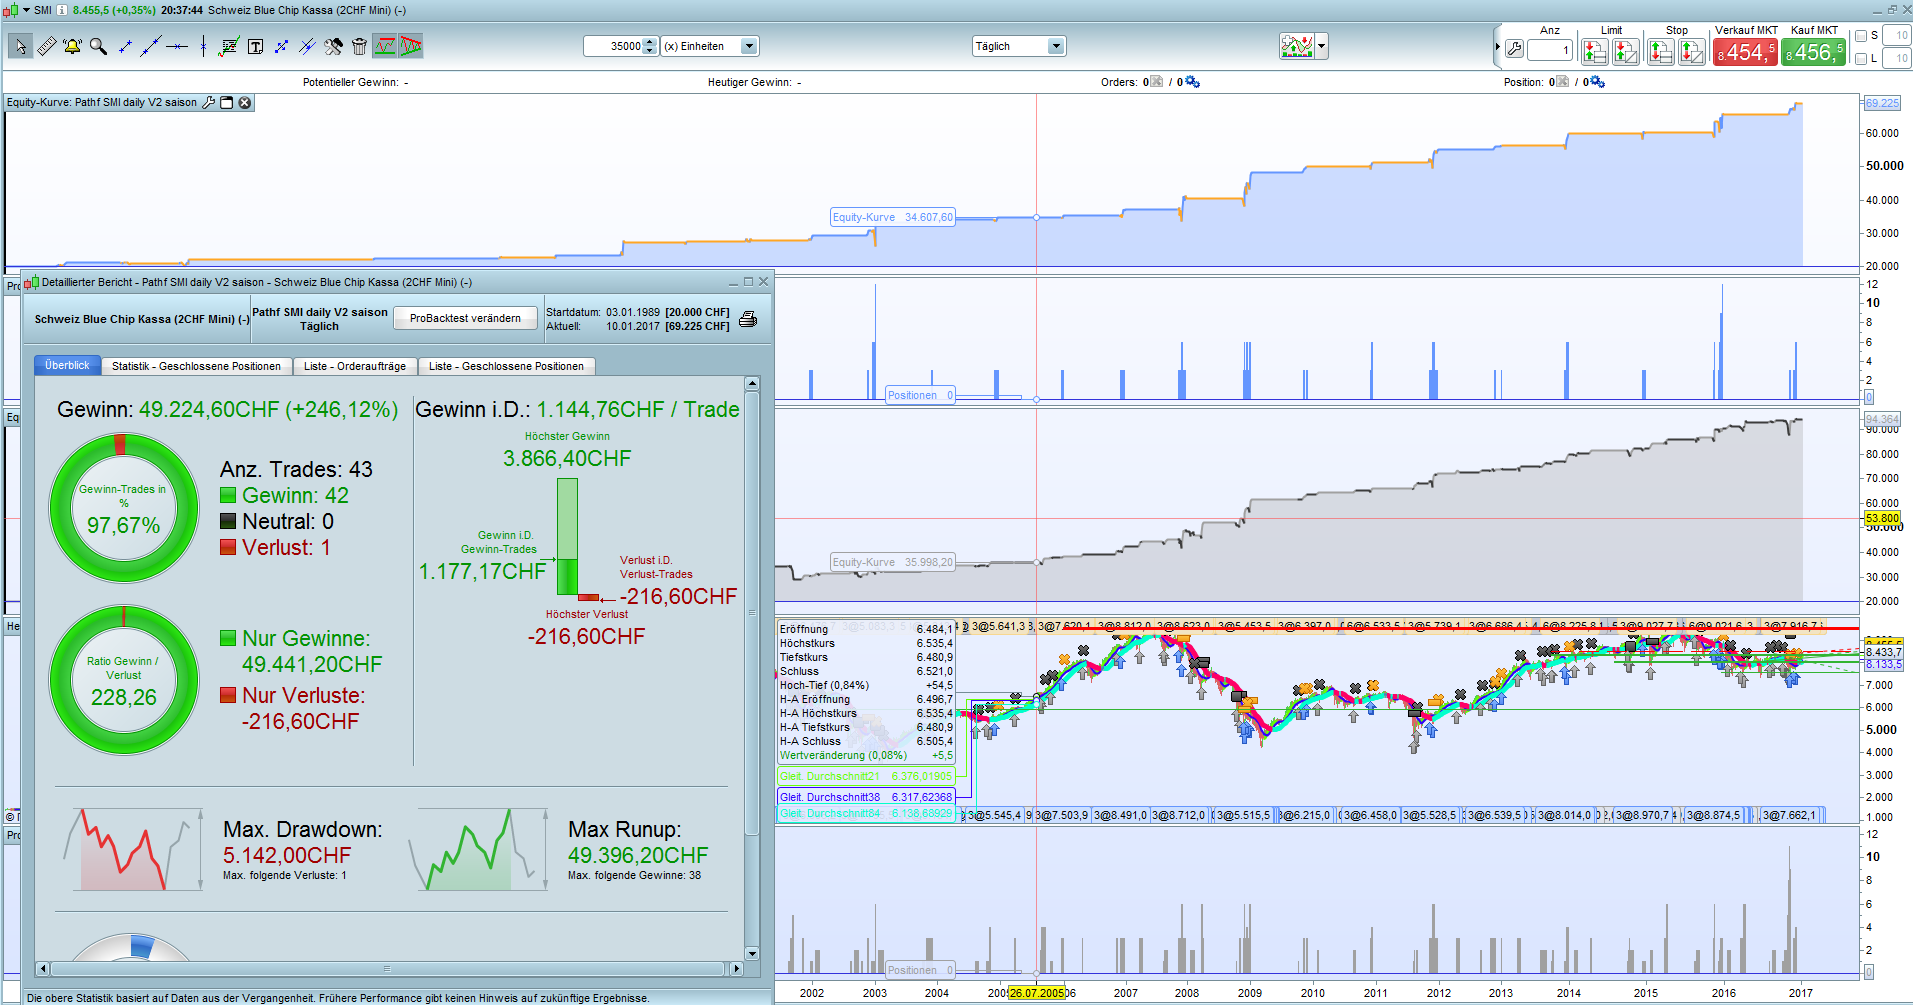
SMI just from Nov 1 – Dez 2.
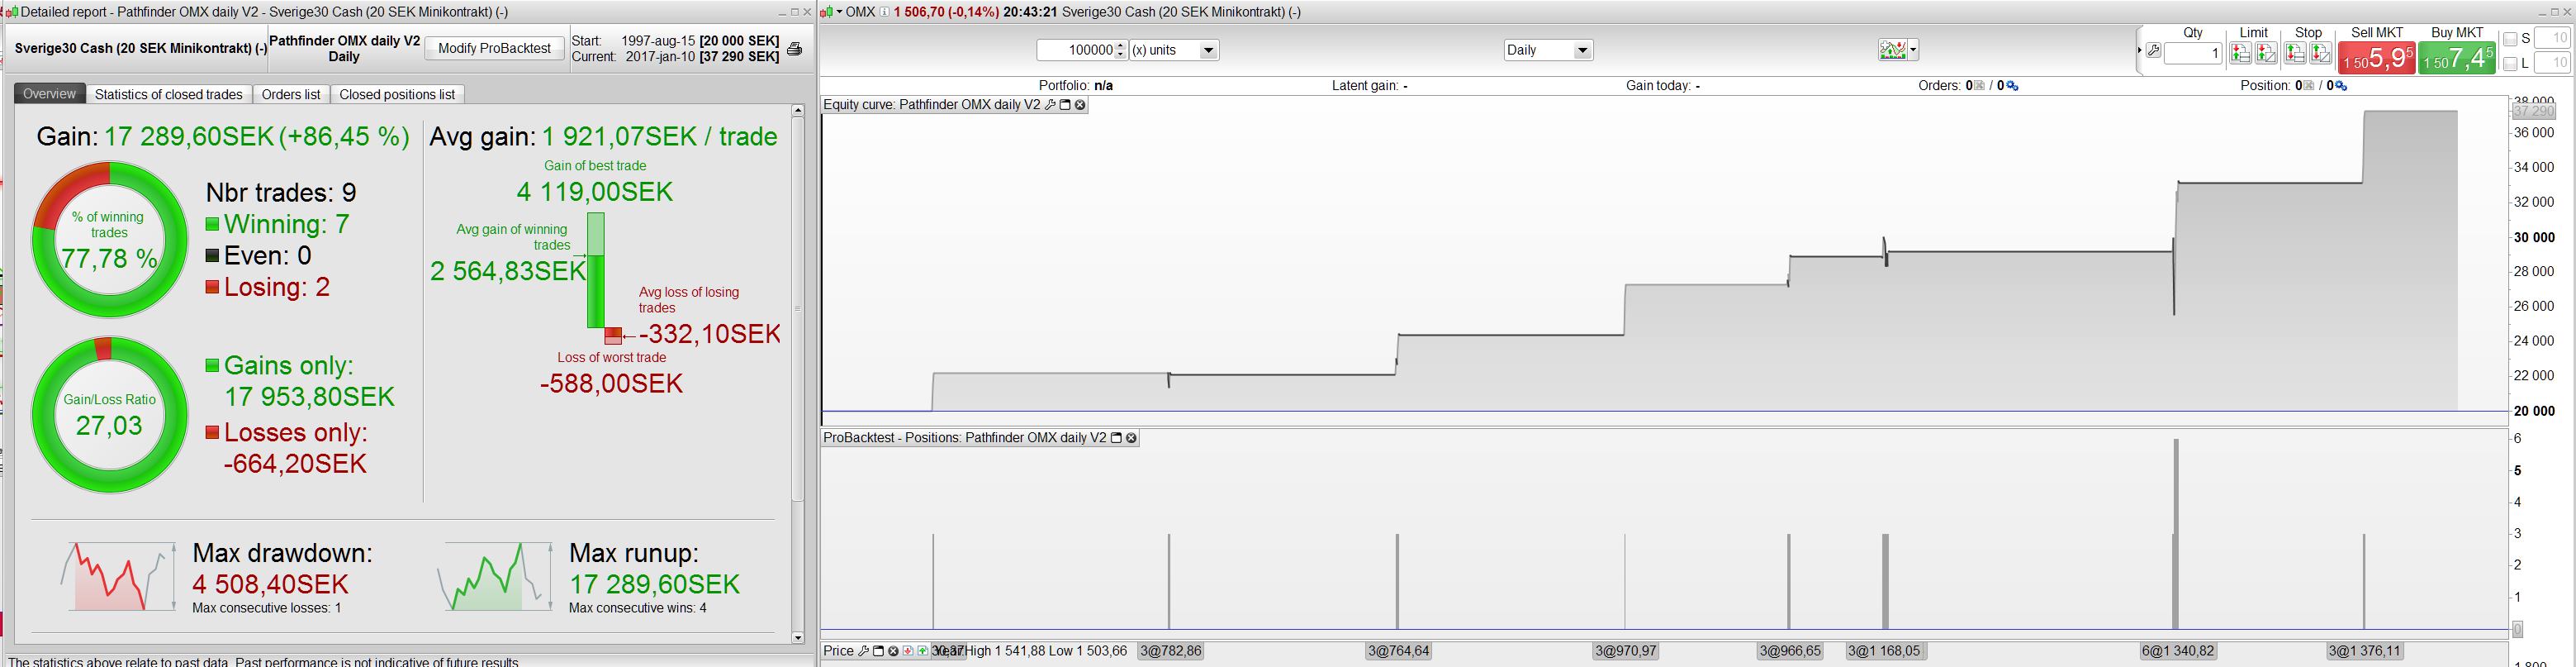
Pathfinder-OMX-JAN2-Swing based on template V2.
I decided to optimize for every period so there would be a baseline for comparison. I know that the heatmap displays from Jan2-May1- for now it is Jan2. dd%i aprox 26% but numbers of trades are only 9 since 1997 which means that there is not a trade signal every year. This makes it questionable if there is sufficient data to make a rating or even fit for optimizing within the pathfinder system . But based on the numbers I would say it’s B, and because of the small numbers of trades I find it to be rated a C- not tradeable in jan2.
The account is 20000 because it in SEK and there is a 20 sek/point. that’s like 2 Euro/point- so I changed it for comparison to euros.
Edit: it should actually be a 95000 SEK account- I see this now- This make the profit very limmit. Still not tradeable
Cheers Kasper
@ Reiner Silver is still running
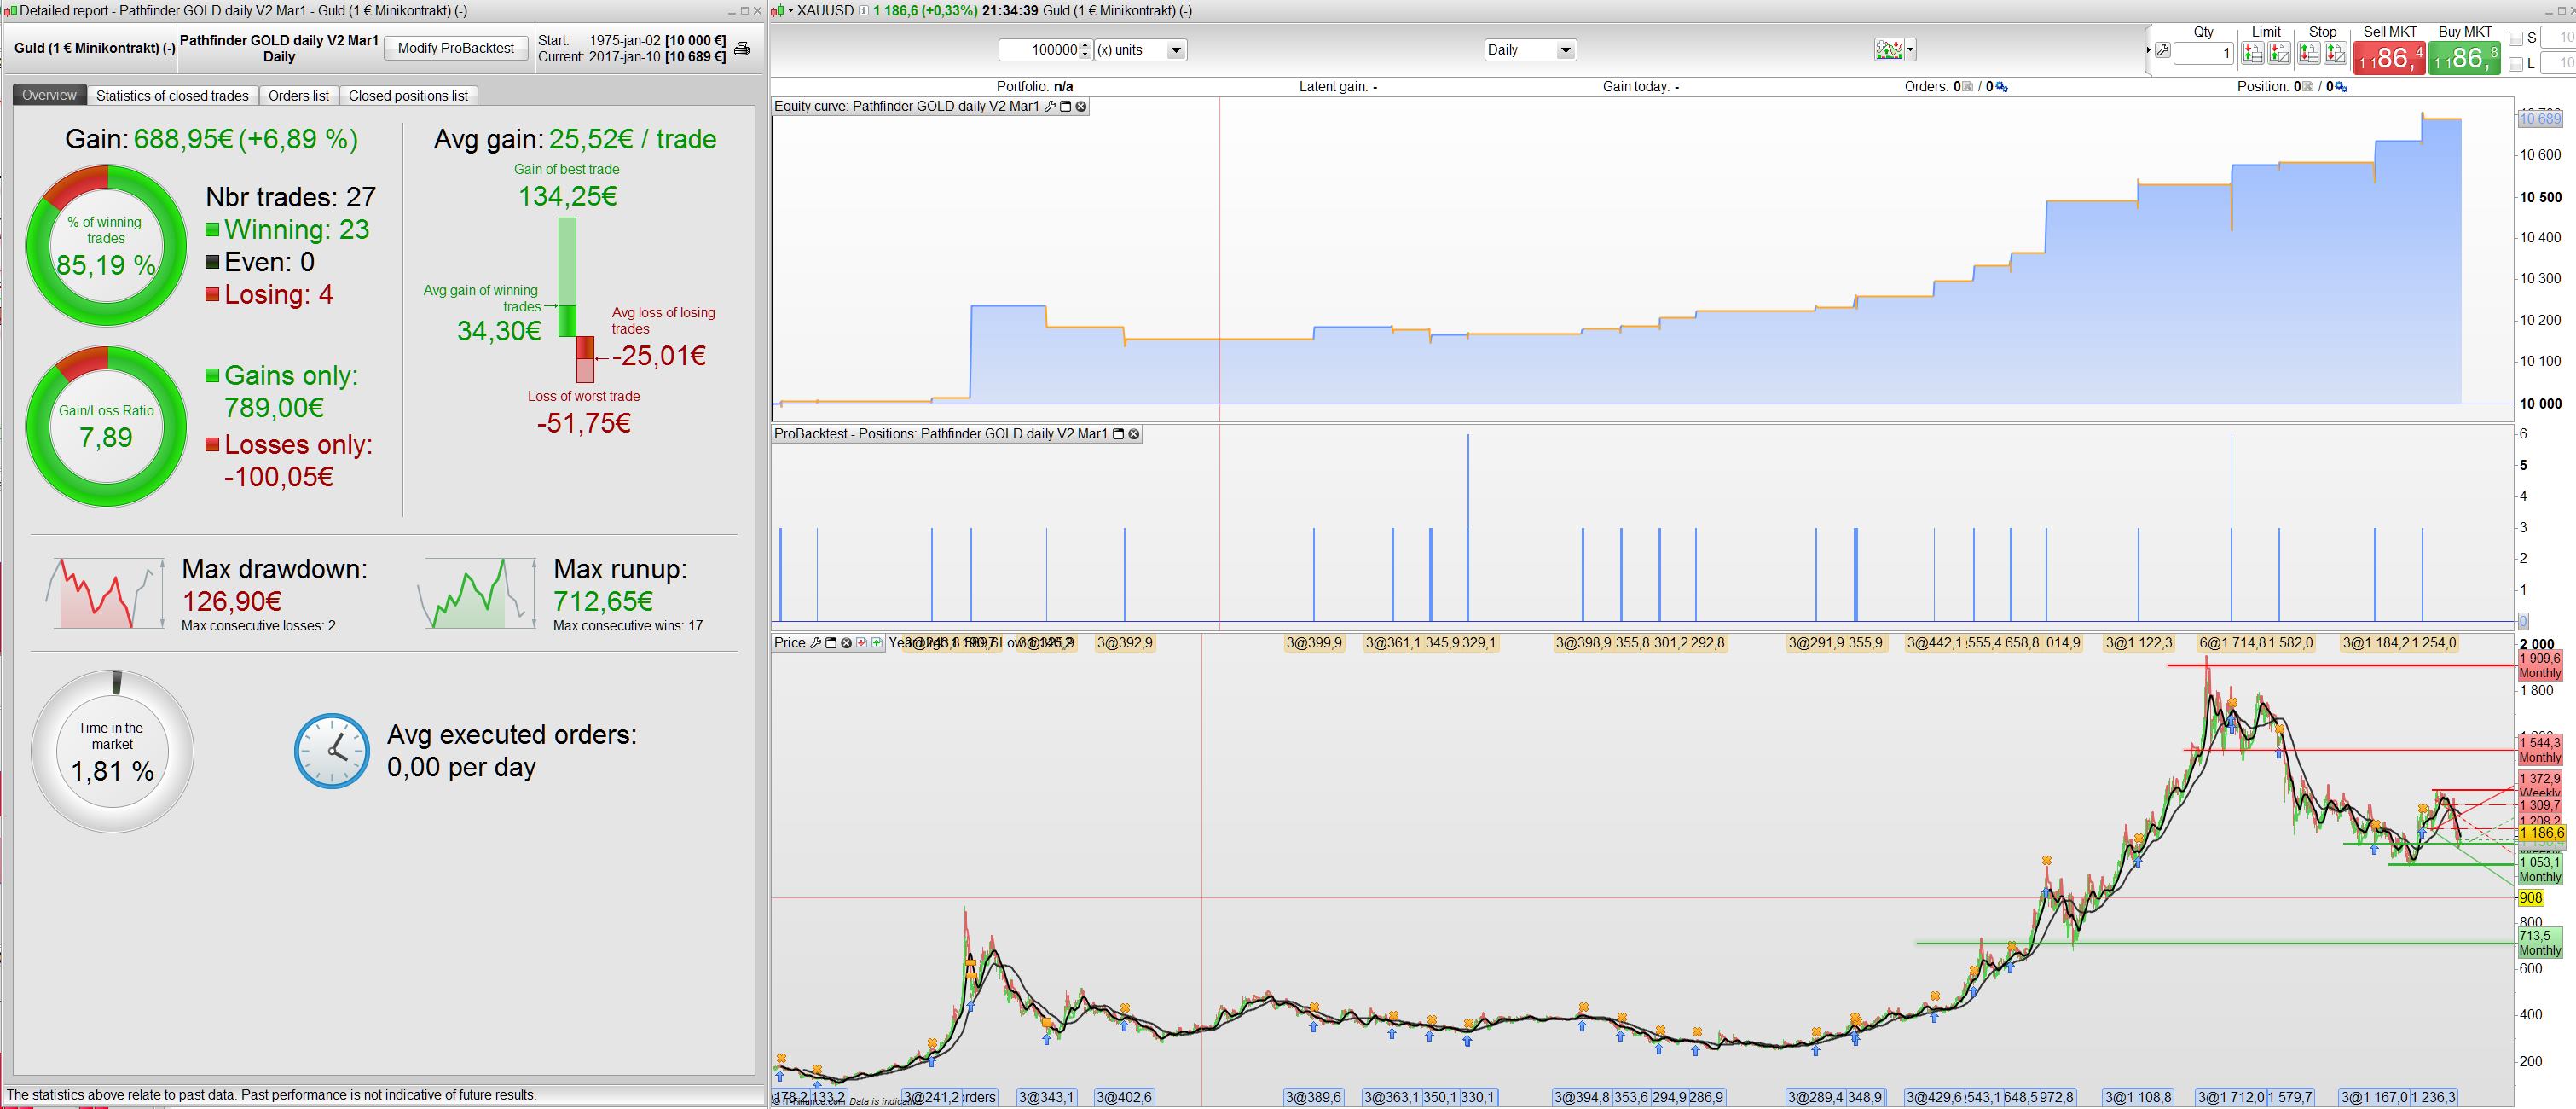
Pathfinder-GOLD-mar1-Swing based on template V2.
Gold swing trade for jan2 is not profitable. Next green heat map is Mar 1, but profit is very limited, however it has some nice statistics dd18% and all other qualifies for pathfinder system. However I trade 3 positions in comparison to heat map where it’s optimized for 1. I could not find any reason to use only 1 position in season Mar 1.
Because of the poor gain I would rate it a C.
Cheers Kasper
Hi guys,
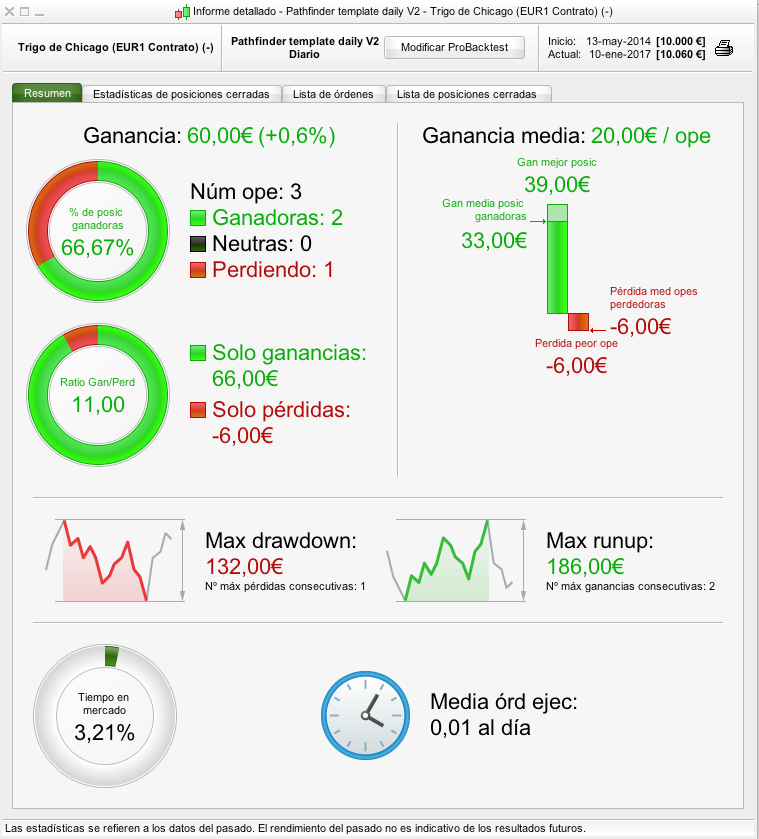
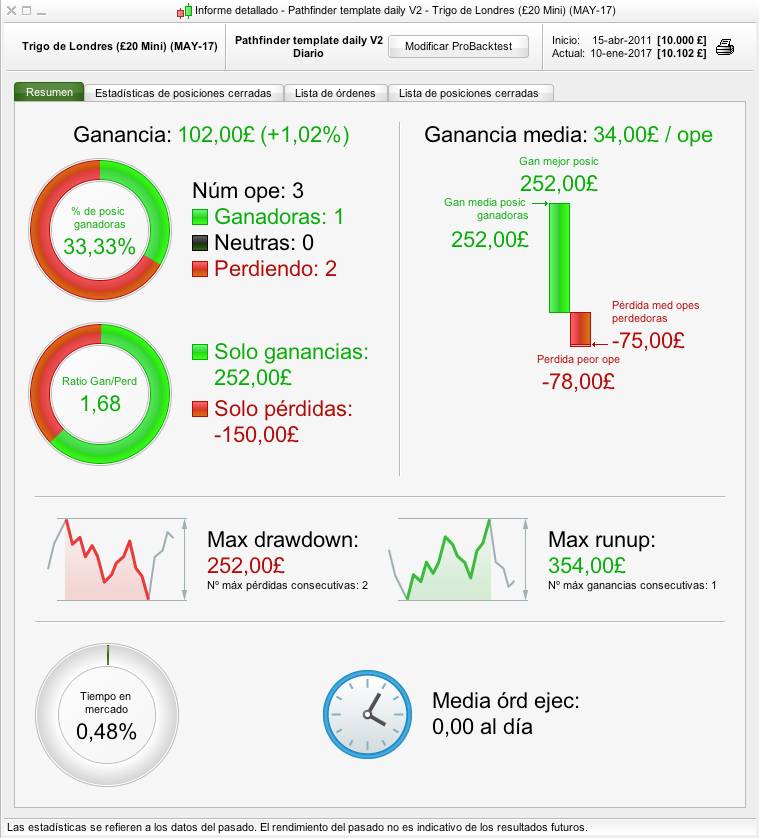
The Pathfinder Daily V2 in wheat (Chicago and Paris) is not profitable in J2 considering the few historical data that load PRT, since May 13, 2014 there are only three trades.
Reiner, on your roadmap says that the backtest in wheat starts in 2011, but to me, extending the historical maximum, I only load from May 2014. In London wheat if there is data from 2011, but the mini contract are 20 pounds and, moreover, only performs three trades.
In both cases the profit is very low, so I consider that it is not profitable the wheat in J2.
Regards
Jesus