Dear fellow traders,
Since i have zero skills in programming, i would be really pleased if someone would be kind enough to adapt an indicator found on tradingview into our beloved prorealtime language (see the code below).
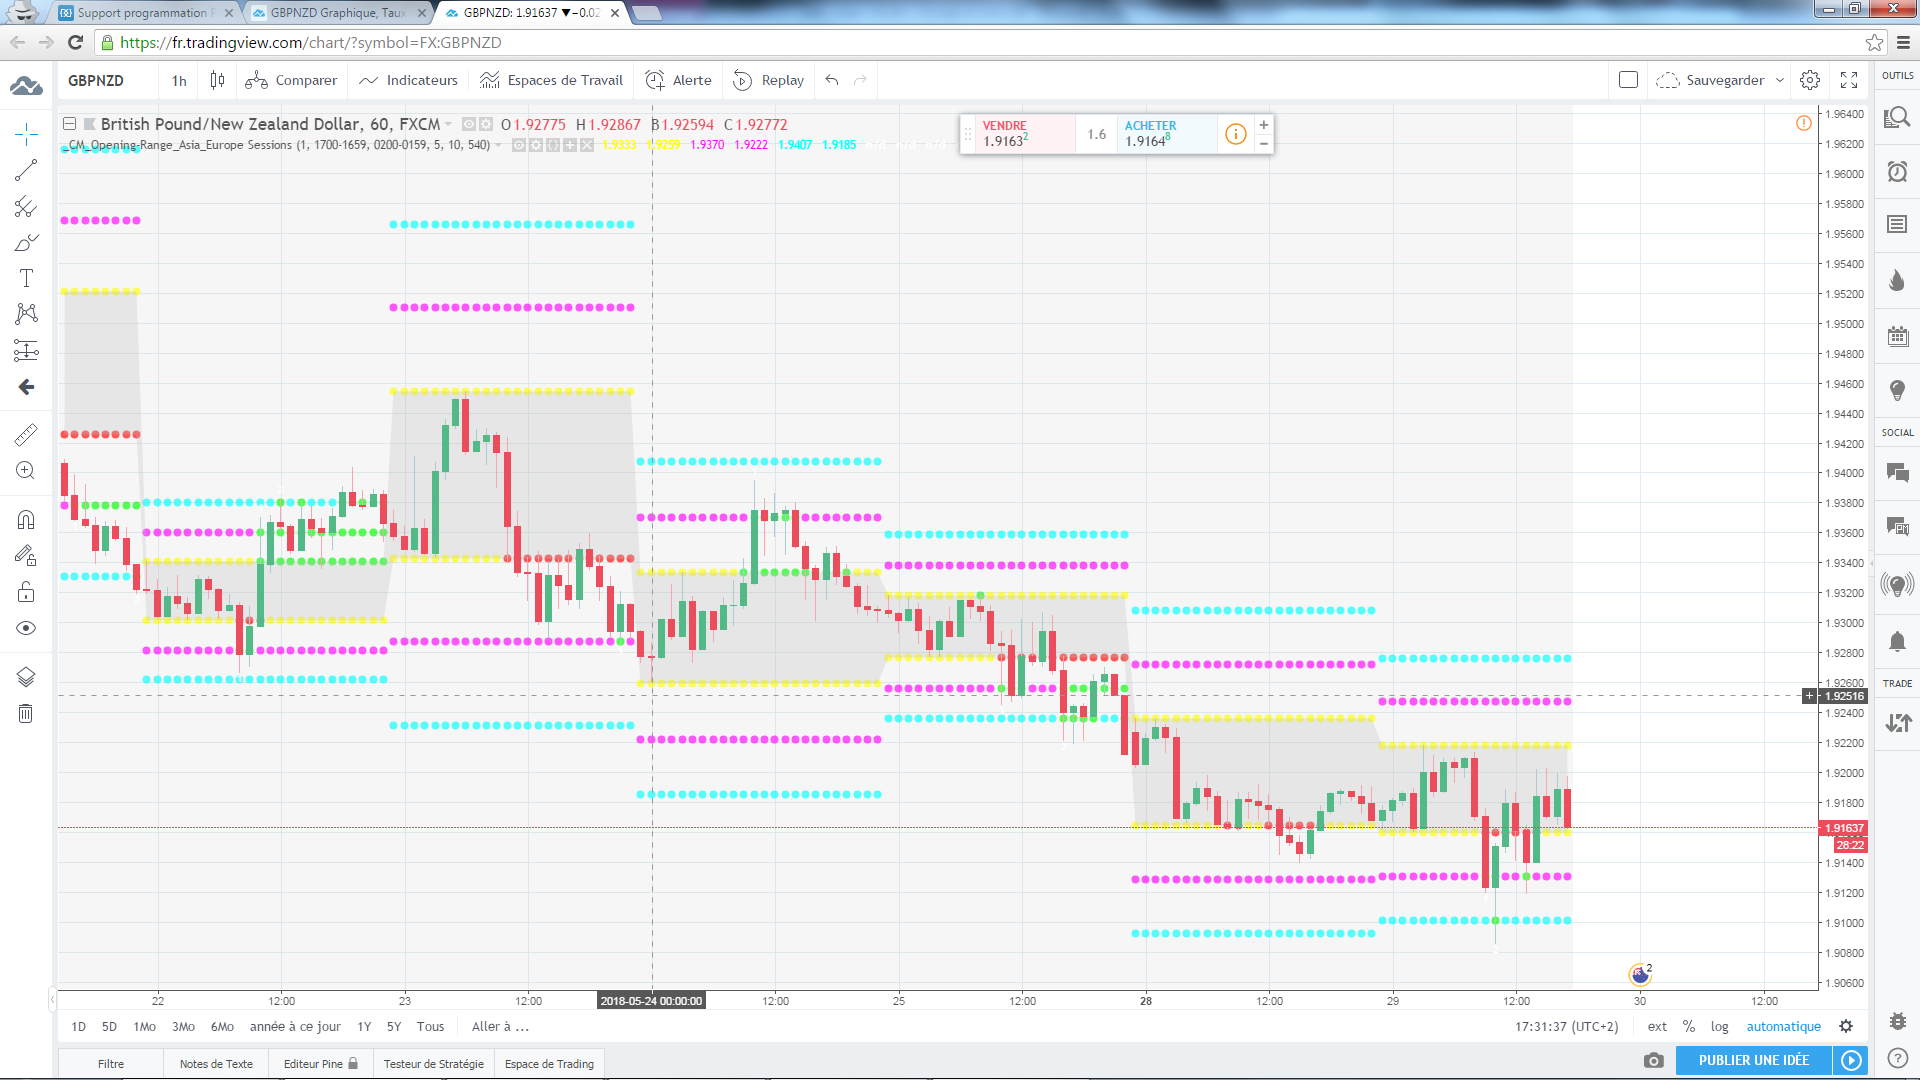
Basically, as I understand it, this indicator sets up a range for the entire trading day based on the lowest and highest point reached between midnight until 7 am, just before the London session opening (hours should be able to be modified to suit personal taste), on a 1H timeframe.
More over, it automatically sets 2 profit targets above and below the range: 1 based on half of the range size and 1 equals to the total size of the range.
(See attached picture)
This indicator proves to be very helpful in trading some strategies such as the London open breakout.
Cheers/merci in advance!
Jules
Source code:
//Created by ChrisMoody on 9/03/2014
//Requested by rayhug1 to use ENTIRE Asia Range From 5pm Est to 2am Est To Plot Opening Range of Entire 9 hour session…uses 540 minutes (5pm to 2am Est) to calculate the Range…then breakouts trigger after 2am
//Ability to change Start and End Times to use any entire session. Defaults to 540 minutes (9 hours) but Opening Range Calculation can be changed to 1 hour etc. in inputs tab
study(“_CM_Opening-Range_Asia_Europe Sessions”, overlay=true)
sessNum = input(1, minval=0, maxval=2, title=”Session to use (0 = 24 Hours, Other Numbers Listed Below)”)
desc = input(false, title=”Below—Line Plot Start Times and End Times—1 = Asian Session, 2 = Europe Session”)
asian_session = input(‘1700-1659’, type=session, title=”1 – Asia Session”)
europe_session = input(‘0200-0159’, type=session, title=”2 – Europe Session”)
//us_session = input(‘0800-0759’, type=session, title=”3 – U.S. Session”)
pt1 = input(5, minval=1, maxval=15, title=”Profit Target 1 – Multiple of Opening Range *.1, 5 = .5, 7 = .7, 10 = 1, 15 = 1.5 etc.”)
pt2 = input(10, minval=1, maxval=30, title=”Profit Target 2 – Multiple of Opening Range *.1, 10 = 1, 15 = 1.5, 18 = 1.8, etc.”)
res = input(‘540’, type=resolution, title=”Length Of Opening Range-Defaults to 540 Minutes (9 Hours) Select Drop Down Box To Change?”)
snp = input(true, title=”Plot 1 and 2 When 1st and 2nd Profit Target are Achieved?”)
//Session Selection Rules
sessToUse = sessNum == 1 ? asian_session : sessNum == 2 ? europe_session : ‘0000-0000’
//Session Rules
bartimeSess = (sessNum == 0 ? time(‘D’) : time(‘D’, sessToUse))
fr2to17 = (sessNum == 0 ? time(period) : time(period, sessToUse))
newbarSess = bartimeSess != bartimeSess[1]
high_range = valuewhen(newbarSess,high,0)
low_range = valuewhen(newbarSess,low,0)
adopt(r, s) => security(tickerid, r, s)
//Formula For Opening Range
highRes = adopt(res, high_range)
lowRes = adopt(res, low_range)
range = highRes – lowRes
//Highlighting Line Rules For Opening Range
highColor = high > highRes ? lime : yellow
lowColor = low < lowRes ? red : yellow
//Plot Statements For Opening Range Lines
openRangeHigh = plot(fr2to17 > 0 ? highRes : na, color=highColor, style=circles, linewidth=4)
openRangeLow = plot(fr2to17 > 0 ? lowRes : na, color=lowColor, style=circles, linewidth=4)
bgcolor(fr2to17 > 0 ? silver : na, transp=85)
fill(openRangeHigh, openRangeLow, color=silver, transp=70, title=”Opening Range Fill”)
//Formula For Profit Target 1
pft1 = pt1*.1
highRes2 = highRes+range*pft1
lowRes2 = lowRes-range*pft1
//Highlighting Line rules for Profit Target 1
highColor2 = high > highRes2 ? lime : fuchsia
lowColor2 = low < lowRes2 ? lime : fuchsia
//Plots For Profit Target 1
p1=plot(fr2to17 > 0 ? highRes2 : na, color=highColor2, style=circles, linewidth=4)
p2=plot(fr2to17 > 0 ? lowRes2 : na, color=lowColor2, style=circles, linewidth=4)
//Formula For Profit Target 2
pft2 = pt2*.1
highRes3 = highRes+range*pft2
lowRes3 = lowRes-range*pft2
//Highlighting Line rules for Profit Target 2
highColor3 = high > highRes3 ? lime : aqua
lowColor3 = low < lowRes3 ? lime : aqua
//Plots For Profit Targe 2
plot(fr2to17 > 0 ? highRes3 : na, color=highColor3, style=circles, linewidth=4)
plot(fr2to17 > 0 ? lowRes3 : na, color=lowColor3, style=circles, linewidth=4)
//Rules for when to plot Numbers 1 or 2 When Profit Target 1 or 2 is Reached
pt1UHit = (high >= highRes2 and high[1] < highRes2 and high[2] < highRes2 and high[3] < highRes2 and high[4] < highRes2 and high[5] < highRes2) and fr2to17 > 0
pt1LHit = (low <= lowRes2 and low[1] > lowRes2 and low[2] > lowRes2 and low[3] > lowRes2 and low[4] > lowRes2 and low[5] > lowRes2) and low > lowRes3 and fr2to17 > 0
pt2UHit = (high >= highRes3 and high[1] < highRes3 and high[2] < highRes3 and high[3] < highRes3 and high[4] < highRes3 and high[5] < highRes3) and fr2to17 > 0
pt2LHit = (low <= lowRes3 and low[1] > lowRes3 and low[2] > lowRes3 and low[3] > lowRes3 and low[4] > lowRes3 and low[5] > lowRes3) and fr2to17 > 0
//Rules for plotting 1 or 2 When Profit Target 1 or 2 is Reached
plotchar(snp and pt1UHit ? pt1UHit : na, title=’UpSide Profit Target 1 Achieved’, char=’1′, location=location.abovebar, color=white, transp=0, offset=0)
plotchar(snp and pt1LHit ? pt1LHit : na, title=’DownSide Profit Target 1 Achieved’, char=’1′, location=location.belowbar, color=white, transp=0, offset=0)
plotchar(snp and pt2UHit ? pt2UHit : na, title=’UpSide Profit Target 2 Achieved’, char=’2′, location=location.abovebar, color=white, transp=0, offset=0)
plotchar(snp and pt2LHit ? pt2LHit : na, title=’DownSide Profit Target 2 Achieved’, char=’2′, location=location.belowbar, color=white, transp=0, offset=0)