Hi guys, another year has passed, i want to start a discussion to the developement of automatic tradings and optimization.
Most of us discovered in many ways (sometimes with our blood $ :p ) the danger of overfitting of the optimization of strategies.
I’ve startet my journey of automatic trading with a discover of a strategy on this forum, the strategy was made by a talented user named Wyngs, i’ve found the strategy here: https://www.prorealcode.com/prorealtime-trading-strategies/wings-resistance-breacher-dax-30m/
At the beginning i was shocked and excited about it and i started that in real account. The first months i earned 2k euros or more, but since feb the strategy started to loose money and i stopped it.
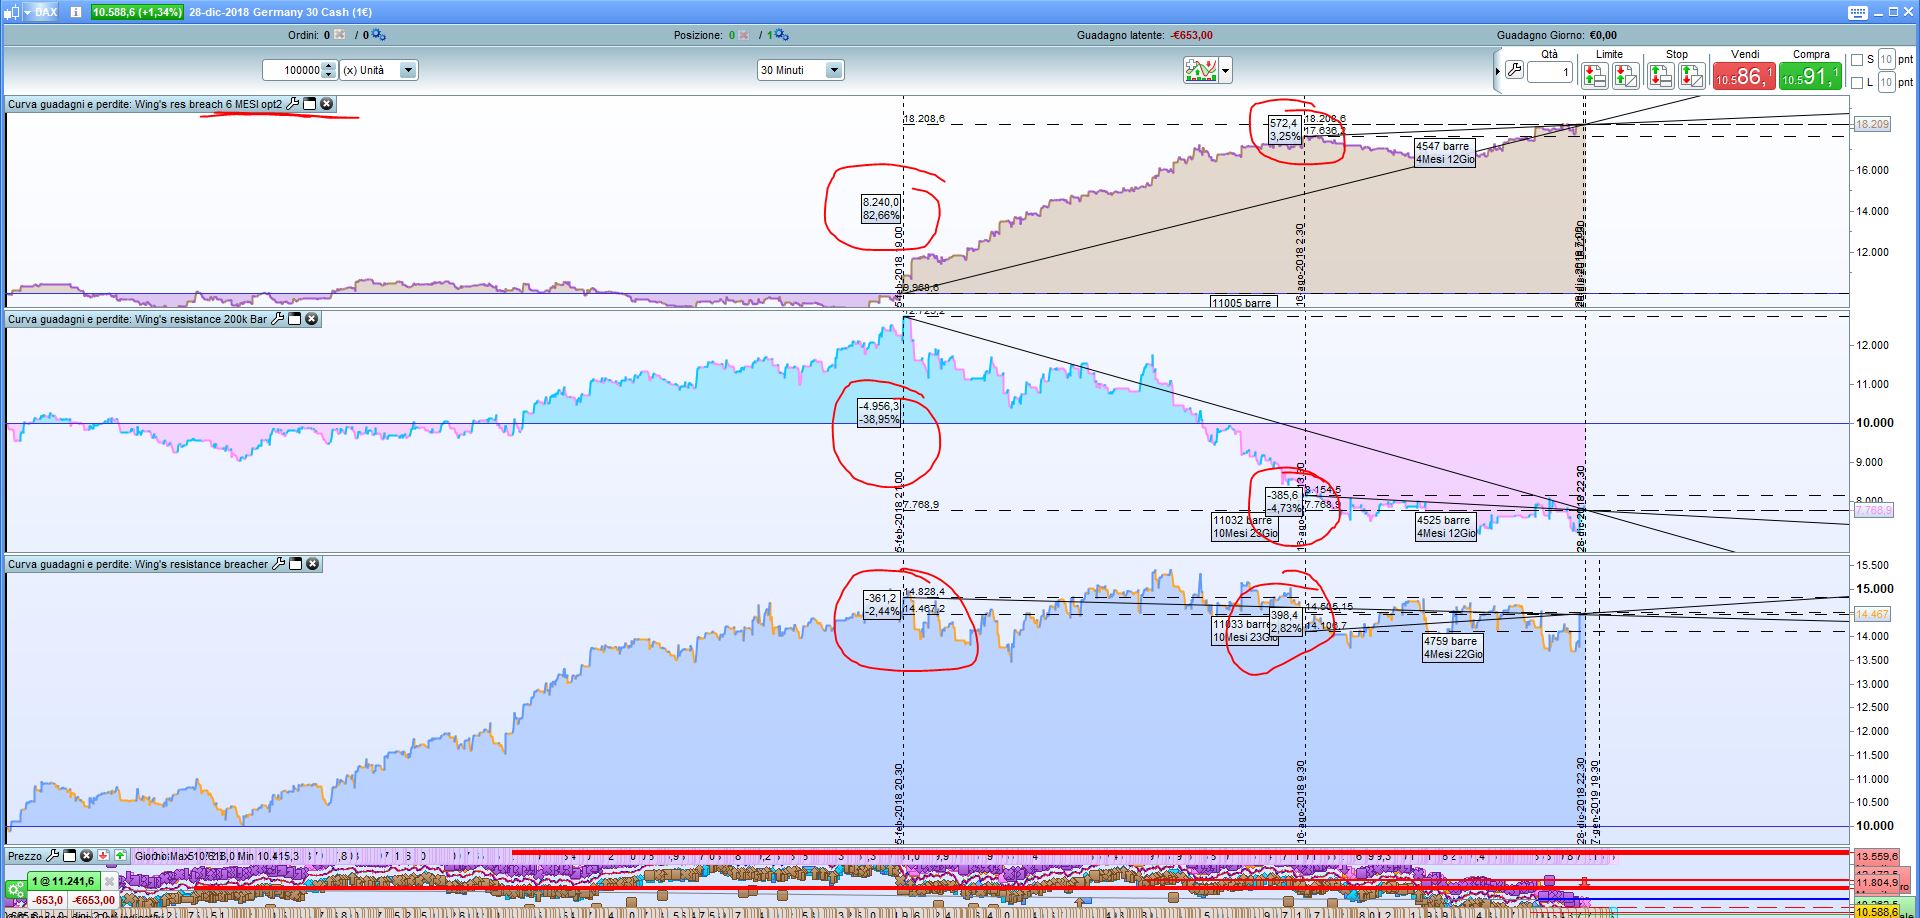
I had an idea i tried to check on a 200k bars graph and the differences from the original post where big, so i discovered that the strategy was overfitted only for 100k bars, and i had an idea. I tried to overfit that only for the last 6 months, then for 100k bars and then for 200k bars.
Here is the result on my demo account 1 year later. Many times most of people that i met in my first year of trading told me that a good strategy to perform well need to be backtested and work well for a long periods.
But with this little and inaccurate study i want to start a discussion that i hope can help many of us to find a good way to manage the automatic algos.
In this little confrontation of those strategies my conclusion are that the atomatic algos doesn’t need a too long and overfitted optimizazion but they nee a constant an monitorated update every 6 months.
Specially in theese years of change on the financial market, and specially for the 2019 that could be a another year of changes.
Here the photos of my study.
ps. I’m sorry for my englis but as you can see i’m just Italian :p
[attachment file=”87709″]
[attachment file=”87710″]
So is your conclusion that the strategy / settings for the bottom lower curve (optimised over 100k bars?) is the best our of the 3?
No, i think that the first one is the best. In fact the result from the started live is the better one of the others.
We could try to experiment something similar with othe strategies like pathfinder and monitoring them in the next months.
I cant see / decypher dates on the x axis, but would your plan be to optimise every 6 months (or even every month?) to avoid a possible repeat of that long run of dipping in and out of profit / loss on the first curve?
i’ve optimized the strategy the 17th july and the comparison is from that date since now. i think that the optimization need to be done every 6 months
i’ve optimized the strategy the 17th july
Apologies, but I am still not clear what you are saying?
So you optimised …
- All 3 Strategies ON 17 Jul 18?
- Only the top / first strategy ON 17 Jul 18?
Whilst i am not a huge fan of over optimisation and uber curve fitting if you do go down this road its worth observing what market conditions have changed to make current parameters fail . If there is a pattern correlated to market conditions you actually may be on the path to having a set of algos you can switch up with a set of filters as volatility , momentum , trend , (whatever condition you think appropriate changes ) . Just putting it out there but i believe the best algos are an amalgam of several algos bolted together with a set of filters to switch em on and of as different conditions prevail . A high volatility , a fearful volatility , a low volatility grindy up trend , etc etc styles combined … Just a thought , it works for me although im not one to over optomise . I may use optomisation to fine tune parameters but it has to work from the get go with logical thoughts backing it up . An outright strat made from purely optomised generics is almost a guarenteed fail imo
Going a step further keep copies of the code of several optomisations and run backtests concurrently and observe the periods they work overlaid with others , easiest way to see a pattern . Add a couple indicators to measure volatility , momentum and trend and you may be surprised at what you find . Certain parameter sets will work in certain conditions and it may possibly become evident on how to exploit that . If you want an algo to trade most market conditions it needs to be sort of intuitive , this may help in the path to that process , you learn just as much from what doesnt work as what does
my conclusion are that the atomatic algos doesn’t need a too long and overfitted optimizazion but they nee a constant an monitorated update every 6 months
That’s the purpose of the WFA tool included in the platform: determine the best period for a new optimization to be made.
 CKW
CKWParticipant
Veteran
Hi,
i do not a have fixed number of months to re-optimize. It depends on the outcome of WFA analysis but sometimes can be difficult to choose the right period for some (less performance) systems.
E.g
1) 3 repetitions WFA (70/30) generates better Gain & G/L ratio but 2 of 3 WFA generates less than 50%.
2) 1 repetition WFA (70/30) generates less Gain & G/L ratio but the WFA generates more than 50%
Both equity curve looks similar. In your opinion, Which period do you think is more reliable ?
Br
2 of 3 WFA generates less than 50%.
If the period that generates > 50% is the most recent period then go with those values for the variables and optimise every X months (X = length of 1 x WFA period).
But I agree it is very subjective and I may not do above depending on the difference in overall equity curve result / profit.
I have never arrived at a fixed set of rules which I follow, it seems to be what I think best at the time (I would prefer fixed rules! 🙂 ).
CKWParticipant
Veteran
Hi Grahal,
Thanks for your sharing.
What I do is: After identified the best period of WFA (X = length of IS, Y = length of OOS), I will run the final optimization on X length as current IS period then actual result = OOS.
End of Y is the time that I need to re-run the optimization.
Not sure if this additional step is redundant. Your feedback are welcomed.
Br
So CKW if I am understanding what you are saying above and to put some figures in so I can understand it better …
If you have 3 x 3 months IS = 9 months and 3 x OOS periods of 1 month each = 3 months so TOTAL WFA period = 12 months.
As an example … your best X / IS period is 3 months ending Today – / minus 1 Month (due to OOS period following an IS period.
So you then optimise all your variables over the most recent 3 month period (ending today).
Then you set your Strategy on Forward Test and you optimise again after 4 Months??
Have I got it correct what you said above??
CKWParticipant
Veteran
Hi Grahal,
I was referring “not anchored” so it should be 1st IS + 1st OOS + 2nd OOS + 3rd OOS = WFA period
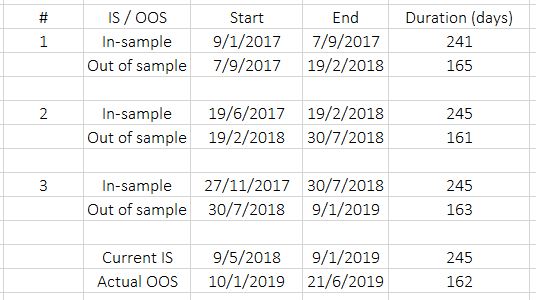
Table below is example of 30m timeframe for 100k bars. (24 months)
I will manual run final optimization from 9/5/18 to 9/1/19 (last 245 days) to pick the best performance. After 162 days (which is 21/6/19), I will repeat this optimization.
If I understanding the most recent variable from WFA report, it does not include the market behaviour between 30/7/18 – 9/1/19.
thanks for your advise.
If I understanding the most recent variable from WFA report, it does not include the market behaviour between 30/7/18 – 9/1/19.
30/7/18 – 9/1/19 is an OOS period, so variables set / optimised in the IS period (27/11/17 to 30/7/18) are applied (without any further optimisation) to prices in the OOS period.
Hope that helps?