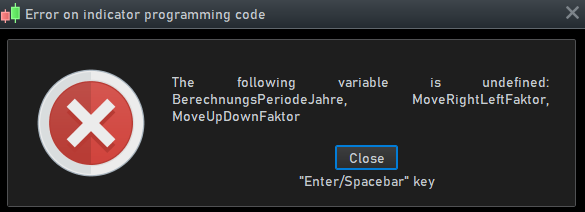
I wonder why my Code is not runnig on a daily chart. Used TF’s are yearly and monthly – to my understandig both multiples of 1 day
I appreciate, if you could check for the reason. Even after hours of testing I was not able to get an idea.
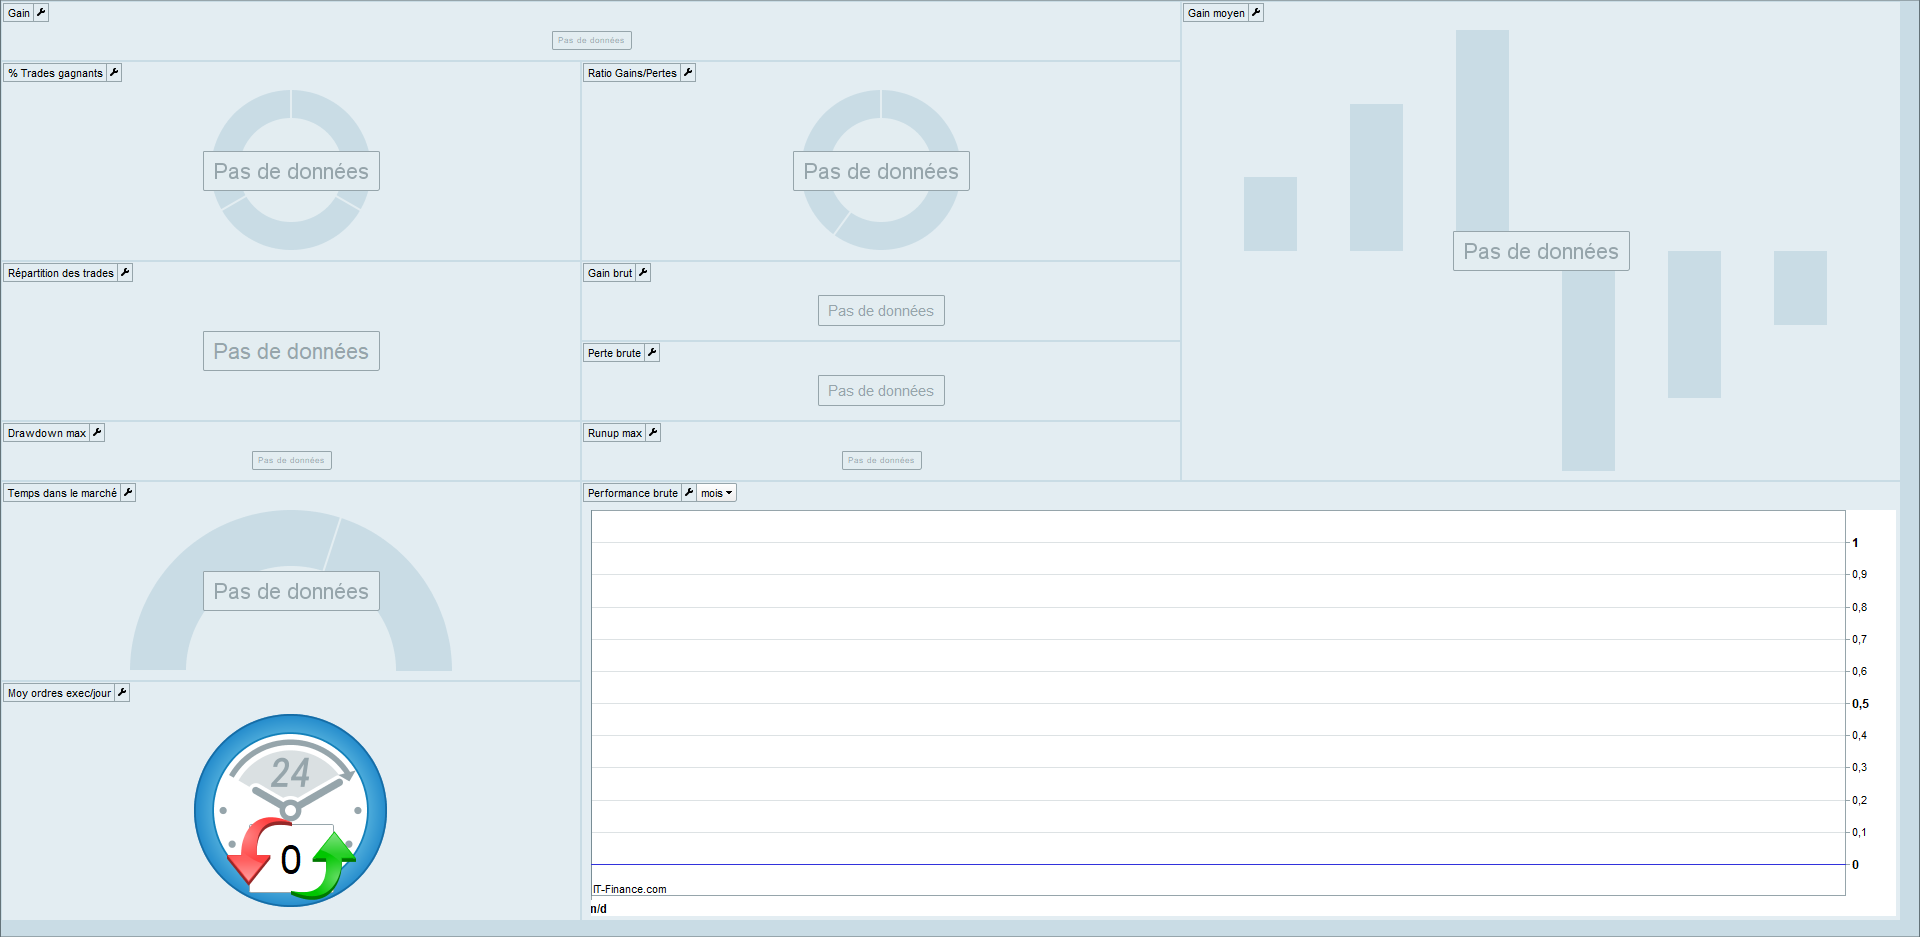
The idea behind is, to perform a performance check on shares and to show the result as text in the chart. The return values are foreseen for usage in a screener.
Only InputValue is “BerechnungsPeriodeJahre” = calculation period in years. Meaning how far the lookback shall be in years.
On yearly basis on a per anno yield is calculated, on monthly basis then other performance values.
defparam DRAWONLASTBARONLY = true

timeframe(yearly)
// Als Startwert für Zuwachs-/PARmax Berechnung wird das höchste historische Close bis zum Beginn der
// Berechnungsperiode gewählt, jedoch max. 5 Jahre zurück
// Dadurch wird ein zu positives Ergebnis wegen eines zwischenzeitlichen, zum Beginn der
// Berechnungsperiode noch nicht beendeten DrawDowns vermieden

lookBack = 5

if islastbarupdate and barindex > lastcalcyearlybarindex then
for y = BerechnungsPeriodeJahre + lookBack downto BerechnungsPeriodeJahre + 1 do
curhighestclose = max(curhighestclose, close[y])
if curhighestclose > prevvalue then
highjahr = year - y
prevvalue = curhighestclose
endif
next

if open[BerechnungsPeriodeJahre] >= curhighestclose then
highjahr = Year[BerechnungsPeriodeJahre]
endif

// Startwerte = Werte am Anfang der Berechnungsperiode
bedopen              = open[BerechnungsPeriodeJahre] >= curhighestclose
firstopen            = max(open[BerechnungsPeriodeJahre], curhighestclose)
StartJahr            = Year[BerechnungsPeriodeJahre]
auswertungszeitraumJ = Year - StartJahr + (days - days[1])/365

lastcalcyearlybarindex = barindex
endif

timeframe(monthly)
BerechnungsPeriodeMonate = round(auswertungszeitraumJ*12)

//// MonatsSchlusskurse speichern
$MClose[barindex] = close

if IsLastBarUpdate then
if barindex > lastcalcmonthlybarindex then
for m = BerechnungsPeriodeMonate downto 0 do
// Datenerfassung für Draw Down Berechnungen
highestOC = max(highestOC, max(close[m], open[m]))
lowestclose  = min(close[m], lowestclose)

if (highestOC > prevhighestOC) then
prevhighestOC = highestOC
lowestclose      = highestOC
endif

if lowestclose < prevhighestOC then
currDrawDownmax    = max(currDrawDownmax, 1 - lowestClose / highestOC)
elsif lowestclose >= prevhighestOC then
GesamtSummeDrawDowns = GesamtSummeDrawDowns + currDrawDownmax
currDrawDownmax = 0
endif

// Datenerfassung für monatliches Verlustrisiko für beendete Monate, zeitliche Gewichtung
// Gewichtungsfaktor: letzter Monat = BerechnungsPeriodeMonate, erster Monat = 1
if m > 0 then
gewichtungsfaktor = BerechnungsPeriodeMonate - m + 1
if close[m] < open[m] then
VerlustMonate = VerlustMonate + 1
sumgewichteterVerlustMonatlich = sumgewichteterVerlustMonatlich + (1 - close[m]/open[m]) * gewichtungsfaktor
sumGewichtungsfaktorVerlust = sumGewichtungsfaktorVerlust + gewichtungsfaktor
endif
else
gewichtungsfaktor = 0
endif
next

//Datenerfassung für variable GewinnKonstanzVarZeitraum
for firstmonth =  lastset($MClose) - BerechnungsPeriodeMonate to lastset($MClose) do
for nextmonths = firstmonth + 1 to lastset($MClose) - 1 do
if $MClose[nextmonths] > $MClose[firstmonth] then
GewinnPerioden = GewinnPerioden + 1
endif
AnzahlPerioden = AnzahlPerioden + 1
next
next

// Auf letztem Balken Wert für Summe DD berechnen, auch wenn DD noch nicht beendet ist
if currDrawDownmax > 0 then
GesamtSummeDrawDowns = GesamtSummeDrawDowns + currDrawDownmax
endif

lastcalcmonthlybarindex = barindex
endif  //if barindex > lastcalcmonthlybarindex

// VERLUSTRISIKO MONATLICHER ZEITRAUM
// Häufigkeit mit der eine Anlage zu Monatsbeginn mit einer Anlagedauer von 1 Monat im
// Betrachtungszeitraum zu einem negativen Ergebnis geführt hätte
monatlicheVerlustwahrscheinlichkeit = VerlustMonate / BerechnungsPeriodeMonate
gewichteterDurchschnittVerlust = sumgewichteterVerlustMonatlich / sumGewichtungsfaktorVerlust
monatlichesVerlustRatio = monatlicheVerlustwahrscheinlichkeit * gewichteterDurchschnittVerlust

// GEWINNKONSTANZ VARIABLER ZEITRAUM
// Häufigkeit, mit der eine monatliche Anlage mit beliebiger Anlagedauer im
// Betrachtungszeitraum zu einem positives Ergebnis geführt hätte
GewinnKonstanzVarZeitraum = GewinnPerioden/AnzahlPerioden

// WERTZUWACHS
///////////////////////////////////////////////////////////////
highestZuwachs = highestOC/firstopen - 1
currZuwachs    = Close/firstopen - 1

// HÖCHSTE PER ANNO RENDITE
// Rendite p.a. = (1 + Wertentwicklung) ^ (365 / Tage) - 1
// PARmax = POW(1 + Zuwachs, potenz) - 1
// y = x ^ p muss wegen PRT Fehler wie folgt codiert werden: y = EXP(p * LOG(x))
///////////////////////////////////////////////////////////////
potenz = 1 / auswertungszeitraumJ
PARmax = exp(potenz * log(1 + highestZuwachs)) - 1

// WAHRSCHEINLICHE PARmax
if (PARmax >= 0) then
WahrscheinlichePARmax = PARmax * GewinnKonstanzVarZeitraum
else
WahrscheinlichePARmax = PARmax / GewinnKonstanzVarZeitraum
endif

// CRV
///////////////////////////////////////////////////////////////
if GesamtSummeDrawDowns > 0 then
CRV = highestZuwachs / GesamtSummeDrawDowns
else
CRV = highestZuwachs
endif

//ALL IN ONE KENNZAHL
RisikoAdjustiertePerformanceKennzahl = WahrscheinlichePARmax * CRV / monatlichesVerlustRatio


// TÄGLICHES HANDELSVOLUMEN IM BETRACHTUNGSZEITRAUM
tagepromonat = 20
avgdailyvolume = summation[BerechnungsPeriodeMonate](volume) / (tagepromonat * BerechnungsPeriodeMonate)


endif // IsLastBarUpdate TF monthly

timeframe(default)
// RUNDUNG FÜR BESSERE DARSTELLUNG
///////////////////////////////////////////////////////////////
currZuwachsvH                    = round(currZuwachs * 100)
highestZuwachsvH                 = round(highestZuwachs * 100)
PARmaxvH                         = round(PARmax * 100)
GewinnKonstanzVarZeitraumrounded = round(GewinnKonstanzVarZeitraum * 100,1)
currDrawDownMaxvH                = round(currDrawDownmax * 100)
CRVrounded                       = round(Max(1, CRV))
WahrscheinlichePARmaxrounded     = round(WahrscheinlichePARmax * 100,0)
SummeDrawDownsvH                 = round(GesamtSummeDrawDowns * 100)
lastcloserounded                 = round(close * 100) / 100
firstopenrounded                 = round(firstopen * 100) / 100
highestOCrounded                 = round(highestOC * 100) / 100
lowestCloserounded               = round(lowestClose * 100) / 100
auswertungszeitraumJrounded      = round(auswertungszeitraumJ,1)
monatlichesVerlustRatiovH        = round(monatlichesVerlustRatio * 100,1)
RisikoAdjustiertePerformanceKennzahlrounded = round(RisikoAdjustiertePerformanceKennzahl/10,1)
avgdailyvolumerounded                       = round(avgdailyvolume)

// ZUSATZINFORMATIONEN IM INDIKATORCHART ANZEIGEN
///////////////////////////////////////////////////////////////
offsethor = MoveRightLeftFaktor   // horizontale Pos. vom Ankerpunkt
offsethorsp2 = offsethor + 175
offsetver = 10 * MoveUpDownFaktor      // vertikale Pos. vom Ankerpunkt
step      = -22                        // Schrittweite vertikale Pos. für verschiedene Zeilen
zeilen    = 0

Drawtext("AUSWERTUNGZEITRAUM #auswertungszeitraumJrounded#J ab 01 / #StartJahr#",    offsethor+50,  offsetver + zeilen * step, SansSerif, Bold, 15) coloured( 72, 118, 255) anchor  (left)

zeilen = 1.5 + zeilen
dist = 20
Drawtext("PerformanceKennzahl",                            offsethor - dist,  offsetver + zeilen * step,   SansSerif, Bold, 15) coloured(200, 0, 200)   anchor (left)
Drawtext("#RisikoAdjustiertePerformanceKennzahlrounded#",  offsethorsp2 ,     offsetver + zeilen * step,   SansSerif, Bold, 15) coloured(200, 0, 200)   anchor (left)

zeilen = 1.5 + zeilen
Drawtext("PARmax",                   offsethor - 3 * dist - 10,  offsetver + zeilen * step,   SansSerif, Bold, 15) coloured(0, 125 ,0) anchor (left)
Drawtext("avg   #PARmaxvH# % p.a.",  offsethorsp2,               offsetver + zeilen * step,   SansSerif, Bold, 15) coloured(0, 125 ,0) anchor (left)

zeilen = 1 + zeilen
Drawtext("GewinnKonstanz langfristig",            offsethor - 2,  offsetver + zeilen * step,   SansSerif, Bold, 15) coloured(0, 125 ,0) anchor (left)
Drawtext("#GewinnKonstanzVarZeitraumrounded# %",  offsethorsp2,   offsetver + zeilen * step,   SansSerif, Bold, 15) coloured(0, 125 ,0) anchor (left)


zeilen = 1 + zeilen
Drawtext("WahrscheinlichePARmax",                       offsethor - 13,  offsetver + zeilen * step,   SansSerif, Bold, 15) coloured(0, 125 ,0) anchor (left)
Drawtext("avg   #WahrscheinlichePARmaxrounded# % p.a.", offsethorsp2,    offsetver + zeilen * step,   SansSerif, Bold, 15) coloured(0, 125 ,0) anchor (left)


zeilen = 1.5 + zeilen
Drawtext("CRV",            offsethor - 4 * dist - 4,  offsetver + zeilen * step,    SansSerif, Bold, 15) coloured(250, 200, 250) anchor (left)
Drawtext("#CRVrounded# ",  offsethorsp2,              offsetver + zeilen * step,    SansSerif, Bold, 15) coloured(250, 200, 250) anchor (left)

zeilen = 1 + zeilen
Drawtext("VerlustRatio monatl.",     offsethor - 1.4 * dist,  offsetver + zeilen * step,    SansSerif, Bold, 15) coloured(250, 200, 250) anchor (left)
Drawtext("#monatlichesVerlustRatiovH#", offsethorsp2,    offsetver + zeilen * step,    SansSerif, Bold, 15) coloured(250, 200, 250) anchor (left)


zeilen = 1.5 + zeilen
Drawtext("last highest Close",          offsethor - 1.5  * dist - 6,  offsetver + zeilen * step,   SansSerif, Bold, 15) coloured(238,59,59) anchor (left)
Drawtext("#highestOCrounded# Pkte",  offsethorsp2,                 offsetver + zeilen * step,   SansSerif, Bold, 15) coloured(238,59,59) anchor (left)

zeilen = 1 + zeilen
Drawtext("last Lowest Close",          offsethor - 1.5  * dist - 6,  offsetver + zeilen * step,   SansSerif, Bold, 15) coloured(238,59,59) anchor (left)
Drawtext("#lowestCloserounded# Pkte",  offsethorsp2,                 offsetver + zeilen * step,   SansSerif, Bold, 15) coloured(238,59,59) anchor (left)

zeilen = 1 + zeilen
Drawtext("curr. DrawDown max.",         offsethor - dist - 4,  offsetver + zeilen * step,   SansSerif, Bold, 15) coloured(238,59,59) anchor (left)
Drawtext("#currDrawDownMaxvH# %",       offsethorsp2,          offsetver + zeilen * step,   SansSerif, Bold, 15) coloured(238,59,59) anchor (left)

zeilen = 1 + zeilen
Drawtext("Summe DrawDowns",              offsethor - dist - 10,  offsetver + zeilen * step,   SansSerif, Bold, 15) coloured(238,59,59) anchor (left)
Drawtext("#SummeDrawDownsvH# %",         offsethorsp2,           offsetver + zeilen * step,   SansSerif, Bold, 15) coloured(238,59,59) anchor (left)

zeilen = 1.5 + zeilen
if not bedopen then
Drawtext("First Open = Close #highjahr#",  offsethor - 12,  offsetver + zeilen * step,   SansSerif, Bold, 15) coloured(100, 100 , 255) anchor (left)
else
Drawtext("First Open = Open #StartJahr#",  offsethor - 12,  offsetver + zeilen * step,   SansSerif, Bold, 15) coloured(100, 100 , 255) anchor (left)
endif
Drawtext("#firstopenrounded# Pkte",      offsethorsp2,         offsetver + zeilen * step,   SansSerif, Bold, 15) coloured(100, 100 , 255) anchor (left)

zeilen = 1 + zeilen
Drawtext("Today Close",                offsethor - 2.5 * dist - 7,  offsetver + zeilen * step,   SansSerif, Bold, 15) coloured(100, 100 , 255) anchor (left)
Drawtext("#lastcloserounded# Pkte",    offsethorsp2,                offsetver + zeilen * step,   SansSerif, Bold, 15) coloured(100, 100 , 255) anchor (left)

zeilen = 1 + zeilen
Drawtext("Zuwachs höchster",            offsethor - 1.5 * dist - 5,  offsetver + zeilen * step,   SansSerif, Bold, 15)  coloured(100, 100, 255) anchor (left)
Drawtext("#highestZuwachsvH# %",        offsethorsp2,                offsetver + zeilen * step,   SansSerif, Bold, 15)  coloured(100, 100, 255) anchor (left)

zeilen = 1 + zeilen
Drawtext("Zuwachs akt.",                offsethor - 2.5 * dist - 4,  offsetver + zeilen * step,   SansSerif, Bold, 15)  coloured(100, 100, 255) anchor (left)
Drawtext("#currZuwachsvH# %",            offsethorsp2,                offsetver + zeilen * step,   SansSerif, Bold, 15)  coloured(100, 100, 255) anchor (left)

zeilen = 1 + zeilen
Drawtext("avg. daily Volume",            offsethor - 1.5 * dist - 8,  offsetver + zeilen * step,   SansSerif, Bold, 15)  coloured(100, 100, 255) anchor (left)
Drawtext("#avgdailyvolumerounded# ",     offsethorsp2,                offsetver + zeilen * step,   SansSerif, Bold, 15)  coloured(100, 100, 255) anchor (left)


// AUSGABE DES ERGEBNISSES
///////////////////////////////////////////////////////////////
return RisikoAdjustiertePerformanceKennzahlrounded as "PerformanceKennzahl", highestOC as "highest Close", lowestClose as "lowest Close", close as "last Close", avgdailyvolume as "AVG Daily Volume"