Here is an example of an EMA 20 periods of the 1000 ticks chart applied on the 20 ticks chart:
timeframe(1000 ticks,updateonclose)
a = average[20,1]

return a
Hello, what does updateonclose parameters do exactly please ?
example :
timeframe(1 hour,updateonclose) used in a 15minutes chart and let’s say it is 11h22 o clock:
does that mean that for all 15mn candles inside the 1hour current candle (from 11h to 12h), test will use the 1h indicators values at the end of the 10h candle (closing at 11h) without actualising values for the current price (after 11h) ? or that the 1h indicators prices at current time (after 11h) will be refreshed at each 15mn candle close ?
thanks in advance
 VIOT
VIOTParticipant
Junior
Bonjour Nicolas,
(Suis nouveau et en surfant je vois le travail d’accompagnement / aide que vous assurez : impressive !! )
Mon projet de swing trader en herbe ! : pour voir clair, construire des backtests et des screeners, j’aimerais ;
sous le graph de prix en Daily, voire en 4H, mettre un histogr visuel de rappel de la tendance de l’UT supérieure (par ex W) proposée par PRT trend, en affichant tout simplement dans un 1er temps la variable trend (W) : +1 = vert, -1 = rouge
Est-ce possible ? car je suis en train de galérer, ..
ou peut-être ne peut-on faire du MTF qu’uniquement en UT inférieures à celle du graph principal ?Merci de votre réponse
Hello Nicolas, (I’m new and while surfing I see the support / help you provide: impressive !!) My budding swing trader project! : to see clearly, to build backtests and screeners, I would like; under the price graph in Daily, or even in 4H, put a visual histogram of the trend of the upper UT (for example W) proposed by PRT trend, by simply displaying in a 1st time the trend variable (W ): +1 = green, -1 = red Is this possible? because I am struggling, .. or maybe we can only do MTF in UT lower than that of the main graph? Thank you for your answer
Only post in the language of the forumthat you are posting in. For example English only in the English speaking forums and French only in the French speaking forums.
Thank you 😊
VIOTParticipant
Junior
précision à ma requête précédente : ne marche pas non plus si UT principale = 1 jour et indicateur avec UT = 5 jours (au lieu de Weekly) et ne marche pas en ajoutant le “updateonclose” ie timeframe( 5 days, updateonclose)
precision to my previous request: does not work either if main UT = 1 day and indicator with UT = 5 days (instead of Weekly) and does not work by adding the “updateonclose” ie timeframe (5 days, updateonclose)
I have spotted something strange in the MTF behaviour… maybe it’s me that I missed something but let’s discuss it.
I’ll put down an example: I just want to plot (using the “timeframe” instruction) a 200 ticks bars inside a 50 ticks bars graph.
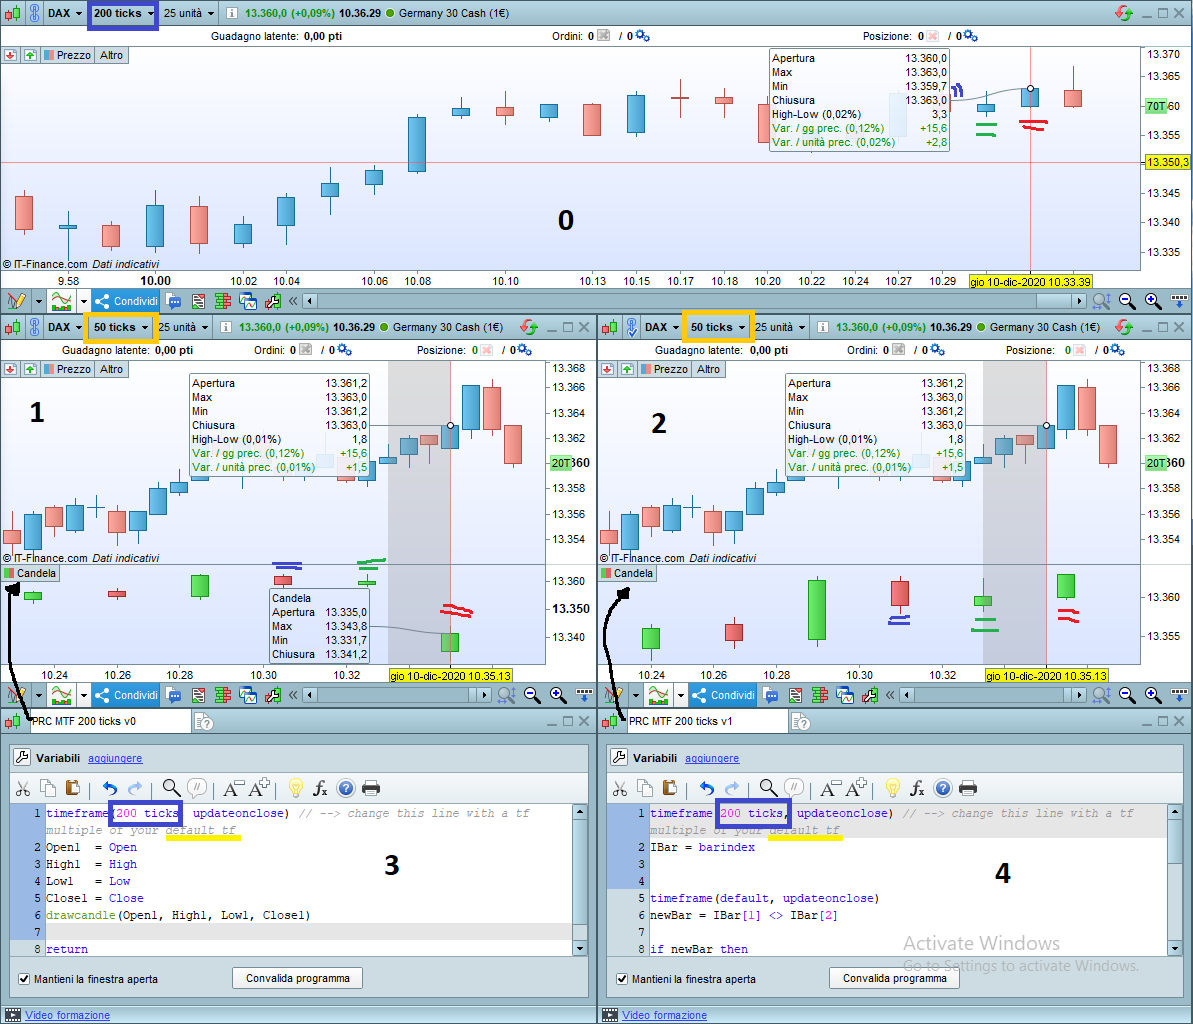
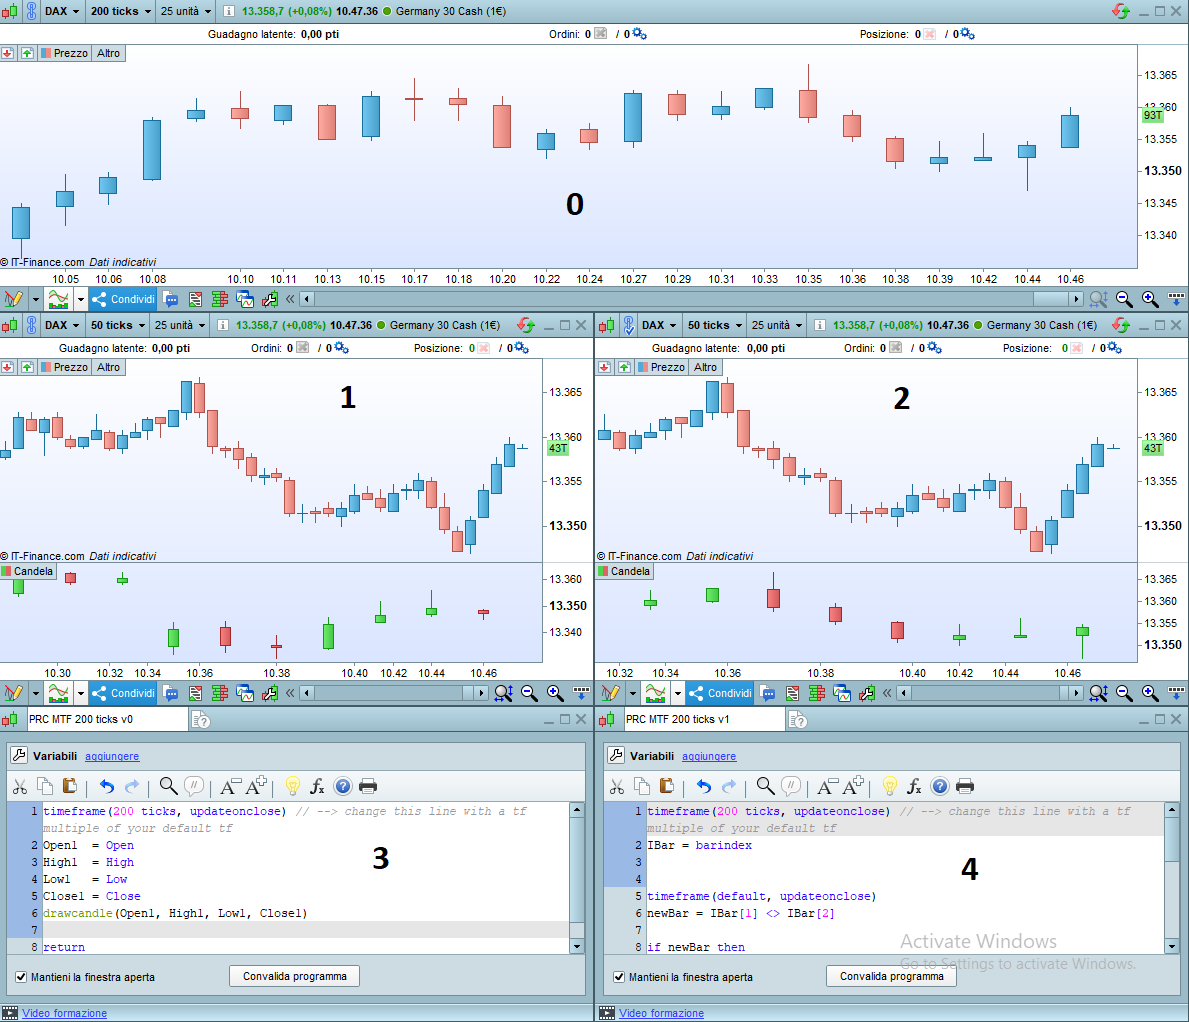
So the idea is really simple and I have done as follows (see the attached pictures):
- Window 0: the 200 ticks graph
- Window 1: the 50 ticks graph with “PRC MTF 200 ticks v0” applied
- Window 2: the 50 ticks graph with “PRC MTF 200 ticks v1” applied
- Window 3: the probuilder “PRC MTF 200 ticks v0”
- Window 4: the probuilder “PRC MTF 200 ticks v1”
I would expect to see inside the Window 1 and 2 the same bars (in the bottom) of Window 0 (the 200 ticks bars), but it’s not the case…
Apparently “PRC MTF 200 ticks v0” is not working as I expected.
So I wrote the “PRC MTF 200 ticks v1”, in which I have written a workaround to get what I expected to get…
I post here my two different codes:
timeframe(200 ticks, updateonclose) // --> change this line with a tf multiple of your default tf
Open1  = Open
High1  = High
Low1   = Low
Close1 = Close
drawcandle(Open1, High1, Low1, Close1)

return
timeframe(200 ticks, updateonclose) // --> change this line with a tf multiple of your default tf
IBar = barindex


timeframe(default, updateonclose)
newBar = IBar[1] <> IBar[2]

if newBar then
    Open1  = Open0
    High1  = max(High0, High[1])
    Low1   = min(Low0, Low[1])
    Close1 = Close[1]

    Open0  = Open
    High0  = 0
    Low0   = +1073741824 // 2^30

    drawcandle(Open1, High1, Low1, Close1)
else
    Low0 = min(Low0, Low[1])
    High0 = max(High0, High[1])
endif

return
Is there another simply way to get the same result that I obtained with “PRC MTF 200 ticks v1” code?
Thank you in advance!
With your “Version 0” code I have same candlesticks than in 200 ticks chart (same OHLC).
The way you build the current candlestick is indeed a way to do it.
I have the same bars just with historical bars. In the moment I leave it run for a while on real, all values of the new bars are completely different from the “Window 0”. (PRT v11+IG)
I am still investigating on it…
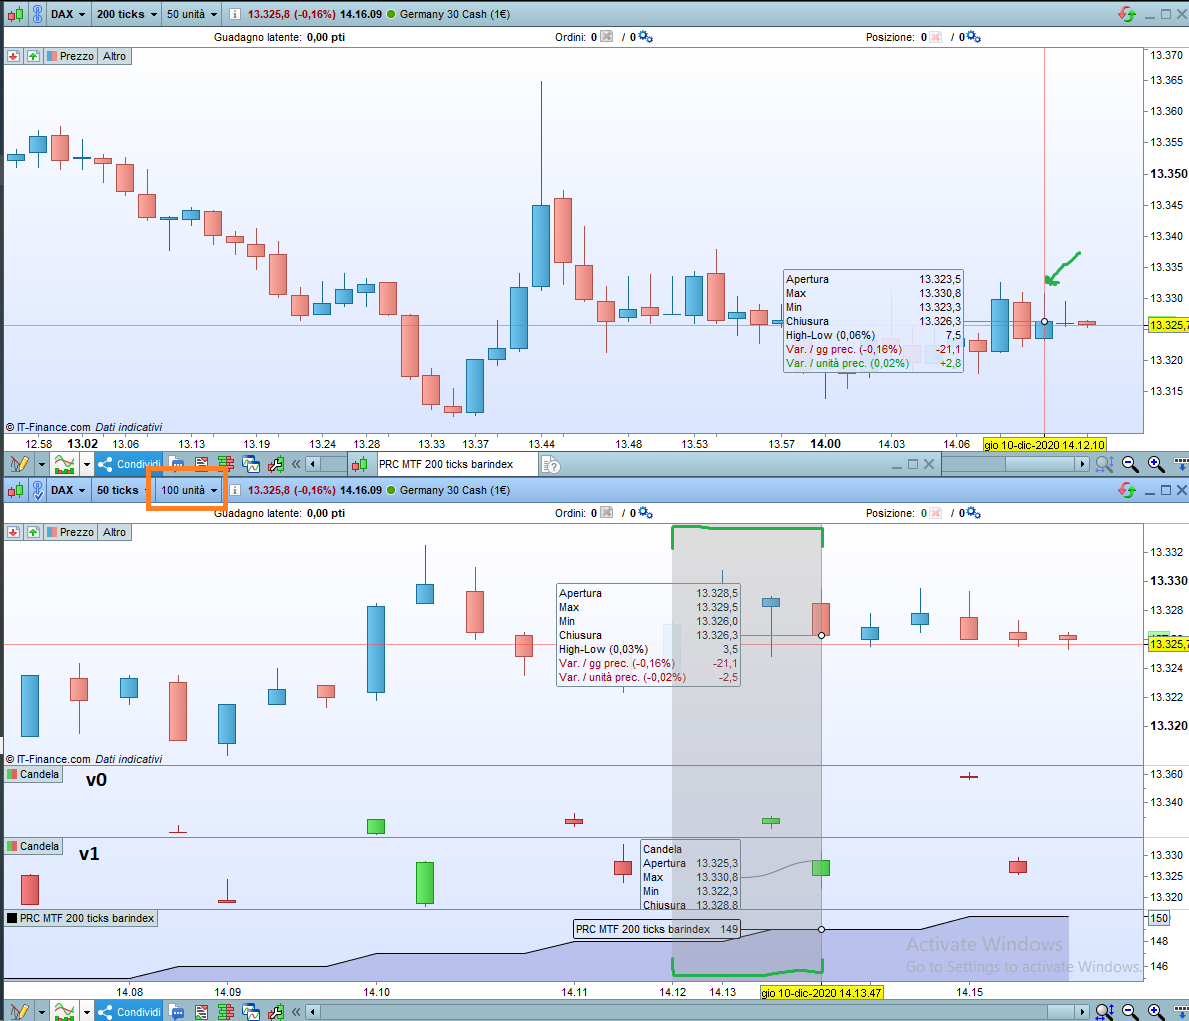
I have written this simple code:
timeframe(200 ticks, updateonclose)
IBar = barindex

timeframe(default, updateonclose)
return IBar
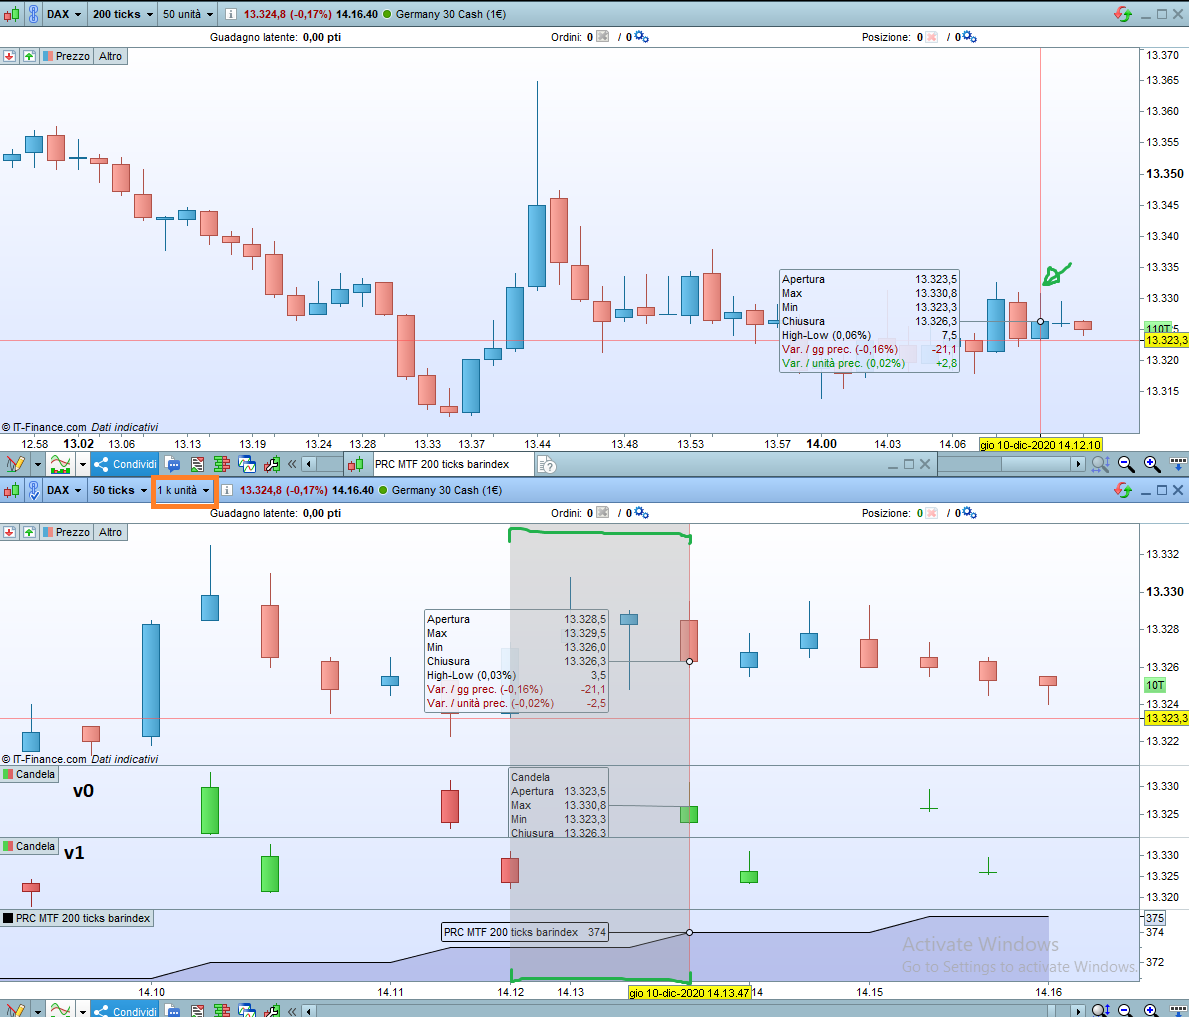
In the two attachments: the first with a 50 ticks and 50 units, the latter 50 ticks with 1k units…
If you compare the zone that i marked in green on the attachments with the IBar variable something strange is going on I think…
At least I see that it behaves differently from how I expect.
I would expect that in both the situations the green higlighted zone would have been plotted on the same bars in the two cases. And it is not the case.
I would like to programmatically control the timeframe (x) instruction with a variable x containing the minutes. Is that possible in any way?
No, it isn’t; only numeric constants are allowed.
Hi I use PRT with IG . They have just started rolling out v11.
IS multi time frame indicator facility available for programming in pro real code or is it still in development?
Thanks
Already available!
You can start writing a simple mtf indicator and test it.