This is the same one as above, that can be used in straategies:
// Multiple TFs (example)
//
Timeframe(Daily,UpdateOnClose)
sma1 = average[5,0](close)
Timeframe(4h,UpdateOnClose)
sma2 = average[5,0](close)
Timeframe(1h,UpdateOnClose)
sma3 = average[5,0](close)
Timeframe(30 minute,UpdateOnClose)
sma4 = average[5,0](close)
Timeframe(15 minute,UpdateOnClose)
sma5 = average[5,0](close)
Timeframe(5 minute,UpdateOnClose)
sma6 = average[5,0](close)
Timeframe(8h,UpdateOnClose)
sma7 = average[5,0](close)
Timeframe(1 minute,UpdateOnClose)
sma8 = average[5,0](close)
Timeframe(default,UpdateOnClose)
sma9 = average[5,0](close)
Timeframe(Daily,default)
sma10 = average[5,0](close)
Timeframe(Daily,UpdateOnClose)
sma11 = average[5,0](close)
Timeframe(5 minute,default)
sma12 = average[5,0](close)
//return sma1 as "sma1",sma2 as "sma2",sma3 as "sma3",sma4 as "sma4",sma5 as "sma5",sma6 as "sma6",sma7 as "sma7",sma8 as "sma8",sma9 as "sma9",sma10 as "sma10",sma11 as "sma11",sma12 as "sma12"
buy at  -close limit
//
graphonprice sma1
graphonprice sma2
graphonprice sma3
graphonprice sma4
graphonprice sma5
graphonprice sma6
graphonprice sma7
graphonprice sma8
graphonprice sma9
graphonprice sma10
graphonprice sma11
graphonprice sma12
Tnx for that. So to understand TimeFrame keyword, why have you used the below 3 timeframes in the same code? How are they different from each other?
Timeframe(default,UpdateOnClose)
Timeframe(Daily,default)
Timeframe(Daily,UpdateOnClose)
The time frames I want to cover are:
1 hr
2 hr
3 hr
4 hr
5 hr
6 hr
7 hr
8 hr
9 hr
10 hr &
11 hr
So how do you suggest I set up the code including Default, UpdateonClose etc?
Timefrane(default,UpdateOnClose) is mispelled. Actually it can be used, but UpdateOnClose is redundant with the DEAFAULT TF, as it can’t be any different, it is ALWAYS executed when a bar closes and cannot be update while that bar is forming. The difference between the two keywords is useful with its multiple TFs, which can be accessed while the bar is forming, UpdateOnClose updates variables when that bar closes, while Default updates variables when the DEFAULT bar closes (i.e. when the higher bar is forming).
Those two with Timeframe(Daily,UpdateOnClose) are the same, I wrote them just to show that you can use that keyword multiple times in a scattered way, there’s no need for them to be in any order.
Timeframe(Daily,UpdateOnClose) and Timeframe(Daily,Default) are different, as explained above.
Hello
Is there any way to detect the selected Timeframe, I want to display or not certain indicators according to the selected timeframe.
Regards
Ameur
Amer,
There is a function for that added in PRT v11 gettimeframe, returning the time-frame on seconds.
See
GetTimeframe
Hallo,
vielen Dank für die Beiträge. Die neue Funktion erleichtert die taktische Vorgehensweise in der Systematik unheimlich.
Wie würden Sie ein MACD(12,26,9)[D1] und MACD(12,26,9)[H4] und MACD(12,26,9)[H1] in einem Indikator codieren?
Ausgabe ist ein Histogramm! 😉
Grus Vjper
Hi there, Thanks for the contributions. The new function makes the tactical approach in the system a lot easier. How would you code a MACD (12,26,9) [D1] and MACD (12,26,9) [H4] and MACD (12,26,9) [H1] in one indicator? Output is a histogram! 😉 Grus Vjper
@Vjper
See examples on how to code with MTF instructions on page 1.
Hi…
Having a problem when backtesting with my indicator(s) which have ‘TimeFrame’ code in them.
When using indicators as stand alone everything works fine with chart plotting what’s expected, but if I try to backtest I get error:-
“Backtest can’t start because of a parsing error in the code: line 1, column 0.”
I’ve investigated the code and narrowed it down to the ‘TimeFrame’ command which ended up on line1 column 0
Still get error with just basic code if ‘TimeFrame’ used, which error’ed on line1 column 0.
All errors point to a line/column where the ‘timeFrame’ command is
Can someone verify if you can backtest with indicator’s using the ‘TimeFrame’ command .
You will not be able to do that. Create indicators for one single timeframe and use TIMEFRAME instructions directly into the ProBacktest code.
Hi everyone,
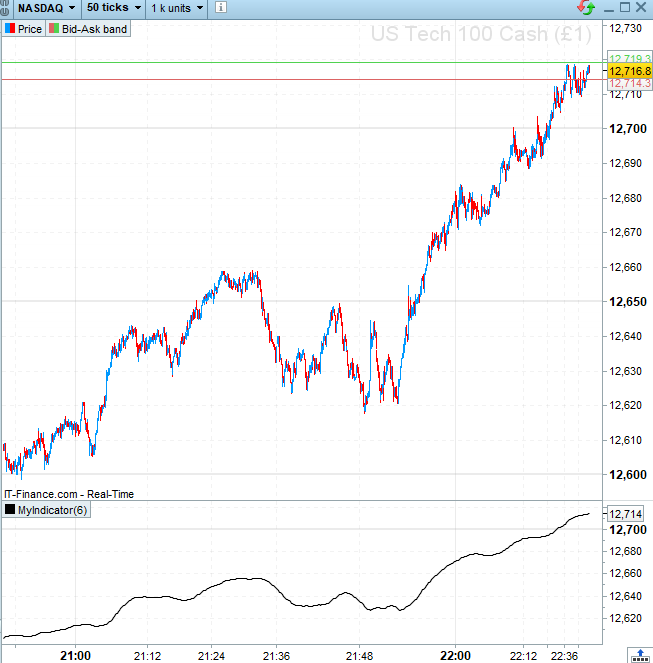
How can I display the SMA of a given timeframe ON THE GRAPH of a lower timeframe?
For instance, I want to display the SMA20 100 ticks on the 50 ticks chart.
Please see attached a screenshot, I can only get in in a separate panel.
Here is the code I used (sorry I could not find how to add it in the specific PRT code window)
TIMEFRAME(100 ticks, UPDATEONCLOSE)
ind=Average[20](close)
return ind
Thank you!
Hi everyone,
How can I display the SMA of a given timeframe ON THE GRAPH of a lower timeframe?
For instance, I want to display the SMA20 100 ticks on the 50 ticks chart.
Please see attached a screenshot, I can only get in in a separate panel.
Here is the code I used (sorry I could not find how to add it in the specific PRT code window)
TIMEFRAME(100 ticks, UPDATEONCLOSE)
ind=Average[20](close)
return ind
Thank you!
@robertogozzi @Nicolas, do you guys know by any chance?
Add the indicator on the price chart, see how: How to add an Indicator On Price
Hi Nicolas,
Thanks a lot for your time!