Hi Everyone,
I would be interested in launching a strategy that buys/short a support/resistance of a high timeframe and sells/exitshort at the resistance/support of a lower Timeframe based on the volume per price code made by Nicolas.
Did anyone worked on this already?
Thanks
Chris
Bull & Bear Volume-by-Price levels
Would be interested to code it and made it as an example on how to achieved such things (collecting other timeframes values to trigger orders).
How do you consider finding support and resistance in relation with this indicator? Could you explain the strategy a bit more?
Hi Nicolas,
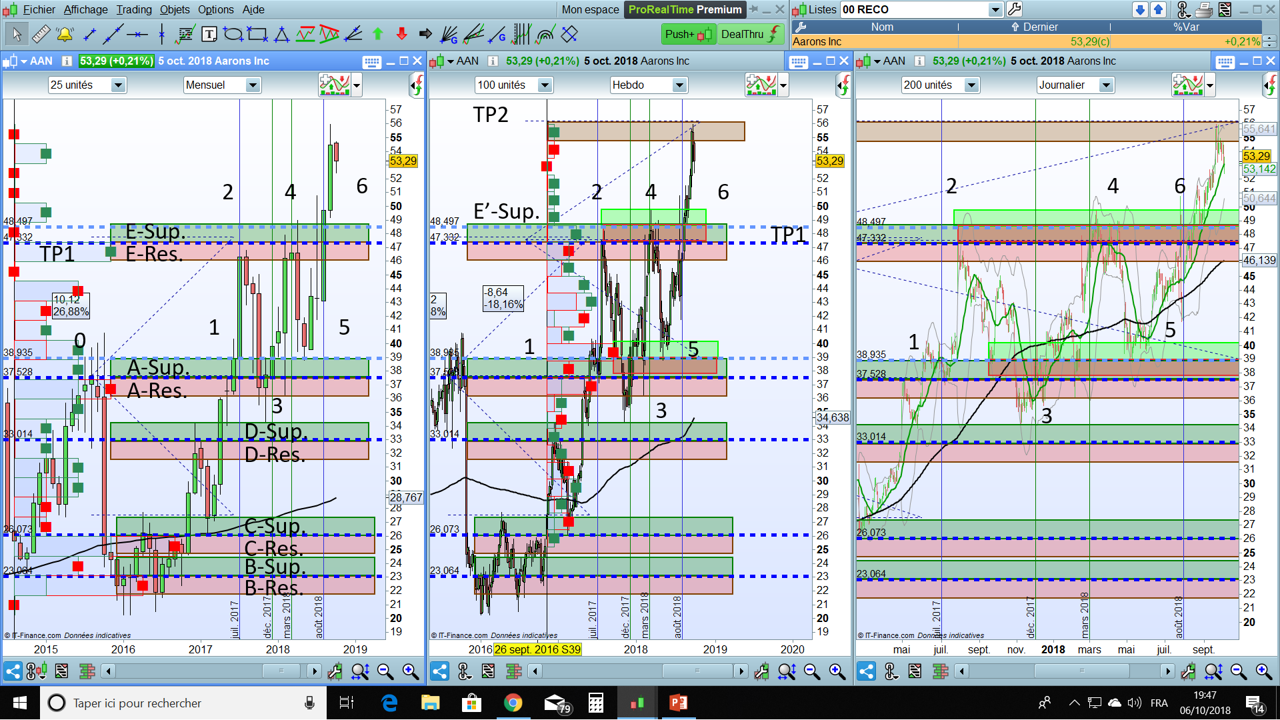
Please find enclosed an image of the sequences of this strategy and hereunder what the strategy would do :
TF Monthly
- indicator : volume-per-price indicator : 12 bars / 50 lookback period for exemple
- the system keeps in store the history of the last resistances and supports based on the “highest-high” in the volume-per-price indicator
- in terms of price : here chronologicaly 37.5 / 23/ 26 /33 (A/B/C/D on the chart)
- in terms of range of the resistance/support, depending on the N° of stripes set in volume per price indicator (to parameterize at will) : here width =3.5%
TF Weekkly : let’s say we are beginning of July 2017
- indicator : volume-per-price indicator : 25 bars / 100 lookback period for exemple
- the former resistance range is succesfully broken at “price 1” and reaches a higher high : “price 2”
- a successful breakout = price closes over the mirror range of the A-Res. = A-Sup. (here Price 0 + 3.5%)
- the system goes long
- sets a SL at the inferior chronological monthly price support /resistance frontier (here 33 €)
- sets a TP (TP1 on the chart) = distance between “Price 0” – “second inferior chronological price support /resistance frontier” (here 26 €)
- this TP1 creates a prospective new resistance frontier 47.76 => 47.332 based on the height of the volume per price boxes (blue line on the chart)
- and a new monthly resistance range = TP1 – 3.5%
TF Daily
- sets a sell order on stoch reversal for exemple or a divergence of MACD daily
TF Weekly : let’s say we are now at the end of July 2017
- the price reverses and make a pivot point
- the systems stores this new high = new resistance (here 48.5)
- creates a new resistance frontier and a new range = E-Res. (here 48.5 – 3.5%)
- the system waits for a confirmation reversal = close crosses under the montly resistance E-Res (here 46)
- goes short
- sets a SL on the superior border of the potential next monthly support (E-Sup)
- sets a TP on the former montly resistance frontier A (37.5)
TF Daily
- sets a exitshort order on stoch reversal for exemple
and so on …
Quite “logicaly” as shown on the chart during the weekly TF, the superior border of the former monthly support becomes a weekly resistance/support frontier
=> If we have been stopped, the system will go back onmarket when a new weekly resistance is crossed over, for exemple during dec 2016 in august 2017 (3 /4 /5 on the chart)
Hope this is clear enough; don’t hesitate
thanks for your expertise Nicolas,
Cheers
Hi Nicolas,
Does it look cadable to you?
Cheers
That’s a lot of information to digest 🙂
But I don’t think you have in mind that all of these levels you described were not the same at the time you consider them to be an entry, a takeprofit or an exit level… Each of the support / resistance level are changing at each new candlestick. Indeed, they do not change a lot after one period, but they were totally not the same 10 bars ago.. The S/R you observed right now were not present in the past. So your strategy description must begin from now (today) and not plotted in the past.
Also, because of the use of a massive loop in the code, I think that you should first test the “bars / lookback” variables couple to know that we are not falling into the infinite loop issue..
Hi Nicolas,
Thanks for your answer and your help;
But I don’t think you have in mind that all of these levels you described were not the same at the time you consider them to be an entry, a takeprofit or an exit level… Each of the support / resistance level are changing at each new candlestick.
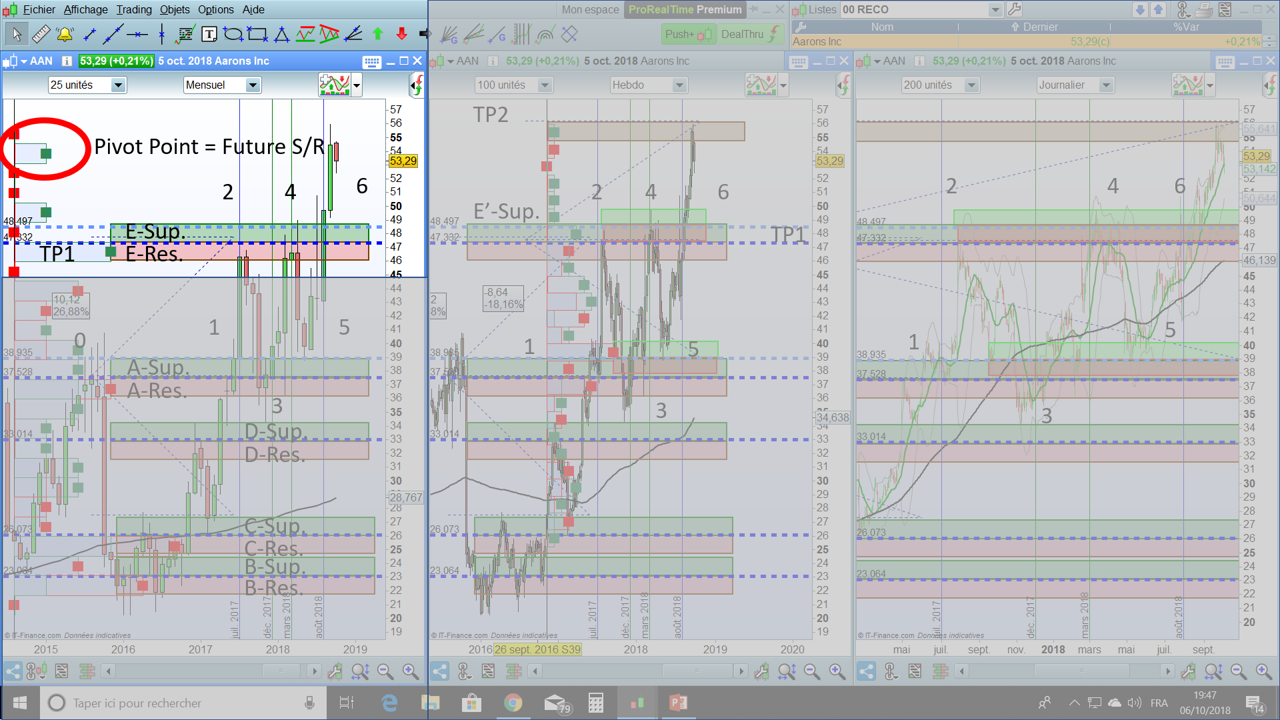
=> Agreed when we are at the entry in 1 for the A Sup/Res as it collects also the volumes of the future ; still the past level B and C of S/R are fixed as the price do not get back to this level
=> so at least we have a major past pivot point in (here in 2016) A and former sup/resistance that can give us future targets, no ?
So if we focus in 6 the pullback announces a potential future pivot = resistance (please check the image) [attachment file=”82352″]
Also, because of the use of a massive loop in the code, I think that you should first test the “bars / lookback” variables couple to know that we are not falling into the infinite loop issue..
=> sorry I don’t understand how I can do that
=> how would you code to return
- the past B and C Sup/Res when you are in 1
- the past pivot point of 2016?
Thanks
Chris
Just add the indicator on your chart and play with the settings to check for the infinite loop or not.
At point 1, the B and C S/R were not so relevant as they are by now (IMO). To check them, and since the indicator is only “graphical” and doesn’t return values, you first need to return all calculated levels (by changing the code). But, we also need first to know how many level you want to be returned (12 by default in the code), as without dynamic arrays, we must know in advance how many variable the indicator should return.
I’m afraid I am touching the limit of my expertise on this ;
At point 1, the B and C S/R were not so relevant as they are by now (IMO).
=> it will allow to give some Take Profit levels
To check them, and since the indicator is only “graphical” and doesn’t return values, you first need to return all calculated levels (by changing the code).
=> that’s the trick to convert the “hrange+div” into levels of support and resistance but I am struggling to code it
But, we also need first to know how many level you want to be returned (12 by default in the code),
=> 4 would be good but I am unable to code this = keeping an history of that
Can you give me some help?
Chris