Hello,
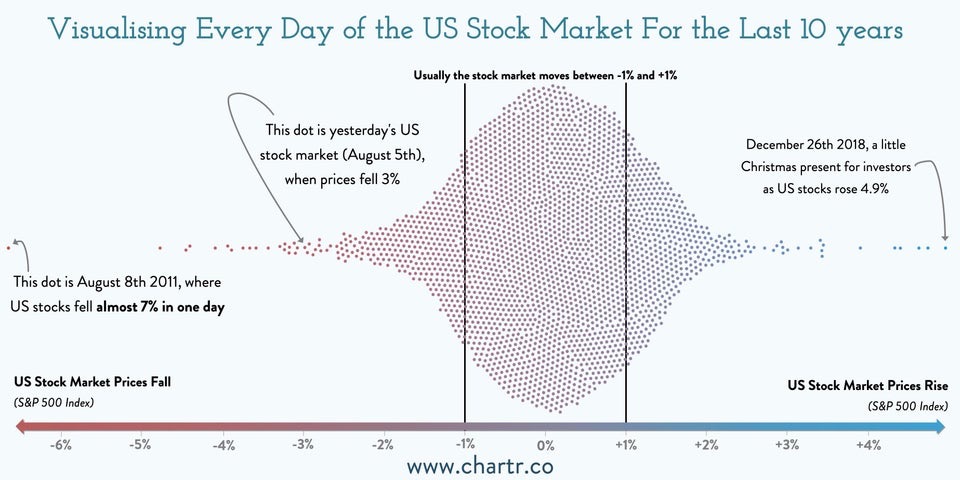
The attached image shows the daily percentage movement of the S&P 500 over the last 10 years.
Someone can help me create an indicator, similar to the pivot point and its SDs, that would indicate the levels on a daily basis: +1%, +2, +3%, -1%, 2% and -3%.
Ideally, an indicator, also similar to the pivot point, would be created that would indicate the standard deviations (annualized) of daily return: 1, +2 and +3 standard deviations and -1, – 2 and -3 standard deviations:
https://blogs.cfainstitute.org/investor/2012/08/27/fact-file-sp-500s-sigma-events/
Thank you.
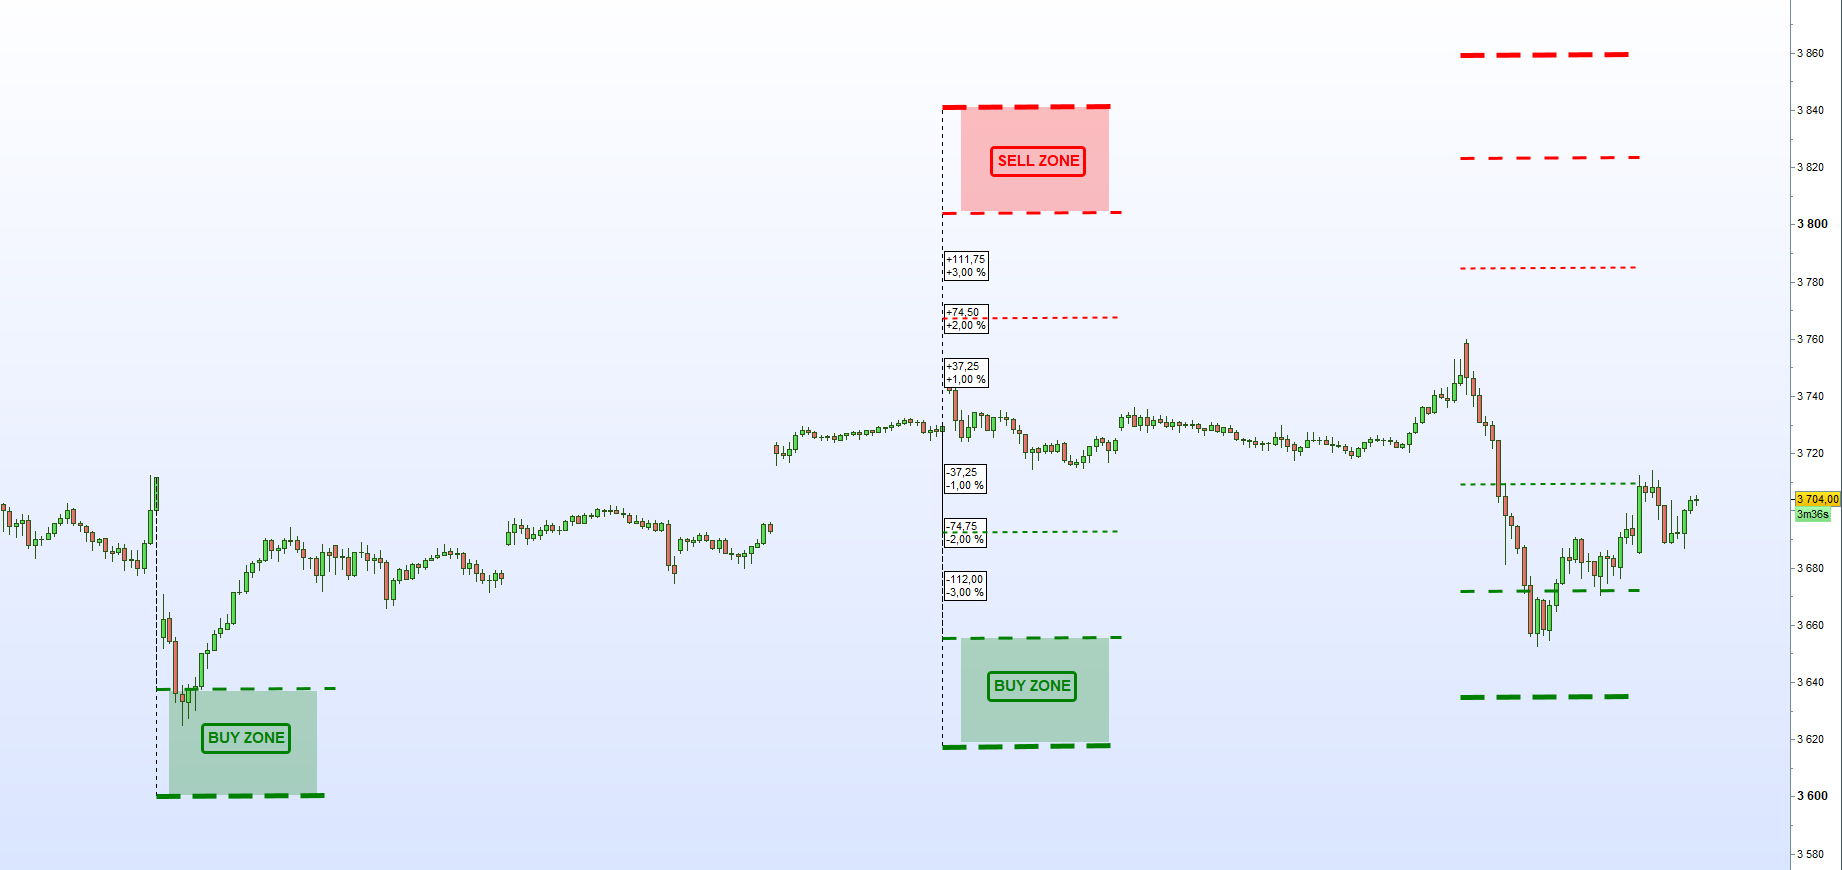
Here’s a picture that shows what I want:
lines that are +/-1%, +/- 2% and +/-3% of the previous day’s close.
No need to color the buying and selling areas, just to have an indicator with lines similar to the pivot points.
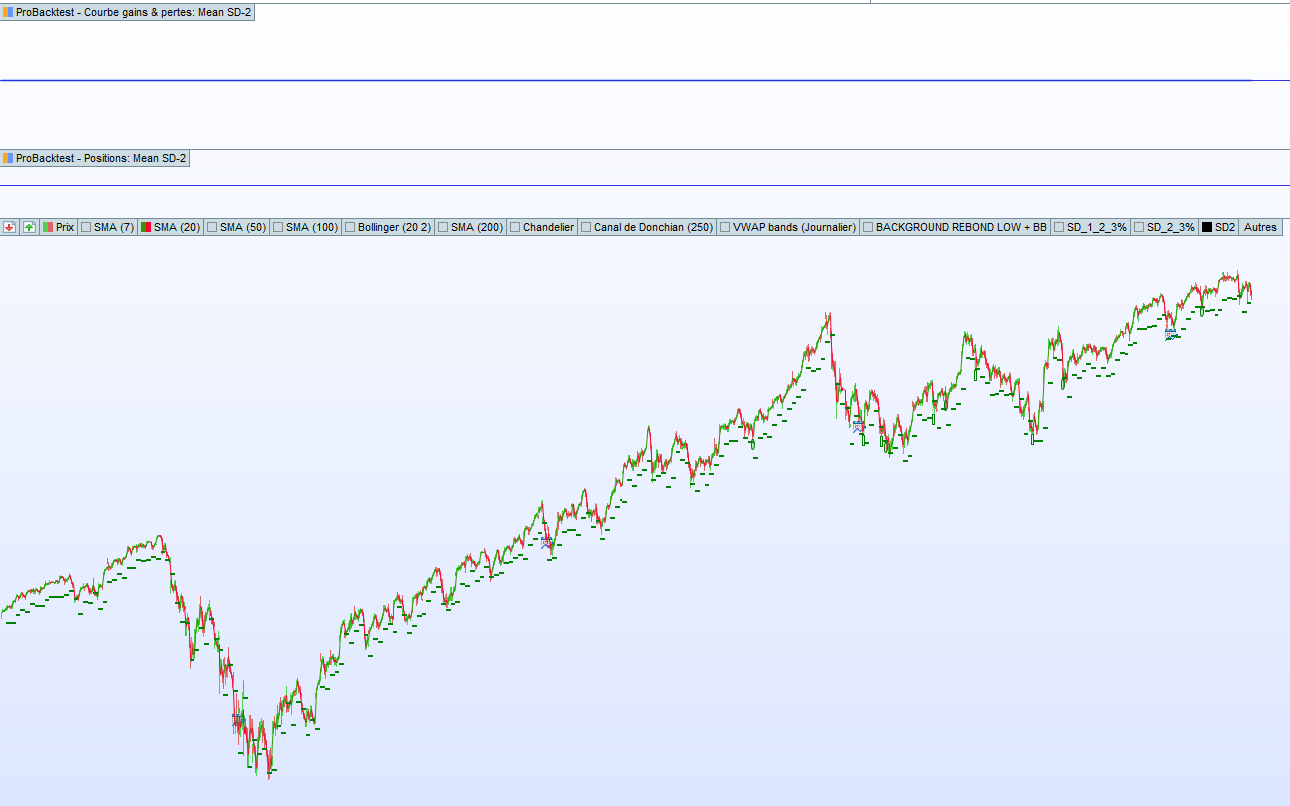
Something like this?
if opendayofweek <> opendayofweek[1] then
perc1 = close[1]*1.01
perc2 = close[1]*1.02
perc3 = close[1]*1.03
percd1 = close[1]*0.99
percd2 = close[1]*0.98
percd3 = close[1]*0.97
endif

drawsegment(barindex,perc1,barindex+1,perc1) coloured(0,128,0) style(dottedline,1)
drawsegment(barindex,perc2,barindex+1,perc2) coloured(0,128,0) style(dottedline,2)
drawsegment(barindex,perc3,barindex+1,perc3) coloured(0,128,0) style(dottedline,3)
drawsegment(barindex,percd1,barindex+1,percd1) coloured(128,0,0) style(dottedline,1)
drawsegment(barindex,percd2,barindex+1,percd2) coloured(128,0,0) style(dottedline,2)
drawsegment(barindex,percd3,barindex+1,percd3) coloured(128,0,0) style(dottedline,3)

return
So, roughly, that’s the standard deviation of an “all time” average of the SP500?
I just coded simple percentage of yesterdays closing price as that is what the second post described and showed in the image.
Yes, that’s exactly it! Thank you very much.
Is it possible to create the same indicator but this time using 1, 2 and 3 standard deviations ?
The most commonly used calculation method is the standard deviations annualized of daily return.
It would be ideal to have such an indicator because it would indicate the levels used by many mean reversion algorithms.
But if it’s too difficult to program with PRT it will be easier to create an indicator with standard deviations of daily returns that takes into account the days displayed on the graph (as on your post).
Hello Nicolas. Not necessarily “all time” because the markets are much more volatile these last decades.
The most commonly used calculation method is the standard deviations annualized of daily return.
But if this is too difficult to program with PRT, an indicator with standard deviations of daily returns that take into account the days displayed on the chart is a good alternative.
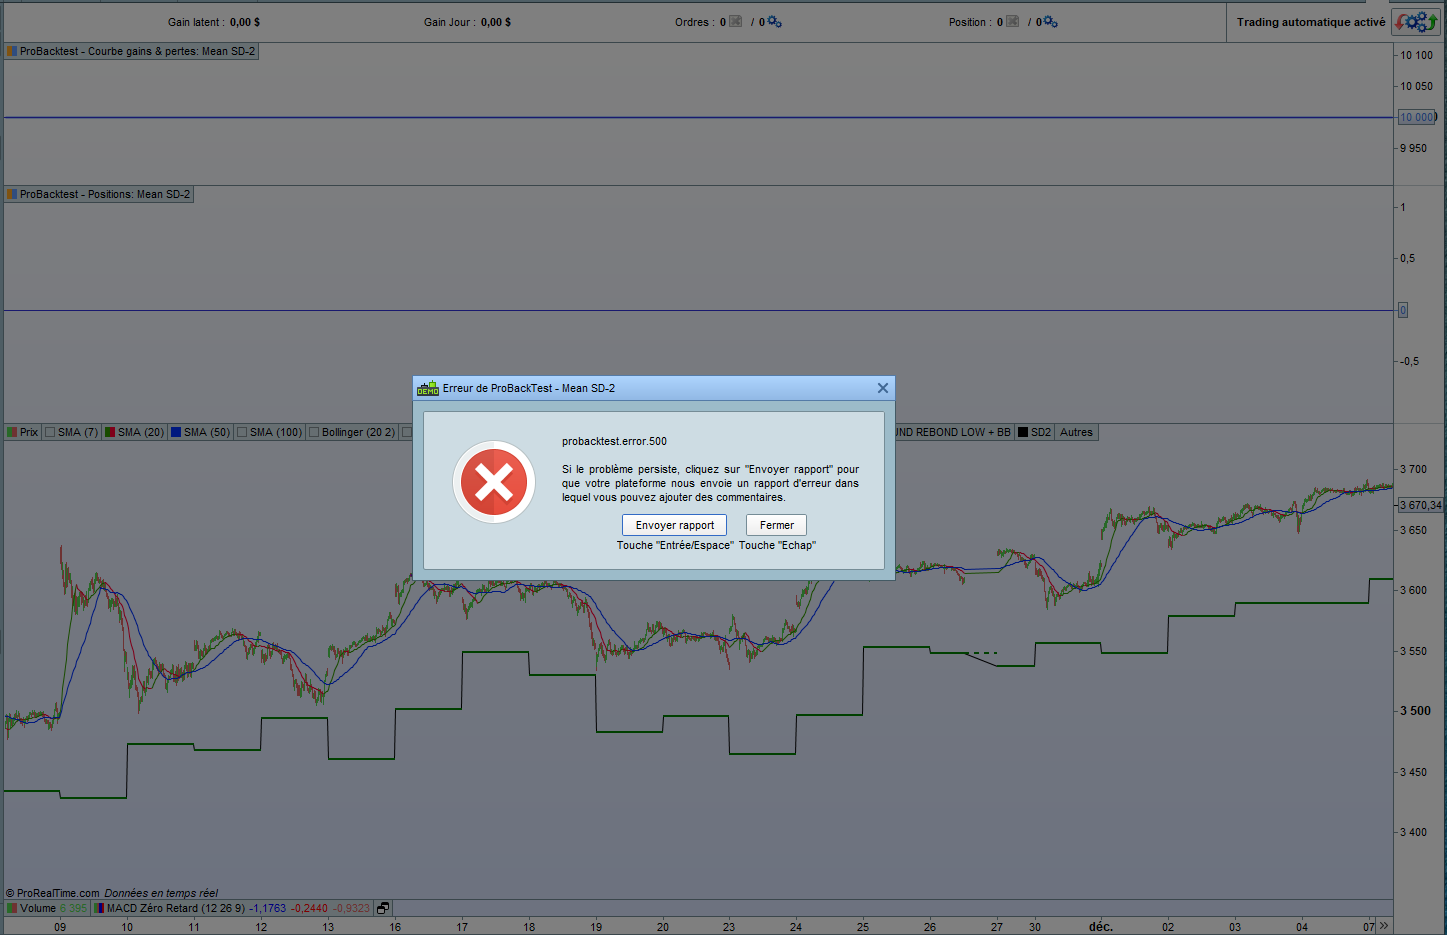
Hello @Vonasi, I can’t call the indicator to use it in an algorithm.
The idea is to buy when the price has rebounded close to the -2% level.
I created a simplified version of the indicator with only this -2% level:
if opendayofweek <> opendayofweek[1] then
percd2 = close[1]*0.98

endif

drawsegment(barindex,percd2,barindex+1,percd2) coloured(0,128,0) style(dottedline,2)
return
Mais lorsque je lance le backtest de l’algo, aucuns trades ne ressort :
DEFPARAM Cumulateorders = False

// Conditions pour ouvrir une position acheteuse

StandardDeviation = Call "SD2"

c1 = low[1] < StandardDeviation[1]

c2 = close > StandardDeviation

ConditionsAchat = C1 AND C2

IF NOT LongOnMarket AND ConditionsAchat THEN
BUY 1 CONTRACTS AT MARKET
ENDIF

// Conditions pour fermer une position acheteuse

C3 = close >= Average[20](close)

ConditionsCloseAchat = C3

If LongOnMarket AND ConditionsCloseAchat THEN
SELL AT MARKET
ENDIF
Can you help me find the error?
Annualized Standard Deviation = Standard Deviation of Daily Returns * Square Root (250)
//Annualized Standard Deviation = Standard Deviation of Daily Returns * Square Root (250)
//you can change the observed period with "period" setting below:
period = 200
a=std[period](variation)*sqrt(250)
return a as "annualized STD of a given period"
Surely the SQRT(250) relates to 52 times 5 candle weeks minus holidays? On PRT’s 6 candle weeks something like 302 would be more accurate? Or perhaps we could use something like my days in year calculator from here:
How many bars in a year indicator
I can’t call the indicator to use it in an algorithm.
Your indicator does not return a value to be used in the strategy – it just draws a segment.
Thank you @Vonasi. I modified the last line of the indicator in several ways:
return percd2

return percd2 as "SD2"

return percd2 as "SD2", to as "0"
There has been a change with a line that connects each daily segment.
But on the other hand there is still no result when I run the algorithm.
There is even an error report that is displayed at the end of the backtest regardless of the final line.
Do you know how to return the result that will be taken into account by the algorithm?
Line 5 :
return percd2 as "SD2", 0 as "0"