@Bard
These are the kind of divergences / convergences found by the indicator you post, are you sure they are valid? Do you find them useful? Sorry, but I’m a bit perplex and I don’t have the same feeling (and deep understanding) as you for these tools 😉
 Bard
BardParticipant
Master
It’s too early to say as this Kase Peak Oscillator is one of three indicators. I think though after reading so much of Kase’s work and her book the Trading with the Odds and articles on the net like the Two Faces of Momentum, that this former engineer, turned oil and gas trader (amongst other asset classes), has a rigorous discipline and built these indicators because of the failures with so many of the non cyclical and non logarithmic based indicators that come as standard in many chart software packages. Did you get a chance to read the “the Two Faces of Momentum” research? It’s well worth it I think. I also think once the Kase Convergence / Divergence and Permissions Histogram indicators are added then a clearer picture will be gained as to why she had the confidence to take multi million $ trades based on these indicators, (along with some Elliot Wave theory). Hope that helps?
Hi,
First of all, thanks to all the contributors on this subject. Looks very interresting and promising.
I am far from being specialist but my understanding is that Kase is using :
- Kase Easy Entry System (KEES) to open new positions
- Kase PO and Kase CD to exit positions
- (Kase DevStops to manage risks)
In that perspective KEES would be missing here (and I have no idea if it can be coded and how).
Anyway, all the job acomplished already is great and I will be waiting for KaseCD at first.
Big Thanks !
https://youtu.be/YQLIE63nqis
Wow yeah that looks a more rounded system with all the bells and whistles.
Still doesn’t leap out at me which of the Kase Indicators flags up divergence even when the video points out the divergent bar!? I need to watch again! 🙂
PS got it 2nd time … bar is a lower low, but the lower histo forms a higher low (line up the long red oblique line from the Price Chart to the lower histo) … subtle though isn’t it?
 Kit
KitParticipant
Junior
Hi Nicolas
It so happens that I have been researching the Kase Statware suite of trading indicators, so read with interest the work you and Bard have been doing on the topic. For your information the following videos might be helpful in understanding the application of the suite:
Kase Statware webinars by partner platforms
for Bloomberg (a good short intro)
https://www.youtube.com/watch?v=RiYMYzG2A2k
for eSignal (Part 2 of a 3 part series)
https://www.youtube.com/watch?v=cd2gK8179u8
for NinjaTrader (the 1st one I watched so found it very informative)
https://www.youtube.com/watch?v=wftW8DAYtVA
Also the CQG platform user manual for Kase Statware (attached) may be useful.
Kit
KitParticipant
Junior
Hi Nicolas
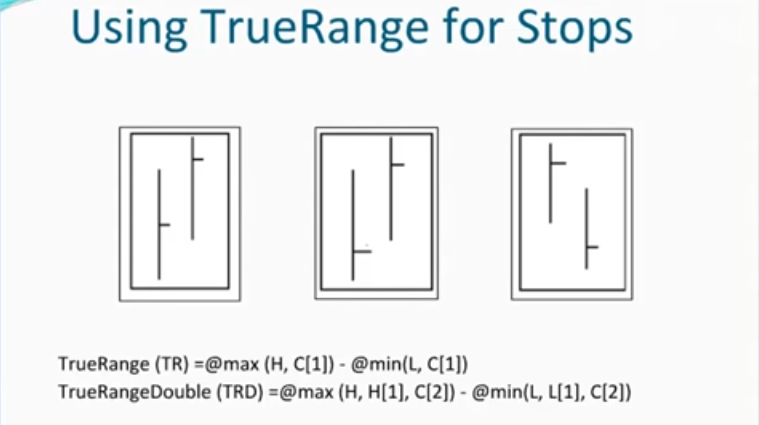
Looking at your coding for the Kase DevStops I note the differences to the Kase definition for True Range Double (TRD), which is an extension of the principles on which True Range is based. Found in the webinar for NinjaTrader platform:
https://www.youtube.com/watch?v=wftW8DAYtVA
See diagram attached below.
In PRT code:
TRD=max(max(High,High[1]),Close[2])-min(min(Low,Low[1]),Close[2])
The length of the period over which averages and STD are calculated seems to be recommended by Kase at 30 (see page 3.15 of the CQG platform manual attached to my earlier post).
Kit
BardParticipant
Master
Hi Kit,
Here’s a good 12 minute YouTube overview for the Kase KEES Entry signal system that looks for shorter term time frames (daily) to be also confirmed with longer term time frames (weekly) thereby giving a confirmed signal as compared to a warning signal when the daily signal may be contrary to the longer term weekly signal.
In essence you would not trade the daily warning signal until a longer term time frame confirmation. As yet I have not come across any coding for this Entry Signal system. I believe the KEES has been updated to KCCSS (Kase Color Coded Support System) as per your CQG manual post above.
https://www.youtube.com/watch?v=083-7w_Rxtw
Best
Bard
@Kit
Thanks for the document, it is well explained and clear 🙂 I did not have time already to look at KCD, but its conversion would be challenging I think..
BardParticipant
Master
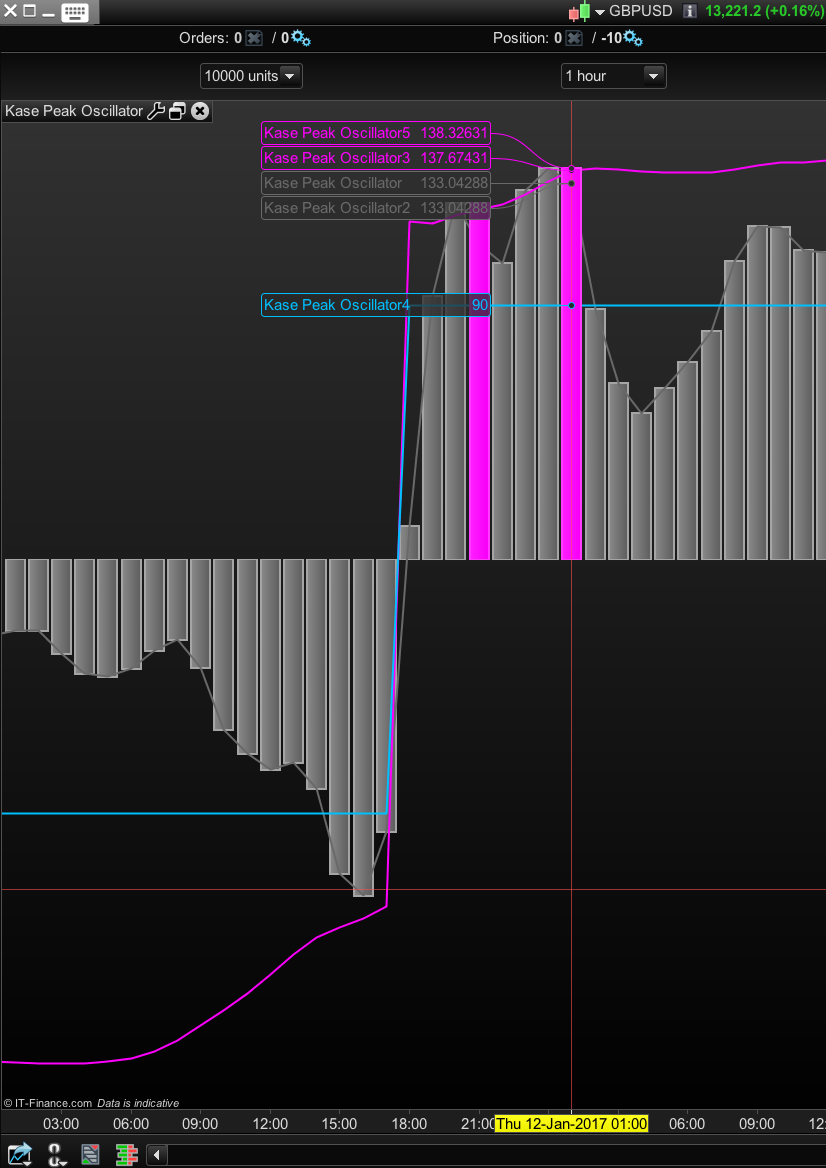
I’ve been looking at the Kase PO on the £/$. Peak Outs (PO) with just this single indicator (as opposed to having the Permissions and Convergence / Divergence indicators as well) are sometimes very good signals, sometimes not… although spotting divergences on the histogram relative to high/lows on the price chart are also a good way to also use this PO indicator.
One thing I can’t figure out is how to use the Easy Assist programming tool to actually signify when a Pink histogram bar has been drawn within the histogram itself. How would you program it, so for example, if you saw a positive pink bar, a short trade could then be entered? The Oscillator 5 either tends to be zero or reverts to some high value when there is a pink bar drawn denoting a Peak Out. Pls see screenshot.
Cheers
Bard
BardParticipant
Master
P.s./ I think it looks like you have to set Oscillator 5 to be > zero for a Pink bar Peak Out.
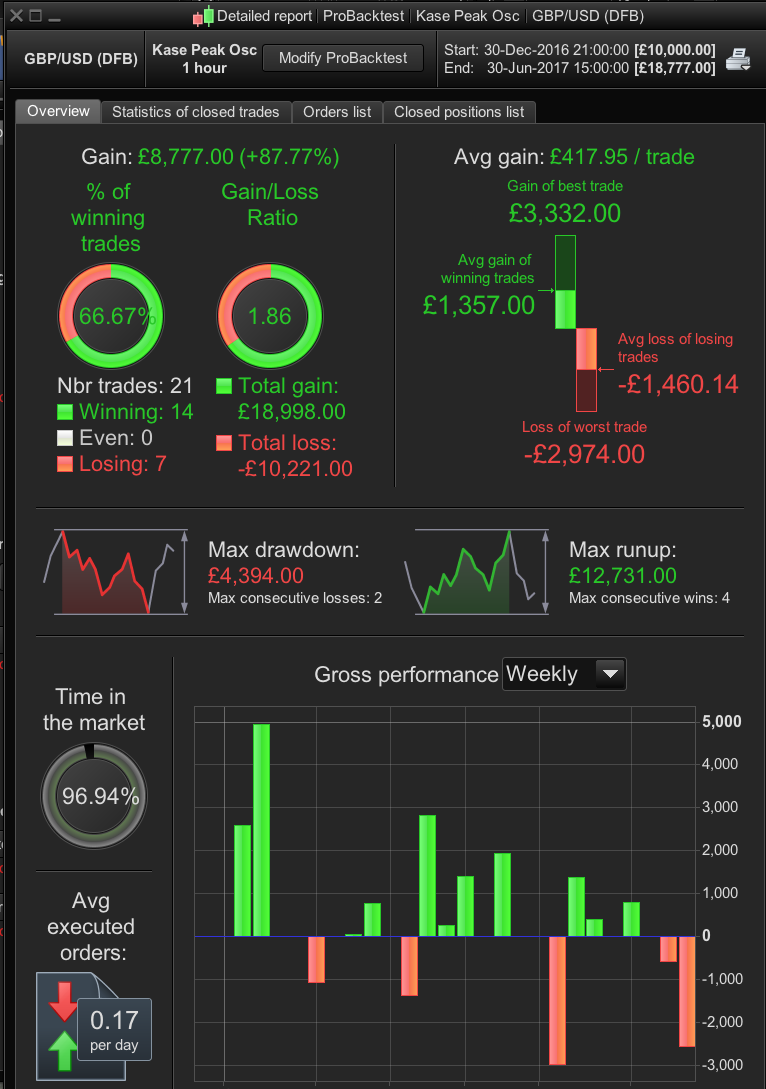
Results: (no optimisation or any other trading criteria added)
£/$, 1 Hour, 30th Dec 2017 to 30th June 2017
87% gain / 23% Drawdown 9but only 21 trades…)
// Definition of code parameters
DEFPARAM CumulateOrders = False // Cumulating positions deactivated

// Conditions to enter long positions
ignored, ignored, ignored, ignored, indicator1 = CALL "Kase Peak Oscillator"
c1 = (indicator1 < 0)

IF c1 THEN
BUY 10 PERPOINT AT MARKET
ENDIF

// Conditions to enter short positions
ignored, ignored, ignored, ignored, indicator2 = CALL "Kase Peak Oscillator"
c2 = (indicator2 > 0)

IF c2 THEN
SELLSHORT 10 PERPOINT AT MARKET
ENDIF
BardParticipant
Master
Hi @Nicolas, Can you define a way to make a system buy and sell straight after a pink bar peak out occurs on the histogram?
I thought (incorrectly) that I had defined it above by using oscillator #5 being > or < than 0 but that doesn’t work.
Cheers
Bard
BardParticipant
Master
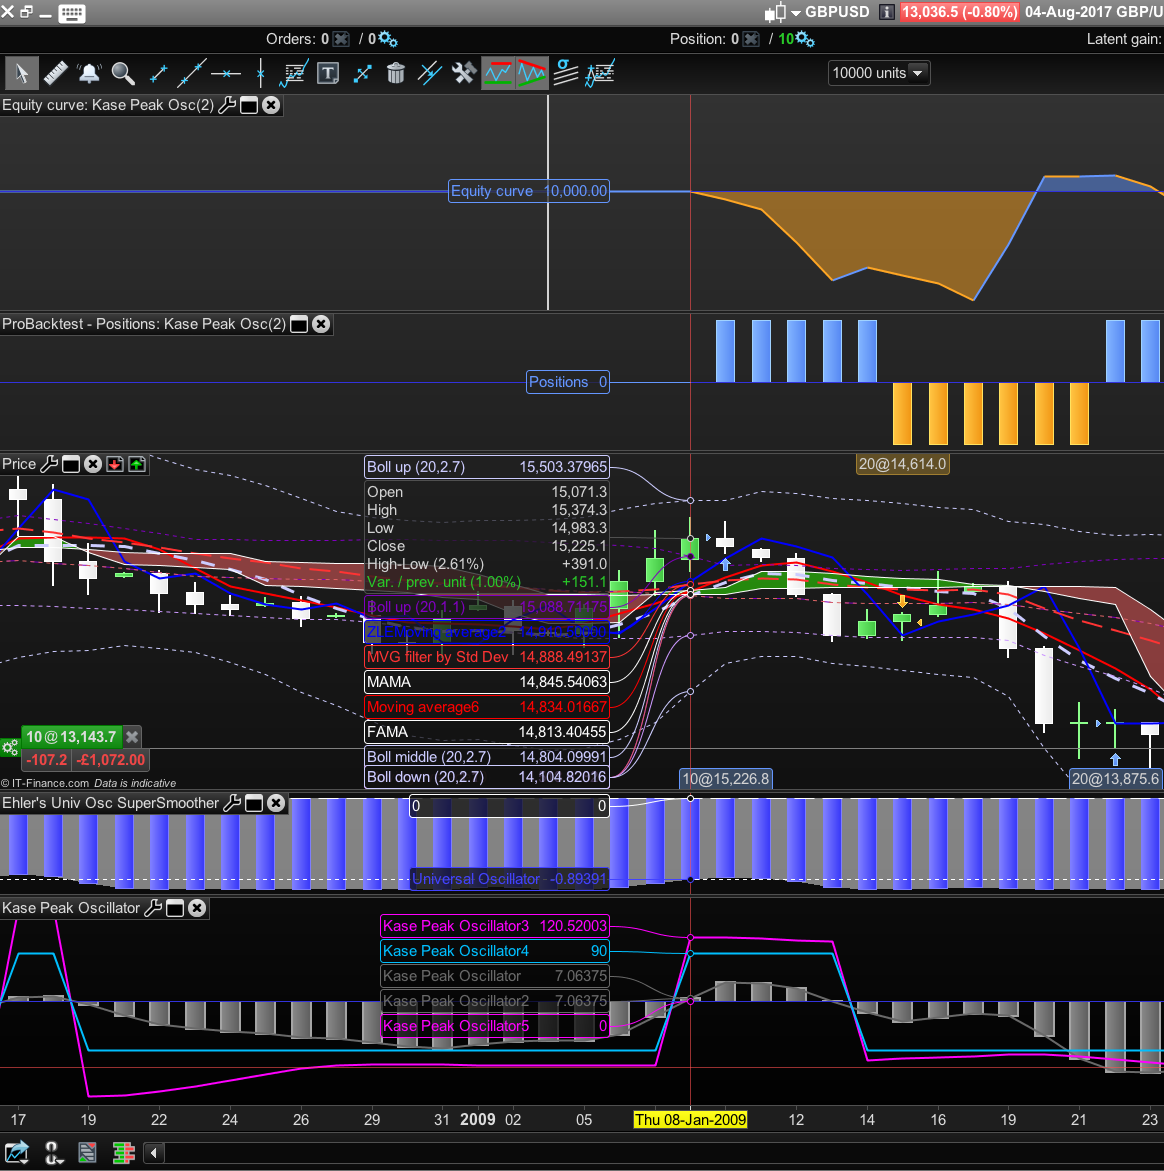
Ps/ Also, I’m not sure how can Oscillator #1 (Grey Histogram) be deemed to have Crossed Under Osc #3 (Pink Line) in this screenshot for a Long trade to be taken? (It looks more like Osc #1 has crossed over Osc #3)
£/$ DFB Daily, Jan 4th 2009 – Dec 1st 2015 — 3.8 tic spread.
// Definition of code parameters
DEFPARAM CumulateOrders = False // Cumulating positions deactivated

// Conditions to enter long positions
indicator1, ignored, indicator2, ignored, ignored = CALL "Kase Peak Oscillator"
c1 = (indicator1 CROSSES UNDER indicator2) //Osc 1 Crosses Under Osc 3 Pink line

IF c1  THEN
BUY 10 PERPOINT AT MARKET
ENDIF

// Conditions to enter short positions
indicator5, ignored, indicator6, ignored, ignored = CALL "Kase Peak Oscillator"
c3 = (indicator5 CROSSES OVER indicator6)

IF c3 THEN
SELLSHORT 10 PERPOINT AT MARKET
ENDIF
Hi Bard, I copy/paste the message you sent me in your recent library post about Kase KRev Amounts, in order to separate the discussions and keep thing tidy.
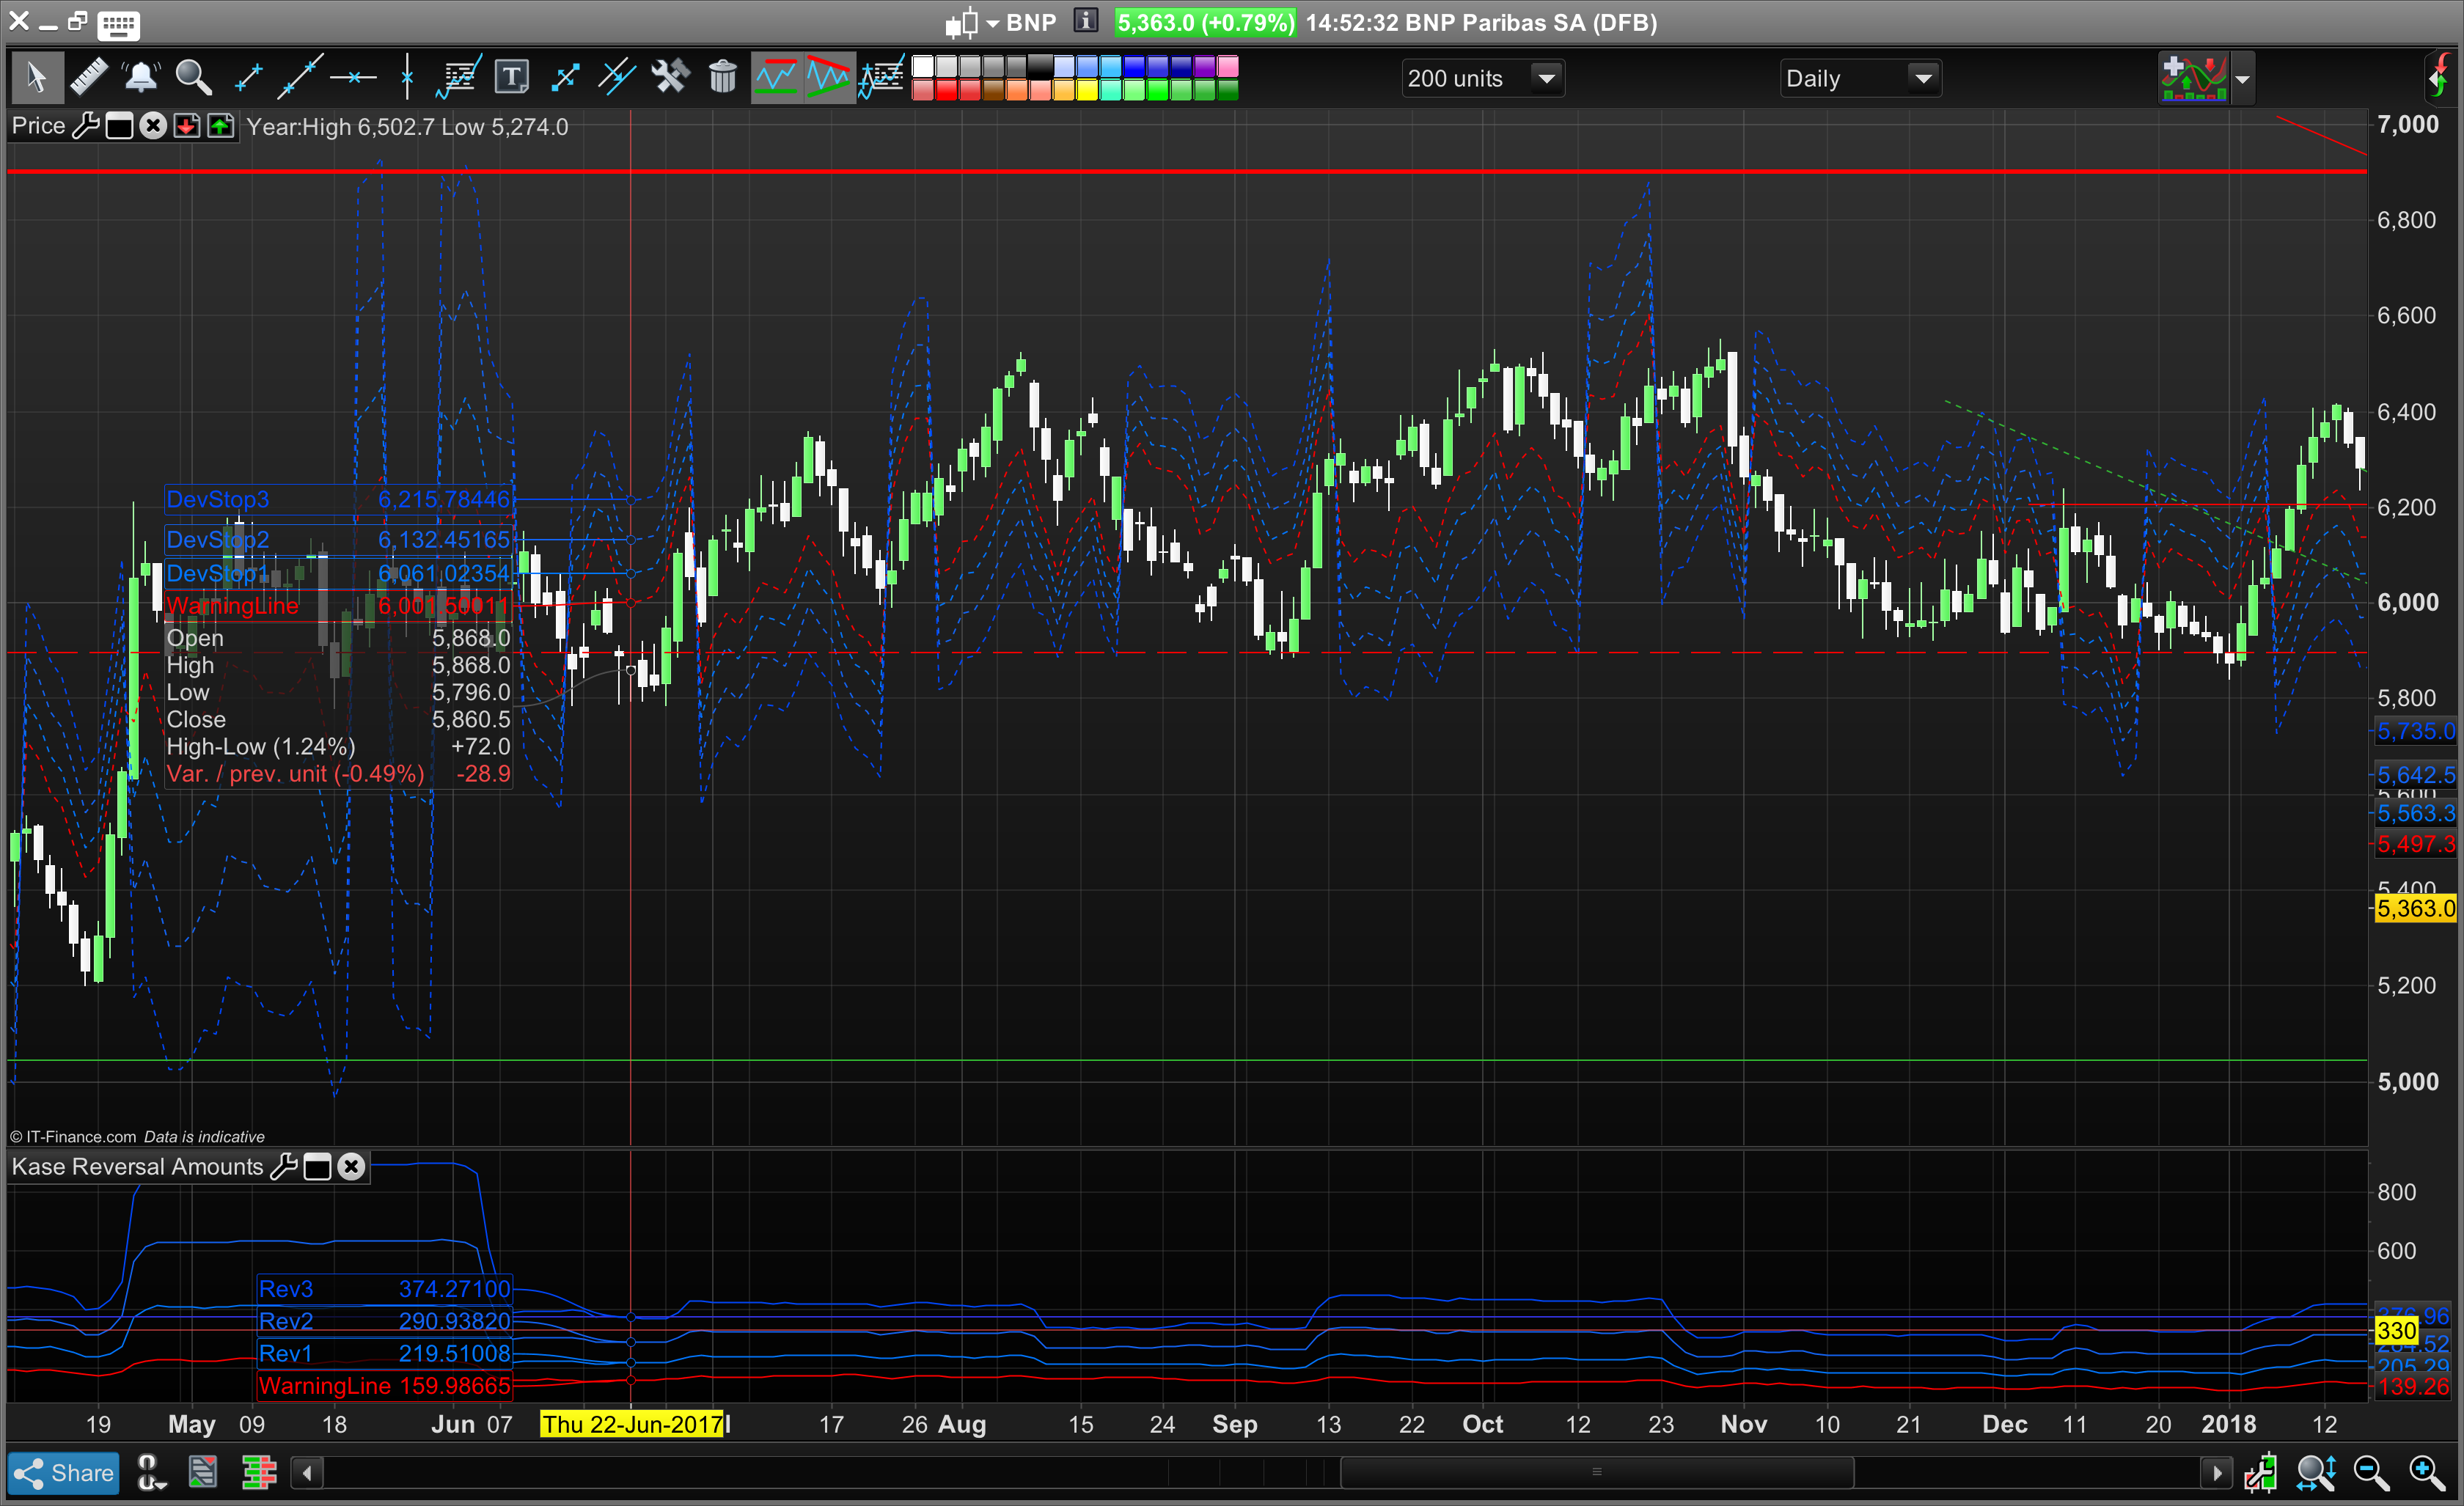
Re: Kase Dev Stops,
Hello @nicolas, how are you? If I’m not mistaken the Kase Dev Stops code here on PRC seems to mean that the price never/rarely hits either the warning line or the 3 separate Dev Stops (unless a moving average flip has occurred) and regardless of what moving average values are used to flip the Dev Stops above or below price. I found this code here: https://www.mql5.com/en/code/19926
I wonder if you could take another look at it? I’ve attached two screenshots from a Kase presentation on YouTube: At some points the candlesticks hit the Dev Stops, even closing beyond Dev Stop 3 on a few instances – this is the signal to get out.
An important point about the moving averages that determine whether Kase’s Dev Stops are above or below the price: The moving average crossovers used should be changed to a faster cross if you have entered a position and the 5 and 21 day cross has not reflected the direction of your trade. I.e. change the averages to a 3 and 8 day moving average cross over (or whatever is suitable) so that the Kase Dev Stops are on the correct side (above or below) of your position.
See: Kase Chat – Stops and Kase DevStops (around the 21 min mark) https://www.youtube.com/watch?v=u8pFuM2TNfA
BardParticipant
Master
Thank Nicolas,
Yes the message to you was in need of separating out from the KRev Amounts indicator post, although the bit about the moving averages crossovers can stay on the indicator post, if you’d like to repost that part? (I did add a comment today mentioning the issue of what moving averages to use to help people, as it took me a while of going through lots of Kase StatWare videos to figure that out).
Also is there any chance you can use this image posted below for the KRev indicator and delete the original uploaded and very cluttered image! (with lots of indicators)? Cheers.
Lastly is the issue about the Kase Dev Stops and the price bars never reaching the Warning Line or the 3 Kase Dev Stops, something you’d like to take a look at or should I post that pasticular comment with example images on the Dev Stop indicator library page and see if anyone else can figure it out?
Many thanks,
Best
Bard
BardParticipant
Master
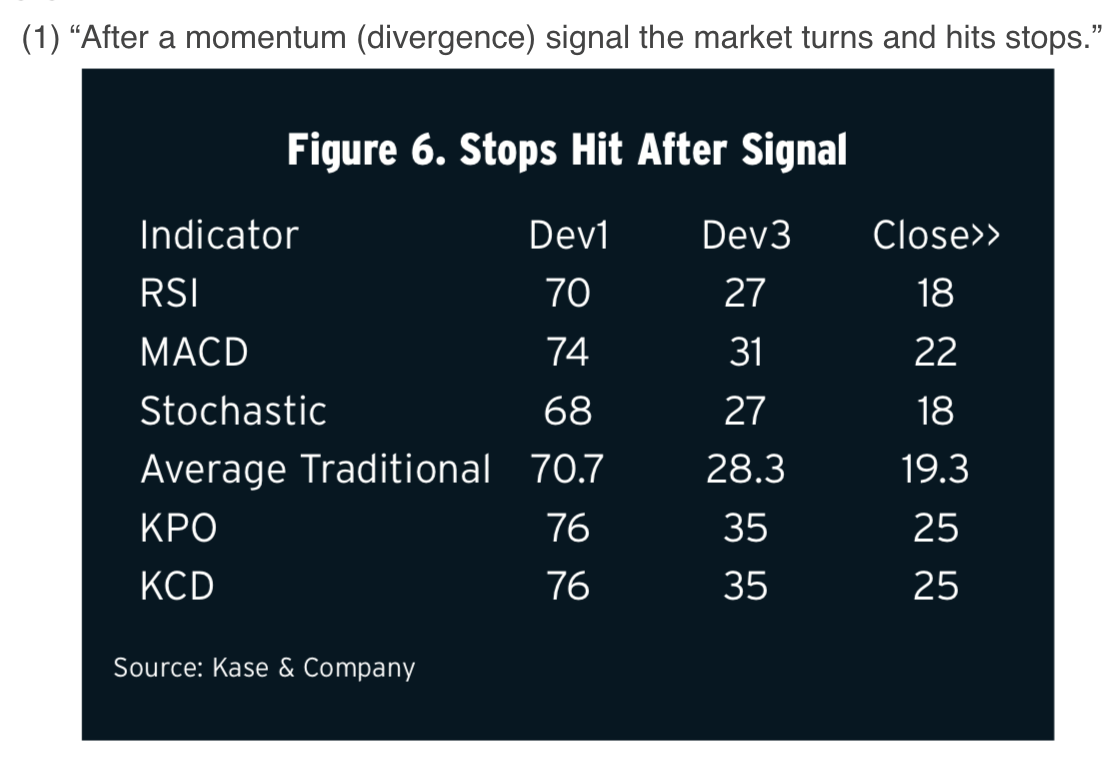
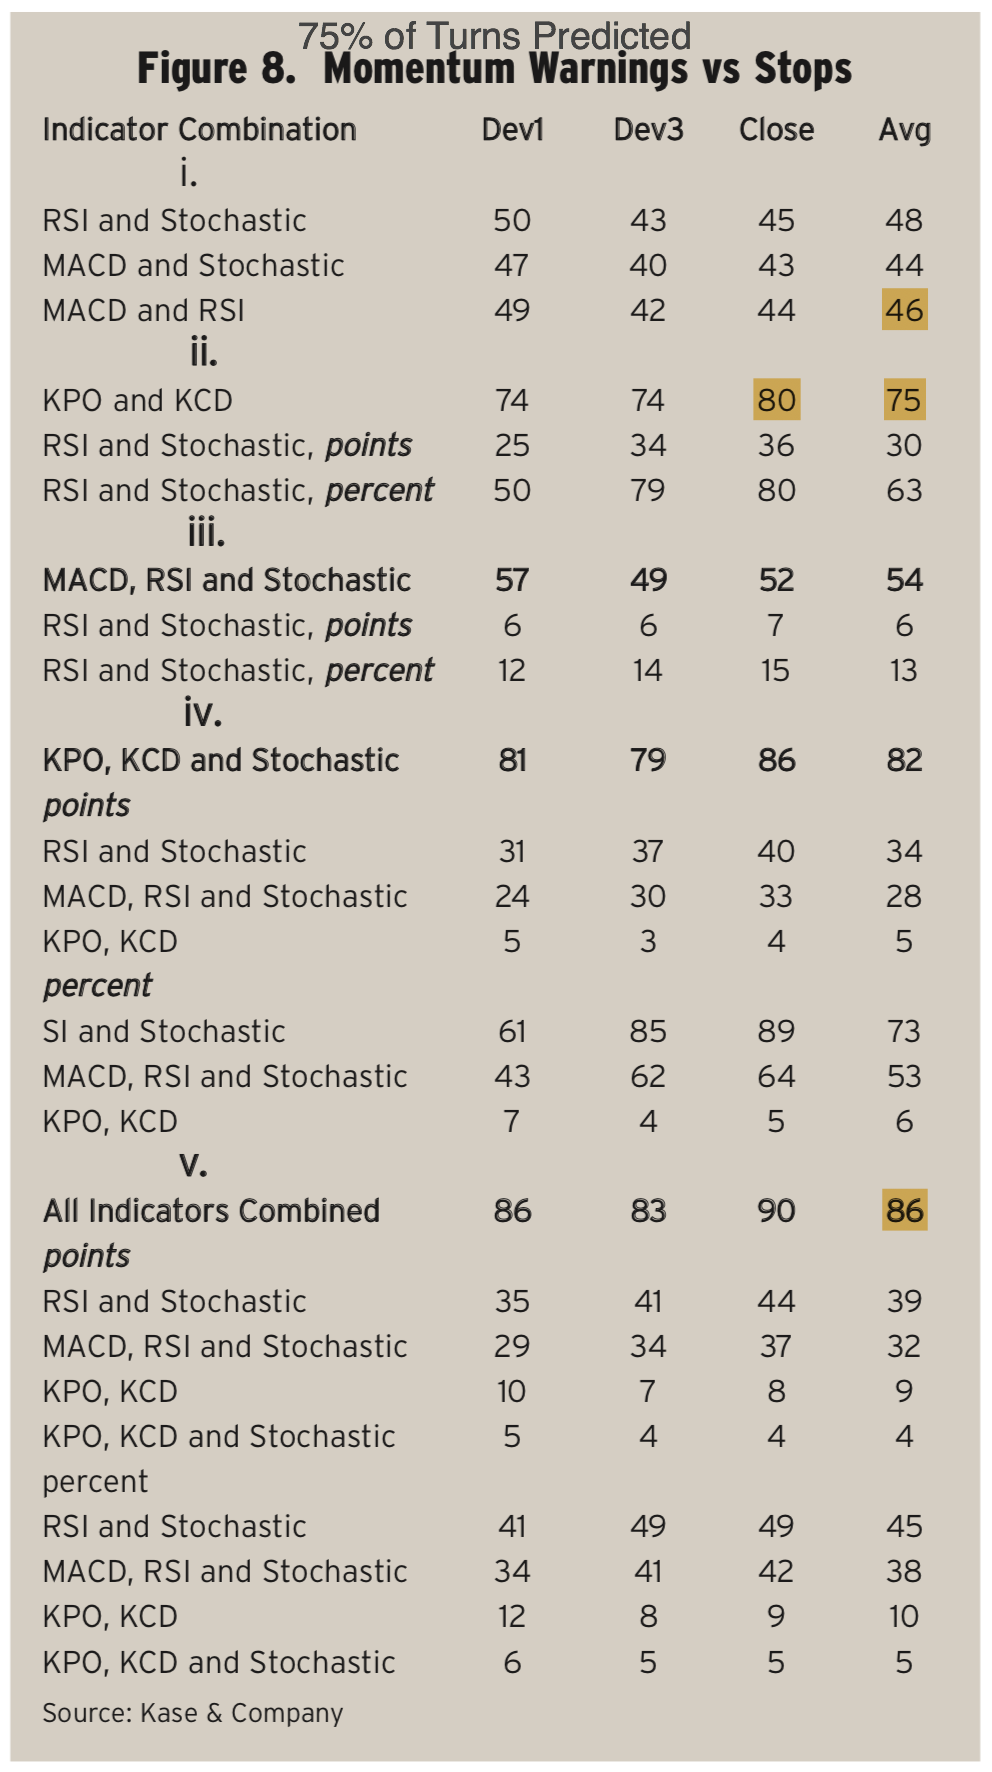
Here is the statistical evidence of the power of the Kase Peak Oscillator and the Kase Convergence / Divergence indicator when combined together, compared to the traditional MACD, Oscillator and RSI indicators.
“The second group (see second screenshot “75% of Turns Predicted”), which pairs the two Kase indicators, shows a marked improvement with an average of 75% of the turns predicted. It is also interesting to see that the performance improves as the size of the turn increases, rising from 74% at Dev1 to 80% for closes beyond Dev3. Comparing the Kase indicators against the best pair of traditional indicators, the RSI and Stochastic, performance improved by 27 points or over 55%.”
http://www.kaseco.com/support/articles/Proof_That_Technical_Analysis_Really_Works.pdf
If there is anyone with the time/skills to program the Kase CD indicator so that is can be used with the Kase Peak Oscillators, that’d be great? They are superior indicators.
Cheers
Bard