Expert Services

No recent search

Kase Peak Oscillator, Kase CD and Kase Permission
- Forums
- ProRealTime English Forum
- ProBuilder: Indicators & Custom Tools
- Kase Peak Oscillator, Kase CD and Kase Permission
-
AuthorPosts
-
Hi Nicolas, here’s the original code: All credit goes to the coding skills of Mladen at the Forex TSD Forum.
There are 3 parts to Kase’s way of determining mkt turning points with 85% accuracy. See the Two Faces of Momentum pdf on the net.
1) Kase Peak Oscillator
2) Kase CD (Convergence/Divergence)
3) Kase Permission Screen:
(i) Original Kase Permission Histogram
(ii) Modified Forum Version of the Histogram
(iii) a Forum Modified Stochastic version
======================================================================================================
1) Kase Peak Oscillator
//Kase Peak Oscillator//
#property indicator_separate_window
#property indicator_buffers 5
#property indicator_color1 clrDimGray
#property indicator_color2 clrDimGray
#property indicator_color3 clrMagenta
#property indicator_color4 clrDeepSkyBlue
#property indicator_color5 clrMagenta
#property indicator_width3 2
#property indicator_width4 2
#property indicator_width5 2
#property strict
//
//
extern ENUM_TIMEFRAMES TimeFrame = PERIOD_CURRENT; // Time frame to use
extern double kpoDeviations = 2.0; // Kase peak oscillator deviations
extern int kpoShortCycle = 8; // Kase peak oscillator short cycle
extern int kpoLongCycle = 65; // Kase peak oscillator long cycle
extern double kpoSensitivity = 40; // Kase peak oscillator sensitivity
extern bool allPeaksMode = false; // Show all peaks?
extern bool Interpolate = true; // Interpolate in multi time frame mode?
//
//
double kphBuffer[];
double kpoBuffer[];
double kpdBuffer[];
double kpmBuffer[];
double kppBuffer[];
string indicatorFileName;
bool returnBars;
//
//
int init()
{
SetIndexBuffer(0,kphBuffer); SetIndexStyle(0,DRAW_HISTOGRAM);
SetIndexBuffer(1,kpoBuffer);
SetIndexBuffer(2,kpdBuffer);
SetIndexBuffer(3,kpmBuffer);
SetIndexBuffer(4,kppBuffer); SetIndexStyle(4,DRAW_HISTOGRAM);
//
indicatorFileName = WindowExpertName();
returnBars = (TimeFrame==-99);
TimeFrame = MathMax(TimeFrame,_Period);
IndicatorShortName(timeFrameToString(TimeFrame)+” Kase peak oscillator (“+(string)kpoDeviations+”,”+(string)kpoShortCycle+”,”+(string)kpoLongCycle+”,”+(string)kpoSensitivity+”)”);
return(0);
}
int deinit() { return(0); }
//
//
double wrkBuffer[][6];
#define ccLog 0
#define ccDev 1
#define x1 2
#define xs 3
#define xp 4
#define xpAbs 5
int start()
{
int counted_bars=IndicatorCounted();
if(counted_bars<0) return(-1);
if(counted_bars>0) counted_bars–;
int limit = MathMin(Bars-counted_bars,Bars-2);
if (returnBars) { kphBuffer[0] = MathMin(limit+1,Bars-1); return(0); }
//
//
if (TimeFrame == Period())
{
if (ArrayRange(wrkBuffer,0) != Bars) ArrayResize(wrkBuffer,Bars);
for(int i=limit,r=Bars-i-1; i>=0; i–,r++)
{
wrkBuffer[r][x1] = wrkBuffer[r-1][x1];
wrkBuffer[r][xs] = wrkBuffer[r-1][xs];
wrkBuffer[r][ccLog] = MathLog(Close[i]/Close[i+1]);
wrkBuffer[r][ccDev] = iDeviation(ccLog,9,r);
//
//
double avg = iSma(ccDev,30,r);
if (avg>0)
{
double max1 = 0;
double maxs = 0;
for (int k=kpoShortCycle; k<kpoLongCycle && (i+k)<Bars; k++)
{
max1 = MathMax(MathLog(High[i]/Low[i+k])/MathSqrt(k),max1);
maxs = MathMax(MathLog(High[i+k]/Low[i])/MathSqrt(k),maxs);
}
wrkBuffer[r][x1] = max1/avg;
wrkBuffer[r][xs] = maxs/avg;
}
wrkBuffer[r][xp] = kpoSensitivity*(iSma(x1,3,r)-iSma(xs,3,r));
wrkBuffer[r][xpAbs] = MathAbs(wrkBuffer[r][xp]);
//
//
kppBuffer[i+1] = EMPTY_VALUE;
kpoBuffer[i] = wrkBuffer[r][xp];
kphBuffer[i] = wrkBuffer[r][xp];
double tmpVal = iSma(xpAbs,50,r)+kpoDeviations*(iDeviation(xpAbs,50,r));
double maxVal = MathMax(90.0,tmpVal);
double minVal = MathMin(90.0,tmpVal);
if (kpoBuffer[i] > 0) { kpdBuffer[i] = maxVal; kpmBuffer[i] = minVal; }
else { kpdBuffer[i] = -maxVal; kpmBuffer[i] = -minVal; }
//
//
if (i<Bars-2)
if (!allPeaksMode)
{
if (kpoBuffer[i+1]>0 && kpoBuffer[i+1]>kpoBuffer[i] && kpoBuffer[i+1]>=kpoBuffer[i+2] && kpoBuffer[i+1]>= maxVal) kppBuffer[i+1] = kpoBuffer[i+1];
if (kpoBuffer[i+1]<0 && kpoBuffer[i+1]<kpoBuffer[i] && kpoBuffer[i+1]<=kpoBuffer[i+2] && kpoBuffer[i+1]<=-maxVal) kppBuffer[i+1] = kpoBuffer[i+1];
}
else
{
if (kpoBuffer[i+1]>0 && kpoBuffer[i+1]>kpoBuffer[i] && kpoBuffer[i+1]>=kpoBuffer[i+2]) kppBuffer[i+1] = kpoBuffer[i+1];
if (kpoBuffer[i+1]<0 && kpoBuffer[i+1]<kpoBuffer[i] && kpoBuffer[i+1]<=kpoBuffer[i+2]) kppBuffer[i+1] = kpoBuffer[i+1];
}
}
return(0);
}
//
//
limit = (int)MathMax(limit,MathMin(Bars-1,iCustom(NULL,TimeFrame,indicatorFileName,-99,0,0)*TimeFrame/Period()));
for (int i=limit; i>=0; i–)
{
int y = iBarShift(NULL,TimeFrame,Time[i]);
int x = y; if (i<Bars-1) x = iBarShift(NULL,TimeFrame,Time[i+1]);
kphBuffer[i] = iCustom(NULL,TimeFrame,indicatorFileName,PERIOD_CURRENT,kpoDeviations,kpoShortCycle,kpoLongCycle,kpoSensitivity,allPeaksMode,0,y);
kpoBuffer[i] = iCustom(NULL,TimeFrame,indicatorFileName,PERIOD_CURRENT,kpoDeviations,kpoShortCycle,kpoLongCycle,kpoSensitivity,allPeaksMode,1,y);
kpdBuffer[i] = iCustom(NULL,TimeFrame,indicatorFileName,PERIOD_CURRENT,kpoDeviations,kpoShortCycle,kpoLongCycle,kpoSensitivity,allPeaksMode,2,y);
kpmBuffer[i] = iCustom(NULL,TimeFrame,indicatorFileName,PERIOD_CURRENT,kpoDeviations,kpoShortCycle,kpoLongCycle,kpoSensitivity,allPeaksMode,3,y);
kppBuffer[i] = EMPTY_VALUE;
if (x!=y)
kppBuffer[i] = iCustom(NULL,TimeFrame,indicatorFileName,PERIOD_CURRENT,kpoDeviations,kpoShortCycle,kpoLongCycle,kpoSensitivity,allPeaksMode,4,y);
//
if (!Interpolate || (i>0 && y==iBarShift(NULL,TimeFrame,Time[i-1]))) continue;
int n,k; datetime time = iTime(NULL,TimeFrame,y);
for(n = 1; i+n < Bars && Time[i+n] >= time; n++) continue;
for(k = 1; i+k < Bars && i+n < Bars && k<n; k++)
{
kphBuffer[i+k] = kphBuffer[i] + (kphBuffer[i+n] – kphBuffer[i])*k/n;
kpoBuffer[i+k] = kpoBuffer[i] + (kpoBuffer[i+n] – kpoBuffer[i])*k/n;
kpdBuffer[i+k] = kpdBuffer[i] + (kpdBuffer[i+n] – kpdBuffer[i])*k/n;
kpmBuffer[i+k] = kpmBuffer[i] + (kpmBuffer[i+n] – kpmBuffer[i])*k/n;
}
}
return(0);
}
//
//
double iDeviation(int forDim, int period, int pos)
{
double dMA = iSma(forDim,period,pos);
double dSum = 0;
for(int i=0; i<period && pos>=0; i++,pos–) dSum += (wrkBuffer[pos][forDim]-dMA)*(wrkBuffer[pos][forDim]-dMA);
return(MathSqrt(dSum/period));
}
//
//
double iSma(int forDim, int period, int pos)
{
double sum = wrkBuffer[pos][forDim];
for(int i=1; i<period && (pos-i)>=0; i++) sum += wrkBuffer[pos-i][forDim];
return(sum/period);
}
//
//
string sTfTable[] = {“M1″,”M5″,”M15″,”M30″,”H1″,”H4″,”D1″,”W1″,”MN”};
int iTfTable[] = {1,5,15,30,60,240,1440,10080,43200};
string timeFrameToString(int tf)
{
for (int i=ArraySize(iTfTable)-1; i>=0; i–)
if (tf==iTfTable[i]) return(sTfTable[i]);
return(“”);
}
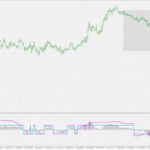
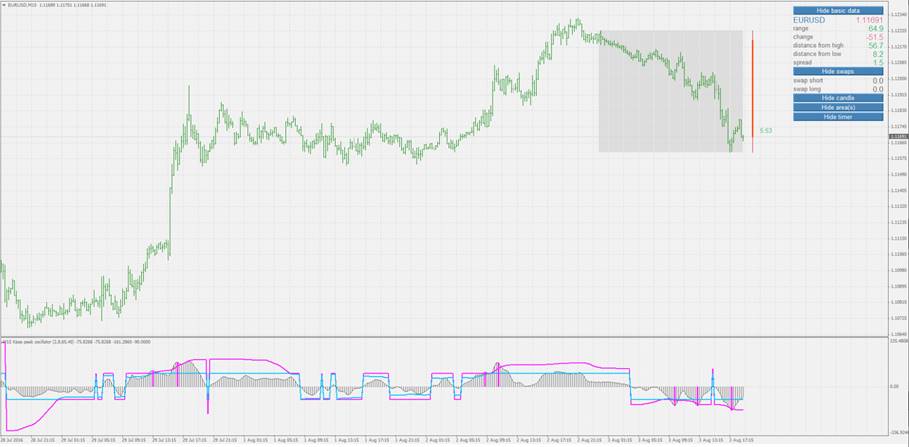
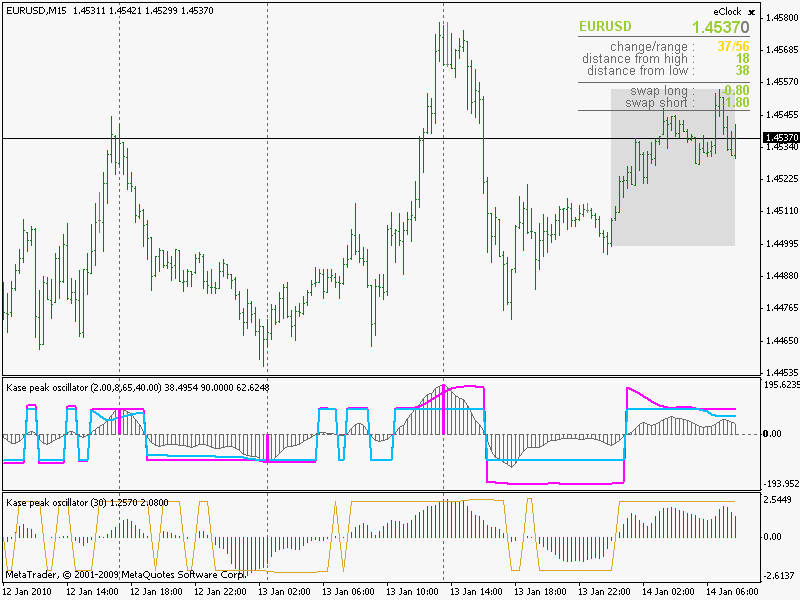
1) Kase Peak Oscillator Modified Forum VersionI think I prefer Kase’s version with the red and green Histogram, I’m not sure how easy that is to recreate?
The square blue line in the metatrader version is the go long/short indicator and the pink line is the Peak Out line.
1) Kase Peak Oscillator Green/Red Histogram
They have altered the code to make the Kase PO have less lag and more accurate, in response to a question on the forum about the differences between the public indicator which is up on prorealcode and Kase’s private version:
https://www.forex-tsd.com/forum/exclusive/11816-kase-indicators
There are several differences:
“The biggest difference is where the basic “momentum” comes from. In the “public” one data is taken linearly from current bar to the last bar specified by the period. In this one, the first one is the “shortCycle” bar and the last one is the “longCycle” bar and only that data is used along with average momentum to calculate what is later used for oscillator.
The “shortCycle” (or the omission of the first shortCycle values in one part of calculation) is an interesting idea and it seems that for some reasons it makes it more responsive to current price changes (the value of the oscillator itself). As a result it is obvious that the “public” version is showing peaks at places almost wrong compared to this version and it is, in cases of “major” moves, is considerably lagging in zero line crosses.
Along with some “tricks” (using logarithm in order to make a sort of normalization) it more or less makes a fair job of standardizing values without the 2.08 and 1.92 mumbo-jumbo constant calculation.
Those constants were the one that actually were bugging me. I could not believe that anything fairly serious (and the team around Kase can be called anything but “not serious”) can have that kind of voodoo. So this one does not have the voodoo any more.”
======================================================================================================
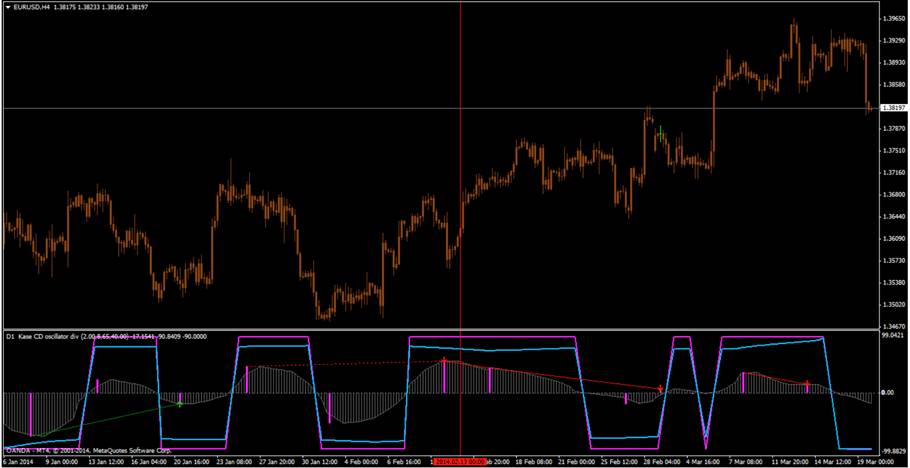
2) Kase CD (Convergence/Divergence)
Parameters :
kpoShortCycle-> starting position to calculate values
kpoLongCycle-> ending position to calculate values
kpoSensitivity-> sensitivity modifier used to calculate values
//Kase CD//
#property indicator_separate_window
#property indicator_buffers 7
#property indicator_color1 DimGray
#property indicator_color2 DimGray
#property indicator_color3 Magenta
#property indicator_color4 DeepSkyBlue
#property indicator_color5 Magenta
#property indicator_color6 LimeGreen
#property indicator_color7 Red
#property indicator_width3 2
#property indicator_width4 2
#property indicator_width5 2
#property indicator_level1 0
#property indicator_levelcolor DimGray
//
//
extern string TimeFrame = “Current time frame”;
extern double kcdDeviations = 2.0;
extern int kcdShortCycle = 8;
extern int kcdLongCycle = 65;
extern double kcdSensitivity = 40;
extern bool allPeaksMode = false;
extern bool drawDivergences = true;
extern bool drawIndicatorTrendLines = true;
extern bool drawPriceTrendLines = true;
extern string drawLinesIdentificator = “kaseCD1″;
extern bool Interpolate = true;
//
//
double kchBuffer[];
double kcdBuffer[];
double kdeBuffer[];
double kcmBuffer[];
double kcpBuffer[];
double bullishDivergence[];
double bearishDivergence[];
double wrkBuffer[][6];
string shortName;
string labelNames;
//
//
string indicatorFileName;
bool calculateValue;
bool returnBars;
int timeFrame;
double pipMultiplier = 1;
//
//
int init()
{
SetIndexBuffer(0,kchBuffer); SetIndexStyle(0,DRAW_HISTOGRAM);
SetIndexBuffer(1,kcdBuffer); SetIndexLabel(1,NULL);
SetIndexBuffer(2,kdeBuffer);
SetIndexBuffer(3,kcmBuffer);
SetIndexBuffer(4,kcpBuffer); SetIndexStyle(4,DRAW_HISTOGRAM); SetIndexLabel(4,”kpp”);
SetIndexBuffer(5,bullishDivergence); SetIndexStyle(5, DRAW_ARROW); SetIndexArrow(5, 233);
SetIndexBuffer(6,bearishDivergence); SetIndexStyle(6, DRAW_ARROW); SetIndexArrow(6, 234);
//
//
timeFrame = stringToTimeFrame(TimeFrame);
labelNames = “Kase CD oscillator_DivergenceLine “+drawLinesIdentificator+”:”;
shortName = timeFrameToString(timeFrame)+” Kase CD oscillator div (“+DoubleToStr(kcdDeviations,2)+”,”+kcdShortCycle+”,”+kcdLongCycle+”,”+DoubleToStr(kcdSensitivity,2)+”)”;
IndicatorShortName(shortName);
//
//
indicatorFileName = WindowExpertName();
calculateValue = (TimeFrame==”calculateValue”); if (calculateValue) return(0);
returnBars = (TimeFrame==”returnBars”); if (returnBars) return(0);
return(0);
}
//
//
int deinit()
{
int length=StringLen(labelNames);
for(int i=ObjectsTotal()-1; i>=0; i–)
{
string name = ObjectName(i);
if(StringSubstr(name,0,length) == labelNames) ObjectDelete(name);
}
return(0);
}
//
//
#define ccLog 0
#define ccDev 1
#define x1 2
#define xs 3
#define xp 4
#define xpAbs 5
//
//
int start()
{
int counted_bars=IndicatorCounted();
int i,r,limit;
if(counted_bars<0) return(-1);
if(counted_bars>0) counted_bars–;
limit = MathMin(Bars-counted_bars,Bars-kcdLongCycle);
if (returnBars) { kchBuffer[0] = limit+1; return(0); }
if (Digits==3 || Digits==5)
pipMultiplier = 10;
else pipMultiplier = 1;
//
//
if (calculateValue || timeFrame==Period())
{
if (ArrayRange(wrkBuffer,0) != Bars) ArrayResize(wrkBuffer,Bars);
for(i=limit,r=Bars-i-1; i>=0; i–,r++)
{
wrkBuffer[r][x1] = wrkBuffer[r-1][x1];
wrkBuffer[r][xs] = wrkBuffer[r-1][xs];
wrkBuffer[r][ccLog] = MathLog(Close[i]/Close[i+1]);
wrkBuffer[r][ccDev] = iDeviation(ccLog,9,r);
//
//
double avg = iSma(ccDev,30,r);
if (avg>0)
{
double max1 = 0;
double maxs = 0;
for (int k=kcdShortCycle; k<kcdLongCycle; k++)
{
max1 = MathMax(MathLog(High[i]/Low[i+k])/MathSqrt(k),max1);
maxs = MathMax(MathLog(High[i+k]/Low[i])/MathSqrt(k),maxs);
}
wrkBuffer[r][x1] = max1/avg;
wrkBuffer[r][xs] = maxs/avg;
}
wrkBuffer[r][xp] = kcdSensitivity*(iSma(x1,3,r)-iSma(xs,3,r));
wrkBuffer[r][xpAbs] = MathAbs(wrkBuffer[r][xp]);
//
//
kcpBuffer[i+1] = EMPTY_VALUE;
kcdBuffer[i] = wrkBuffer[r][xp]-iSma(xp,9,r);
kchBuffer[i] = kcdBuffer[i];
double tmpVal = iSma(xpAbs,50,r)+kcdDeviations*(iDeviation(xpAbs,50,r));
double maxVal = MathMax(90.0,tmpVal);
double minVal = MathMin(90.0,tmpVal);
if (kcdBuffer[i] > 0) { kdeBuffer[i] = maxVal; kcmBuffer[i] = minVal; }
else { kdeBuffer[i] = -maxVal; kcmBuffer[i] = -minVal; }
//
//
if (!allPeaksMode)
{
if (kcdBuffer[i+1]>0 && kcdBuffer[i+1]>kcdBuffer[i] && kcdBuffer[i+1]>=kcdBuffer[i+2] && kcdBuffer[i+1]>= maxVal) kcpBuffer[i+1] = kcdBuffer[i+1];
if (kcdBuffer[i+1]<0 && kcdBuffer[i+1]<kcdBuffer[i] && kcdBuffer[i+1]<=kcdBuffer[i+2] && kcdBuffer[i+1]<=-maxVal) kcpBuffer[i+1] = kcdBuffer[i+1];
}
else
{
if (kcdBuffer[i+1]>0 && kcdBuffer[i+1]>kcdBuffer[i] && kcdBuffer[i+1]>=kcdBuffer[i+2]) kcpBuffer[i+1] = kcdBuffer[i+1];
if (kcdBuffer[i+1]<0 && kcdBuffer[i+1]<kcdBuffer[i] && kcdBuffer[i+1]<=kcdBuffer[i+2]) kcpBuffer[i+1] = kcdBuffer[i+1];
}
if (drawDivergences)
{
CatchBullishDivergence(i);
CatchBearishDivergence(i);
}
}
return(0);
}
//
//
limit = MathMax(limit,MathMin(Bars-1,iCustom(NULL,timeFrame,indicatorFileName,”returnBars”,0,0)*timeFrame/Period()));
for (i=limit;i>=0; i–)
{
int y = iBarShift(NULL,timeFrame,Time[i]);
int x = iBarShift(NULL,timeFrame,Time[i+1]);
kchBuffer[i] = iCustom(NULL,timeFrame,indicatorFileName,”calculateValue”,kcdDeviations,kcdShortCycle,kcdLongCycle,kcdSensitivity,allPeaksMode,drawDivergences,drawIndicatorTrendLines,drawPriceTrendLines,drawLinesIdentificator,0,y);
kcdBuffer[i] = iCustom(NULL,timeFrame,indicatorFileName,”calculateValue”,kcdDeviations,kcdShortCycle,kcdLongCycle,kcdSensitivity,allPeaksMode,drawDivergences,drawIndicatorTrendLines,drawPriceTrendLines,drawLinesIdentificator,1,y);
kdeBuffer[i] = iCustom(NULL,timeFrame,indicatorFileName,”calculateValue”,kcdDeviations,kcdShortCycle,kcdLongCycle,kcdSensitivity,allPeaksMode,drawDivergences,drawIndicatorTrendLines,drawPriceTrendLines,drawLinesIdentificator,2,y);
kcmBuffer[i] = iCustom(NULL,timeFrame,indicatorFileName,”calculateValue”,kcdDeviations,kcdShortCycle,kcdLongCycle,kcdSensitivity,allPeaksMode,drawDivergences,drawIndicatorTrendLines,drawPriceTrendLines,drawLinesIdentificator,3,y);
kcpBuffer[i] = EMPTY_VALUE;
bullishDivergence[i] = EMPTY_VALUE;
bearishDivergence[i] = EMPTY_VALUE;
if (x!=y)
kcpBuffer[i] = iCustom(NULL,timeFrame,indicatorFileName,”calculateValue”,kcdDeviations,kcdShortCycle,kcdLongCycle,kcdSensitivity,allPeaksMode,drawDivergences,drawIndicatorTrendLines,drawPriceTrendLines,drawLinesIdentificator,4,y);
int firstBar = iBarShift(NULL,0,iTime(NULL,timeFrame,y));
if (i==firstBar)
{
bullishDivergence[i] = iCustom(NULL,timeFrame,indicatorFileName,”calculateValue”,kcdDeviations,kcdShortCycle,kcdLongCycle,kcdSensitivity,allPeaksMode,drawDivergences,drawIndicatorTrendLines,drawPriceTrendLines,drawLinesIdentificator,5,y);
bearishDivergence[i] = iCustom(NULL,timeFrame,indicatorFileName,”calculateValue”,kcdDeviations,kcdShortCycle,kcdLongCycle,kcdSensitivity,allPeaksMode,drawDivergences,drawIndicatorTrendLines,drawPriceTrendLines,drawLinesIdentificator,6,y);
}
//
//
if (!Interpolate || y==iBarShift(NULL,timeFrame,Time[i-1])) continue;
//
//
datetime time = iTime(NULL,timeFrame,y);
for(int n = 1; i+n < Bars && Time[i+n] >= time; n++) continue;
for(int s = 1; s < n; s++)
{
kchBuffer[i+s] = kchBuffer[i] + (kchBuffer[i+n] – kchBuffer[i]) * s/n;
kcdBuffer[i+s] = kcdBuffer[i] + (kcdBuffer[i+n] – kcdBuffer[i]) * s/n;
kdeBuffer[i+s] = kdeBuffer[i] + (kdeBuffer[i+n] – kdeBuffer[i]) * s/n;
kcmBuffer[i+s] = kcmBuffer[i] + (kcmBuffer[i+n] – kcmBuffer[i]) * s/n;
}
}
return(0);
}
//
//
double iDeviation(int forDim, int period, int pos)
{
double dMA = iSma(forDim,period,pos);
double dSum = 0;
for(int i=0; i<period; i++,pos–) dSum += (wrkBuffer[pos][forDim]-dMA)*(wrkBuffer[pos][forDim]-dMA);
return(MathSqrt(dSum/period));
}
//
//
double iSma(int forDim, int period, int pos)
{
double sum = wrkBuffer[pos][forDim];
for(int i=1; i<period; i++) sum += wrkBuffer[pos-i][forDim];
return(sum/period);
}
//
//
void CatchBullishDivergence(int shift)
{
shift++;
bullishDivergence[shift] = EMPTY_VALUE;
ObjectDelete(labelNames+”l”+DoubleToStr(Time[shift],0));
ObjectDelete(labelNames+”l”+”os” + DoubleToStr(Time[shift],0));
if(!IsIndicatorLow(shift)) return;
//
//
int currentLow = shift;
int lastLow = GetIndicatorLastLow(shift+1);
//
//
if(kcdBuffer[currentLow] > kcdBuffer[lastLow] && Low[currentLow] < Low[lastLow])
{
bullishDivergence[currentLow] = kcdBuffer[currentLow] – Point*pipMultiplier;
if(drawPriceTrendLines == true)
DrawPriceTrendLine(“l”,Time[currentLow],Time[lastLow],Low[currentLow],Low[lastLow],Green,STYLE_SOLID);
if(drawIndicatorTrendLines == true)
DrawIndicatorTrendLine(“l”,Time[currentLow],Time[lastLow],kcdBuffer[currentLow],kcdBuffer[lastLow],Green,STYLE_SOLID);
}
//
//
if(kcdBuffer[currentLow] < kcdBuffer[lastLow] && Low[currentLow] > Low[lastLow])
{
bullishDivergence[currentLow] = kcdBuffer[currentLow] – Point*pipMultiplier;
if(drawPriceTrendLines == true)
DrawPriceTrendLine(“l”,Time[currentLow],Time[lastLow],Low[currentLow],Low[lastLow], Green, STYLE_DOT);
if(drawIndicatorTrendLines == true)
DrawIndicatorTrendLine(“l”,Time[currentLow],Time[lastLow],kcdBuffer[currentLow], kcdBuffer[lastLow], Green, STYLE_DOT);
}
}
//
//
void CatchBearishDivergence(int shift)
{
shift++;
bearishDivergence[shift] = EMPTY_VALUE;
ObjectDelete(labelNames+”h”+DoubleToStr(Time[shift],0));
ObjectDelete(labelNames+”h”+”os” + DoubleToStr(Time[shift],0));
if(IsIndicatorPeak(shift) == false) return;
int currentPeak = shift;
int lastPeak = GetIndicatorLastPeak(shift+1);
//
//
if(kcdBuffer[currentPeak] < kcdBuffer[lastPeak] && High[currentPeak]>High[lastPeak])
{
bearishDivergence[currentPeak] = kcdBuffer[currentPeak] + Point*pipMultiplier;
if(drawPriceTrendLines == true)
DrawPriceTrendLine(“h”,Time[currentPeak],Time[lastPeak],High[currentPeak],High[lastPeak],Red,STYLE_SOLID);
if(drawIndicatorTrendLines == true)
DrawIndicatorTrendLine(“h”,Time[currentPeak],Time[lastPeak],kcdBuffer[currentPeak],kcdBuffer[lastPeak],Red,STYLE_SOLID);
}
//
//
if(kcdBuffer[currentPeak] > kcdBuffer[lastPeak] && High[currentPeak] < High[lastPeak])
{
bearishDivergence[currentPeak] = kcdBuffer[currentPeak] + Point*pipMultiplier;
if (drawPriceTrendLines == true)
DrawPriceTrendLine(“h”,Time[currentPeak],Time[lastPeak],High[currentPeak],High[lastPeak], Red, STYLE_DOT);
if (drawIndicatorTrendLines == true)
DrawIndicatorTrendLine(“h”,Time[currentPeak],Time[lastPeak],kcdBuffer[currentPeak],kcdBuffer[lastPeak], Red, STYLE_DOT);
}
}
//
//
bool IsIndicatorPeak(int shift)
{
if(kcpBuffer[shift] != EMPTY_VALUE && kcpBuffer[shift]>0)
return(true);
else return(false);
}
bool IsIndicatorLow(int shift)
{
if(kcpBuffer[shift] != EMPTY_VALUE && kcpBuffer[shift]<0)
return(true);
else return(false);
}
int GetIndicatorLastPeak(int shift)
{
for(int j=shift; j<Bars; j++) if(kcpBuffer[j] != EMPTY_VALUE && kcpBuffer[j]>0) return(j);
return(-1);
}
int GetIndicatorLastLow(int shift)
{
for(int j=shift; j<Bars; j++) if(kcpBuffer[j] != EMPTY_VALUE && kcpBuffer[j]<0) return(j);
return(-1);
}
//
//
void DrawPriceTrendLine(string first,datetime t1, datetime t2, double p1, double p2, color lineColor, double style)
{
string label = labelNames+first+”os”+DoubleToStr(t1,0);
ObjectDelete(label);
ObjectCreate(label, OBJ_TREND, 0, t1, p1, t2, p2, 0, 0);
ObjectSet(label, OBJPROP_RAY, 0);
ObjectSet(label, OBJPROP_COLOR, lineColor);
ObjectSet(label, OBJPROP_STYLE, style);
}
void DrawIndicatorTrendLine(string first,datetime t1, datetime t2, double p1, double p2, color lineColor, double style)
{
int indicatorWindow = WindowFind(shortName);
if (indicatorWindow < 0) return;
string label = labelNames+first+DoubleToStr(t1,0);
ObjectDelete(label);
ObjectCreate(label, OBJ_TREND, indicatorWindow, t1, p1, t2, p2, 0, 0);
ObjectSet(label, OBJPROP_RAY, 0);
ObjectSet(label, OBJPROP_COLOR, lineColor);
ObjectSet(label, OBJPROP_STYLE, style);
}
//
//
string sTfTable[] = {“M1″,”M5″,”M15″,”M30″,”H1″,”H4″,”D1″,”W1″,”MN”};
int iTfTable[] = {1,5,15,30,60,240,1440,10080,43200};
//
//
int stringToTimeFrame(string tfs)
{
tfs = StringUpperCase(tfs);
for (int i=ArraySize(iTfTable)-1; i>=0; i–)
if (tfs==sTfTable[i] || tfs==””+iTfTable[i]) return(MathMax(iTfTable[i],Period()));
return(Period());
}
string timeFrameToString(int tf)
{
for (int i=ArraySize(iTfTable)-1; i>=0; i–)
if (tf==iTfTable[i]) return(sTfTable[i]);
return(“”);
}
//
//
string StringUpperCase(string str)
{
string s = str;
for (int length=StringLen(str)-1; length>=0; length–)
{
int char = StringGetChar(s, length);
if((char > 96 && char < 123) || (char > 223 && char < 256))
s = StringSetChar(s, length, char – 32);
else if(char > -33 && char < 0)
s = StringSetChar(s, length, char + 224);
}
return(s);
}
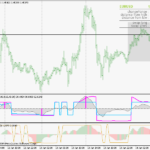
Kase CD Black (Convergence/Divergence
======================================================================================================
3) Kase Permission Screen
Here I’ve provided the Original Kase Histogram version (3)(i) and the Forex TSD Forum Modified Histogram version (3)(ii).
Lastly I have provided the Forex TSD Forum STOCHASTIC version (3)(iii).
I think I prefer the Original, although… what do you think?
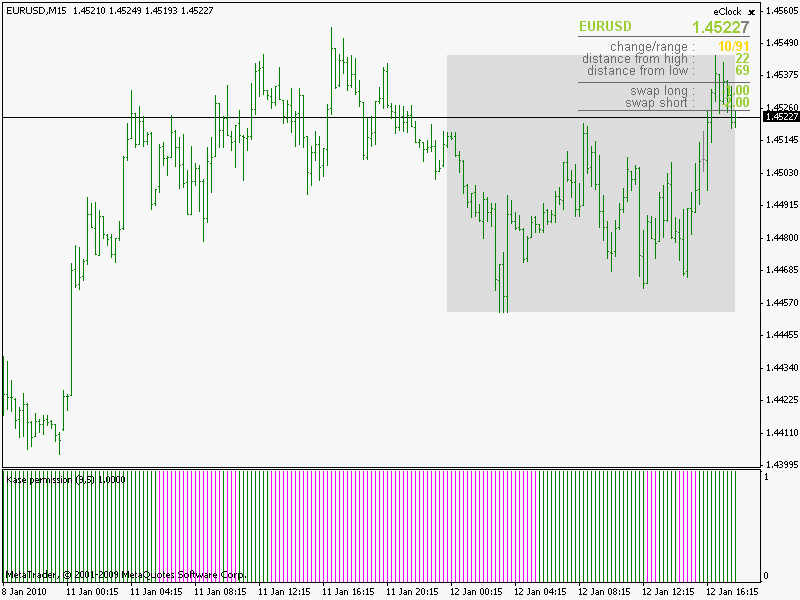
(3)(i) Histogram Permission Version
Kase’s Original Permission Histogram:
//Kase Original Permission Histogram//
#property indicator_separate_window
#property indicator_buffers 2
#property indicator_color1 Magenta
#property indicator_color2 Green
#property indicator_width1 1
#property indicator_width2 1
#property indicator_minimum 0
#property indicator_maximum 1
//
//
extern int pstLength = 9;
extern int pstX = 5;
extern int pstSmooth = 3;
//
//
double upBuffer[];
double dnBuffer[];
double wrkBuffer[][8];
//
//
int init()
{
SetIndexBuffer(0,upBuffer); SetIndexStyle(0,DRAW_HISTOGRAM);
SetIndexBuffer(1,dnBuffer); SetIndexStyle(1,DRAW_HISTOGRAM);
IndicatorShortName(“Kase permission (“+pstLength+”,”+pstX+”)”);
return(0);
}
int deinit() { return(0); }
//
//
#define TripleK 0
#define TripleDF 1
#define TripleDFs 2
#define TripleDS 3
#define TripleDSs 4
#define pstValue 5
#define pstSignal 6
#define pstTrend 7
//
//
int start()
{
double alpha = 2.0/(1.0+pstSmooth);
int lookBackPeriod = pstLength*pstX;
int counted_bars = IndicatorCounted();
int i,r,limit;
if(counted_bars<0) return(-1);
if(counted_bars>0) counted_bars–;
limit = MathMin(Bars-counted_bars,Bars-1);
if (ArrayRange(wrkBuffer,0) != Bars) ArrayResize(wrkBuffer,Bars);
//
//
for(i=limit,r=Bars-i-1; i>=0; i–,r++)
{
upBuffer[i] = EMPTY_VALUE;
dnBuffer[i] = EMPTY_VALUE;
//
//
double min = Low [iLowest (NULL,0,MODE_LOW ,lookBackPeriod,i)];
double max = High[iHighest(NULL,0,MODE_HIGH,lookBackPeriod,i)]-min;
if (max>0)
wrkBuffer[r][TripleK] = 100.0*(Close[i]-min)/max;
else wrkBuffer[r][TripleK] = 0.0;
if (i==(Bars-1))
{
wrkBuffer[r][TripleDF] = wrkBuffer[r][TripleK];
wrkBuffer[r][TripleDS] = wrkBuffer[r][TripleK];
wrkBuffer[r][pstValue] = wrkBuffer[r][TripleK];
wrkBuffer[r][pstSignal] = wrkBuffer[r][TripleK];
wrkBuffer[r][pstTrend] = 0;
continue;
}
wrkBuffer[r][TripleDF] = wrkBuffer[r-pstX][TripleDF]+alpha*(wrkBuffer[r][TripleK]-wrkBuffer[r-pstX][TripleDF]);
wrkBuffer[r][TripleDS] = (wrkBuffer[r-pstX][TripleDS]*2.0+wrkBuffer[r][TripleDF])/3.0;
//
//
wrkBuffer[r][TripleDFs] = iSma(TripleDF ,3,r);
wrkBuffer[r][pstValue] = iSma(TripleDFs,2,r);
wrkBuffer[r][TripleDSs] = iSma(TripleDS ,3,r);
wrkBuffer[r][pstSignal] = iSma(TripleDSs,2,r);
wrkBuffer[r][pstTrend] = wrkBuffer[r-1][pstTrend];
if (wrkBuffer[r][pstValue]<wrkBuffer[r][pstSignal]) wrkBuffer[r][pstTrend] = 1;
if (wrkBuffer[r][pstValue]>wrkBuffer[r][pstSignal]) wrkBuffer[r][pstTrend] = -1;
if (wrkBuffer[r][pstTrend]== 1) upBuffer[i] = 1;
if (wrkBuffer[r][pstTrend]==-1) dnBuffer[i] = 1;
}
return(0);
}
//
//
double iSma(int forDim, int period, int pos)
{
double sum = wrkBuffer[pos][forDim];
for(int i=1; i<period; i++) sum += wrkBuffer[pos-i][forDim];
return(sum/period);
}
Original Kase Permission Pink and Green Histogram:
————————————————————————————————————————————————————————
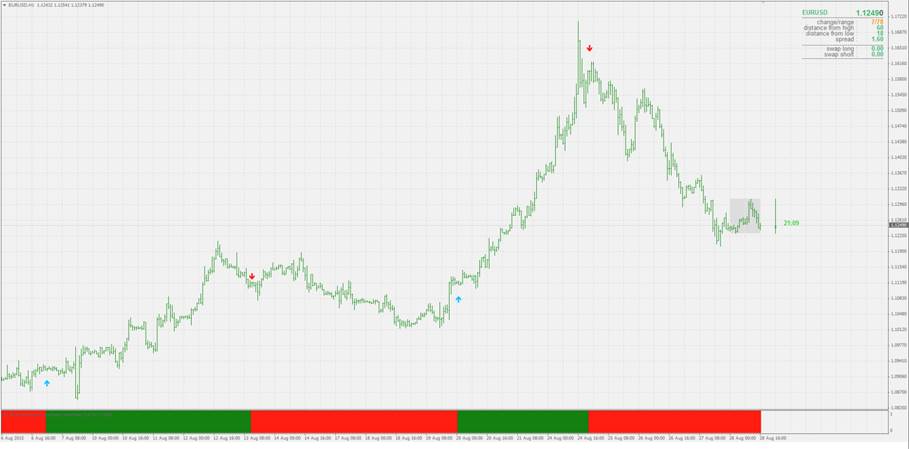
(3)(ii) Forex TSD Forum Modified Histogram (Solid Red and Green)
//Kase Permission Histogram//
#property indicator_separate_window
#property indicator_buffers 2
#property indicator_color1 Green
#property indicator_color2 Red
#property indicator_width1 3
#property indicator_width2 3
#property indicator_minimum 0
#property indicator_maximum 1
//
//
enum enPrices
{
pr_close, // Close
pr_open, // Open
pr_high, // High
pr_low, // Low
pr_median, // Median
pr_typical, // Typical
pr_weighted, // Weighted
pr_average, // Average (high+low+open+close)/4
pr_medianb, // Average median body (open+close)/2
pr_tbiased, // Trend biased price
pr_haclose, // Heiken ashi close
pr_haopen , // Heiken ashi open
pr_hahigh, // Heiken ashi high
pr_halow, // Heiken ashi low
pr_hamedian, // Heiken ashi median
pr_hatypical, // Heiken ashi typical
pr_haweighted, // Heiken ashi weighted
pr_haaverage, // Heiken ashi average
pr_hamedianb, // Heiken ashi median body
pr_hatbiased // Heiken ashi trend biased price
};
extern ENUM_TIMEFRAMES TimeFrame = PERIOD_CURRENT;
extern int pstLength = 14;
extern int pstX = 10;
extern enPrices pstPriceHigh = pr_high;
extern enPrices pstPriceLow = pr_low;
extern enPrices pstPrice = pr_close;
extern int pstSmooth = 3;
extern int smoothPeriod = 10;
extern bool alertsOn = true;
extern bool alertsOnCurrent = false;
extern bool alertsMessage = true;
extern bool alertsSound = false;
extern bool alertsNotify = false;
extern bool alertsEmail = false;
extern string soundFile = “alert2.wav”;
extern bool arrowsVisible = true;
extern string arrowsIdentifier = “kpss Arrows1″;
extern double arrowsDisplacement = 1.0;
extern color arrowsUpColor = DeepSkyBlue;
extern color arrowsDnColor = Red;
extern int arrowsUpCode = 233;
extern int arrowsDnCode = 234;
extern int arrowsUpSize = 1;
extern int arrowsDnSize = 1;
extern bool arrowsOnFirst = true;
double pstBuffer[];
double pssBuffer[];
double wrkBuffer[][5];
double UpH[];
double DnH[];
double trend[];
double priceHi[];
double priceLo[];
string indicatorFileName;
bool returnBars;
//
//
int init()
{
IndicatorBuffers(6);
SetIndexBuffer(0,UpH); SetIndexStyle(0,DRAW_HISTOGRAM);
SetIndexBuffer(1,DnH); SetIndexStyle(1,DRAW_HISTOGRAM);
SetIndexBuffer(2,pstBuffer);
SetIndexBuffer(3,pssBuffer);
SetIndexBuffer(4,trend);
SetIndexBuffer(5,priceHi);
SetIndexBuffer(6,priceLo);
//
//
pstSmooth = MathMax(pstSmooth,1);
smoothPeriod = MathMax(smoothPeriod,1);
indicatorFileName = WindowExpertName();
returnBars = (TimeFrame==-99);
TimeFrame = MathMax(TimeFrame,_Period);
//
//
IndicatorShortName(timeFrameToString(TimeFrame)+” Kase permission stochastic smoothed (“+pstLength+”,”+pstX+”)”);
return(0);
}
int deinit()
{
string lookFor = arrowsIdentifier+”:”;
int lookForLength = StringLen(lookFor);
for (int i=ObjectsTotal()-1; i>=0; i–)
{
string objectName = ObjectName(i);
if (StringSubstr(objectName,0,lookForLength) == lookFor) ObjectDelete(objectName);
}
return(0);
}
//
//
#define TripleK 0
#define TripleDF 1
#define TripleDFs 2
#define TripleDS 3
#define TripleDSs 4
//
//
int start()
{
double alpha = 2.0/(1.0+pstSmooth);
int lookBackPeriod = pstLength*pstX;
int counted_bars = IndicatorCounted();
int i,r,limit;
if(counted_bars<0) return(-1);
if(counted_bars>0) counted_bars–;
limit = MathMin(Bars-counted_bars,Bars-1);
if (returnBars) { UpH[0] = limit+1; return(0); }
//
//
if (TimeFrame==Period())
{
if (ArrayRange(wrkBuffer,0) != Bars) ArrayResize(wrkBuffer,Bars);
for(i=limit,r=Bars-i-1; i>=0; i–,r++)
{
priceHi[i] = getPrice(pstPriceHigh,Open,Close,High,Low,i);
priceLo[i] = getPrice(pstPriceHigh,Open,Close,High,Low,i);
double min = priceLo[ArrayMinimum(priceLo,lookBackPeriod,i)];
double max = priceHi[ArrayMaximum(priceHi,lookBackPeriod,i)]-min;
if (max>0)
wrkBuffer[r][TripleK] = 100.0*(getPrice(pstPrice,Open,Close,High,Low,i)-min)/max;
else wrkBuffer[r][TripleK] = 0.0;
if (i==(Bars-1))
{
wrkBuffer[r][TripleDF] = wrkBuffer[r][TripleK];
wrkBuffer[r][TripleDS] = wrkBuffer[r][TripleK];
continue;
}
wrkBuffer[r][TripleDF] = wrkBuffer[r-pstX][TripleDF]+alpha*(wrkBuffer[r][TripleK]-wrkBuffer[r-pstX][TripleDF]);
wrkBuffer[r][TripleDS] = (wrkBuffer[r-pstX][TripleDS]*2.0+wrkBuffer[r][TripleDF])/3.0;
//
//
wrkBuffer[r][TripleDSs] = iSma(TripleDS ,3,r);
pssBuffer[i] = iSmooth(wrkBuffer[r][TripleDSs],smoothPeriod,i,0);
wrkBuffer[r][TripleDFs] = iSma(TripleDF ,3,r);
pstBuffer[i] = iSmooth(wrkBuffer[r][TripleDFs],smoothPeriod,i,1);
//
//
UpH[i] = EMPTY_VALUE;
DnH[i] = EMPTY_VALUE;
trend[i] = trend[i+1];
if (pstBuffer[i] > pssBuffer[i]) trend[i] = 1;
if (pstBuffer[i] < pssBuffer[i]) trend[i] = -1;
if (trend[i] == 1) UpH[i] = 1;
if (trend[i] ==-1) DnH[i] = 1;
manageArrow(i);
}
manageAlerts();
return(0);
}
//
//
limit = MathMax(limit,MathMin(Bars-1,iCustom(NULL,TimeFrame,indicatorFileName,-99,0,0)*TimeFrame/Period()));
for (i=limit;i>=0; i–)
{
int y = iBarShift(NULL,TimeFrame,Time[i]);
trend[i] = iCustom(NULL,TimeFrame,indicatorFileName,PERIOD_CURRENT,pstLength,pstX,pstPriceHigh,pstPriceLow,pstPrice,pstSmooth,smoothPeriod,alertsOn,alertsOnCurrent,alertsMessage,alertsSound,alertsNotify,alertsEmail,soundFile,arrowsVisible,arrowsIdentifier,arrowsDisplacement,arrowsUpColor,arrowsDnColor,arrowsUpCode,arrowsDnCode,arrowsUpSize,arrowsDnSize,arrowsOnFirst,4,y);
UpH[i] = EMPTY_VALUE;
DnH[i] = EMPTY_VALUE;
if (trend[i] == 1) UpH[i] = 1;
if (trend[i] ==-1) DnH[i] = 1;
}
return(0);
}
//
//
double iSma(int forDim, int period, int pos)
{
double sum = wrkBuffer[pos][forDim];
for(int i=1; i<period; i++) sum += wrkBuffer[pos-i][forDim];
return(sum/period);
}
//
//
double workSmooth[][10];
double iSmooth(double price,double length,int r, int instanceNo=0)
{
if (ArrayRange(workSmooth,0)!=Bars) ArrayResize(workSmooth,Bars); instanceNo *= 5; r = Bars-r-1;
if(r<=2) { workSmooth[r][instanceNo] = price; workSmooth[r][instanceNo+2] = price; workSmooth[r][instanceNo+4] = price; return(price); }
//
//
double alpha = 0.45*(length-1.0)/(0.45*(length-1.0)+2.0);
workSmooth[r][instanceNo+0] = price+alpha*(workSmooth[r-1][instanceNo]-price);
workSmooth[r][instanceNo+1] = (price – workSmooth[r][instanceNo])*(1-alpha)+alpha*workSmooth[r-1][instanceNo+1];
workSmooth[r][instanceNo+2] = workSmooth[r][instanceNo+0] + workSmooth[r][instanceNo+1];
workSmooth[r][instanceNo+3] = (workSmooth[r][instanceNo+2] – workSmooth[r-1][instanceNo+4])*MathPow(1.0-alpha,2) + MathPow(alpha,2)*workSmooth[r-1][instanceNo+3];
workSmooth[r][instanceNo+4] = workSmooth[r][instanceNo+3] + workSmooth[r-1][instanceNo+4];
return(workSmooth[r][instanceNo+4]);
}
//
//
string sTfTable[] = {“M1″,”M5″,”M15″,”M30″,”H1″,”H4″,”D1″,”W1″,”MN”};
int iTfTable[] = {1,5,15,30,60,240,1440,10080,43200};
string timeFrameToString(int tf)
{
for (int i=ArraySize(iTfTable)-1; i>=0; i–)
if (tf==iTfTable[i]) return(sTfTable[i]);
return(“”);
}
//
//
double workHa[][4];
double getPrice(int price, const double& open[], const double& close[], const double& high[], const double& low[], int i, int instanceNo=0)
{
if (price>=pr_haclose)
{
if (ArrayRange(workHa,0)!= Bars) ArrayResize(workHa,Bars);
int r = Bars-i-1;
//
//
double haOpen;
if (r>0)
haOpen = (workHa[r-1][instanceNo+2] + workHa[r-1][instanceNo+3])/2.0;
else haOpen = (open[i]+close[i])/2;
double haClose = (open[i] + high[i] + low[i] + close[i]) / 4.0;
double haHigh = MathMax(high[i], MathMax(haOpen,haClose));
double haLow = MathMin(low[i] , MathMin(haOpen,haClose));
if(haOpen <haClose) { workHa[r][instanceNo+0] = haLow; workHa[r][instanceNo+1] = haHigh; }
else { workHa[r][instanceNo+0] = haHigh; workHa[r][instanceNo+1] = haLow; }
workHa[r][instanceNo+2] = haOpen;
workHa[r][instanceNo+3] = haClose;
//
//
switch (price)
{
case pr_haclose: return(haClose);
case pr_haopen: return(haOpen);
case pr_hahigh: return(haHigh);
case pr_halow: return(haLow);
case pr_hamedian: return((haHigh+haLow)/2.0);
case pr_hamedianb: return((haOpen+haClose)/2.0);
case pr_hatypical: return((haHigh+haLow+haClose)/3.0);
case pr_haweighted: return((haHigh+haLow+haClose+haClose)/4.0);
case pr_haaverage: return((haHigh+haLow+haClose+haOpen)/4.0);
case pr_hatbiased:
if (haClose>haOpen)
return((haHigh+haClose)/2.0);
else return((haLow+haClose)/2.0);
}
}
//
//
switch (price)
{
case pr_close: return(close[i]);
case pr_open: return(open[i]);
case pr_high: return(high[i]);
case pr_low: return(low[i]);
case pr_median: return((high[i]+low[i])/2.0);
case pr_medianb: return((open[i]+close[i])/2.0);
case pr_typical: return((high[i]+low[i]+close[i])/3.0);
case pr_weighted: return((high[i]+low[i]+close[i]+close[i])/4.0);
case pr_average: return((high[i]+low[i]+close[i]+open[i])/4.0);
case pr_tbiased:
if (close[i]>open[i])
return((high[i]+close[i])/2.0);
else return((low[i]+close[i])/2.0);
}
return(0);
}
//
//
void manageAlerts()
{
if (alertsOn)
{
if (alertsOnCurrent)
int whichBar = 0;
else whichBar = 1;
if (trend[whichBar] != trend[whichBar+1])
{
if (trend[whichBar] == 1) doAlert(whichBar,”up”);
if (trend[whichBar] ==-1) doAlert(whichBar,”down”);
}
}
}
//
//
void doAlert(int forBar, string doWhat)
{
static string previousAlert=”nothing”;
static datetime previousTime;
string message;
if (previousAlert != doWhat || previousTime != Time[forBar]) {
previousAlert = doWhat;
previousTime = Time[forBar];
//
//
message = StringConcatenate(Symbol(),” “,timeFrameToString(_Period),” at “,TimeToStr(TimeLocal(),TIME_SECONDS),” Kase PS trend changed to “,doWhat);
if (alertsMessage) Alert(message);
if (alertsNotify) SendNotification(StringConcatenate(Symbol(), Period() ,” Kase PS ” +” “+message));
if (alertsEmail) SendMail(StringConcatenate(Symbol(),” Kase PS “),message);
if (alertsSound) PlaySound(soundFile);
}
}
//
//
void manageArrow(int i)
{
if (arrowsVisible)
{
ObjectDelete(arrowsIdentifier+”:”+Time[i]);
if (trend[i] != trend[i+1])
{
if (trend[i] == 1) drawArrow(i,arrowsUpColor,arrowsUpCode,arrowsUpSize,false);
if (trend[i] ==-1) drawArrow(i,arrowsDnColor,arrowsDnCode,arrowsDnSize,true);
}
}
}
//
//
void drawArrow(int i,color theColor,int theCode,int theWidth,bool up)
{
string name = arrowsIdentifier+”:”+Time[i];
double gap = 3.0*iATR(NULL,0,20,i)/4.0;
int add = 0; if (!arrowsOnFirst) add = _Period*60-1;
//
//
ObjectCreate(name,OBJ_ARROW,0,Time[i]+add,0);
ObjectSet(name,OBJPROP_ARROWCODE,theCode);
ObjectSet(name,OBJPROP_COLOR,theColor);
ObjectSet(name,OBJPROP_WIDTH,theWidth);
if (up)
ObjectSet(name,OBJPROP_PRICE1,High[i]+ arrowsUpperGap * gap);
else ObjectSet(name,OBJPROP_PRICE1,Low[i] – arrowsLowerGap * gap);
}
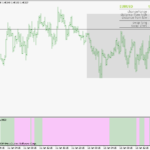
I think this code above is meant to look like this screenshot below (See (3)(ii) Forum Modified Histogram Version Image:) with the red and green histogram solid bar signals – there were many versions and updates from the forum and not all were better than the version that came before the latest update:
(3)(ii) Forum Modified Histogram Green and Red Version:
———————————————————————————————————————————————————————————
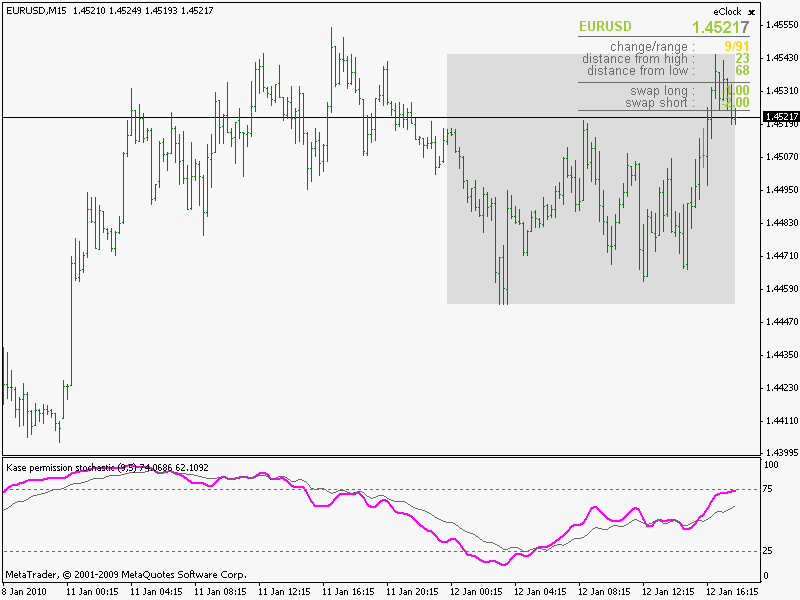
(3)(iii) Kase Stochastic Permission
//Kase Permision Stochastic//
#property indicator_separate_window
#property indicator_buffers 2
#property indicator_color1 Magenta
#property indicator_color2 DimGray
#property indicator_width1 2
#property indicator_width2 1
#property indicator_minimum 0
#property indicator_maximum 100
#property indicator_level1 25
#property indicator_level2 75
#property indicator_levelcolor DimGray
//
//
extern int pstLength = 9;
extern int pstX = 5;
extern int pstSmooth = 3;
extern int smoothPeriod = 10;
extern double smoothSpeed = 3.0;
extern bool smoothAdaptive = true;
//
//
double pstBuffer[];
double pssBuffer[];
double wrkBuffer[][5];
//
//
int init()
{
SetIndexBuffer(0,pstBuffer);
SetIndexBuffer(1,pssBuffer);
pstSmooth = MathMax(pstSmooth,1);
smoothPeriod = MathMax(smoothPeriod,1);
IndicatorShortName(“Kase permission stochastic oma smoothed (“+pstLength+”,”+pstX+”)”);
return(0);
}
int deinit() { return(0); }
//
//
#define TripleK 0
#define TripleDF 1
#define TripleDFs 2
#define TripleDS 3
#define TripleDSs 4
//
//
int start()
{
double alpha = 2.0/(1.0+pstSmooth);
int lookBackPeriod = pstLength*pstX;
int counted_bars = IndicatorCounted();
int i,r,limit;
if(counted_bars<0) return(-1);
if(counted_bars>0) counted_bars–;
limit = MathMin(Bars-counted_bars,Bars-1);
if (ArrayRange(wrkBuffer,0) != Bars) ArrayResize(wrkBuffer,Bars);
//
//
for(i=limit,r=Bars-i-1; i>=0; i–,r++)
{
double min = Low [iLowest (NULL,0,MODE_LOW ,lookBackPeriod,i)];
double max = High[iHighest(NULL,0,MODE_HIGH,lookBackPeriod,i)]-min;
if (max>0)
wrkBuffer[r][TripleK] = 100.0*(Close[i]-min)/max;
else wrkBuffer[r][TripleK] = 0.0;
if (i==(Bars-1))
{
wrkBuffer[r][TripleDF] = wrkBuffer[r][TripleK];
wrkBuffer[r][TripleDS] = wrkBuffer[r][TripleK];
continue;
}
wrkBuffer[r][TripleDF] = wrkBuffer[r-pstX][TripleDF]+alpha*(wrkBuffer[r][TripleK]-wrkBuffer[r-pstX][TripleDF]);
wrkBuffer[r][TripleDS] = (wrkBuffer[r-pstX][TripleDS]*2.0+wrkBuffer[r][TripleDF])/3.0;
//
//
wrkBuffer[r][TripleDSs] = iSma(TripleDS ,3,r);
pssBuffer[i] = iSmooth(wrkBuffer[r][TripleDSs],smoothPeriod,smoothSpeed,smoothAdaptive,i,0);
wrkBuffer[r][TripleDFs] = iSma(TripleDF ,3,r);
pstBuffer[i] = iSmooth(wrkBuffer[r][TripleDFs],smoothPeriod,smoothSpeed,smoothAdaptive,i,7);
}
return(0);
}
//
//
double iSma(int forDim, int period, int pos)
{
double sum = wrkBuffer[pos][forDim];
for(int i=1; i<period; i++) sum += wrkBuffer[pos-i][forDim];
return(sum/period);
}
//
//
#define E1 0
#define E2 1
#define E3 2
#define E4 3
#define E5 4
#define E6 5
#define res 6
double stored[][14];
//
//
double iSmooth(double price, double averagePeriod, double const, bool adaptive,int i, int ashift=0)
{
int r = Bars-i-1;
if (ArrayRange(stored,0) != Bars) { ArrayResize(stored,Bars); }
double e1=stored[r-1][E1+ashift]; double e2=stored[r-1][E2+ashift];
double e3=stored[r-1][E3+ashift]; double e4=stored[r-1][E4+ashift];
double e5=stored[r-1][E5+ashift]; double e6=stored[r-1][E6+ashift];
//
//
if (adaptive && (averagePeriod > 1))
{
double minPeriod = averagePeriod/2.0;
double maxPeriod = minPeriod*5.0;
int endPeriod = MathCeil(maxPeriod);
double signal = MathAbs((price-stored[r-endPeriod][res+ashift]));
double noise = 0.00000000001;
for(int k=1; k<endPeriod; k++) noise=noise+MathAbs(price-stored[r-k][res+ashift]);
averagePeriod = ((signal/noise)*(maxPeriod-minPeriod))+minPeriod;
}
//
//
double alpha = (2.0+const)/(1.0+const+averagePeriod);
e1 = e1 + alpha*(price-e1); e2 = e2 + alpha*(e1-e2); double v1 = 1.5 * e1 – 0.5 * e2;
e3 = e3 + alpha*(v1 -e3); e4 = e4 + alpha*(e3-e4); double v2 = 1.5 * e3 – 0.5 * e4;
e5 = e5 + alpha*(v2 -e5); e6 = e6 + alpha*(e5-e6); double v3 = 1.5 * e5 – 0.5 * e6;
//
//
stored[r][E1+ashift] = e1; stored[r][E2+ashift] = e2;
stored[r][E3+ashift] = e3; stored[r][E4+ashift] = e4;
stored[r][E5+ashift] = e5; stored[r][E6+ashift] = e6;
stored[r][res+ashift] = price;
return(v3);
}
——————————————————————————————————————————————————————————–
——————————————————————————————————————————————————————————–
Kase OMA Smoothed Stochastic Permission:
There are a few different forum Stochastic Permission versions (and many updates made by the metatrader coder. I think the OMA smoothed is the better version half way down the page:
https://www.forex-tsd.com/forum/exclusive/11816-kase-indicators
“Instead of using simple moving average in the final step of smoothing (as in the original) using two new “flavors” for that final smoothing: one more average smoothed and Jurik smoothed (so all the tastes are “covered”) Even if these are replacing a simple moving average with SMA period (of) only 2 and the replacements are using period 10, crosses are not lagging compared to the original and we are getting considerably smoother values.”
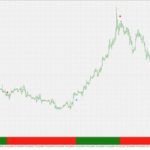
I think they are lagging when smoothed, here is an the original Kase Permission code drawn as a Stochastic Pink Line:
I couldn’t see the code for this on the forum but it’s derived from Kase’s code:
 1-Kase-Peak-Oscillator-Modified-Forum-Version.jpg
 1-Kase-Peak-Oscillator-GreenRed-Histogram.png
 2-Kase-Black-CD-ConvergenceDivergence.jpg
 3ii-Forex-TSD-Forum-Modified-Histogram-Solid-Red-and-Green.png
 3ii-Forum-Modified-Histogram-Green-and-Red-Version.jpg
 Kase-Unsmoothed-Stochastic-Permission-Pink-Line-Version.png
Could you please add the .mq4 files? Would be easier for me to read the code and understand how to translate them. Thank you.
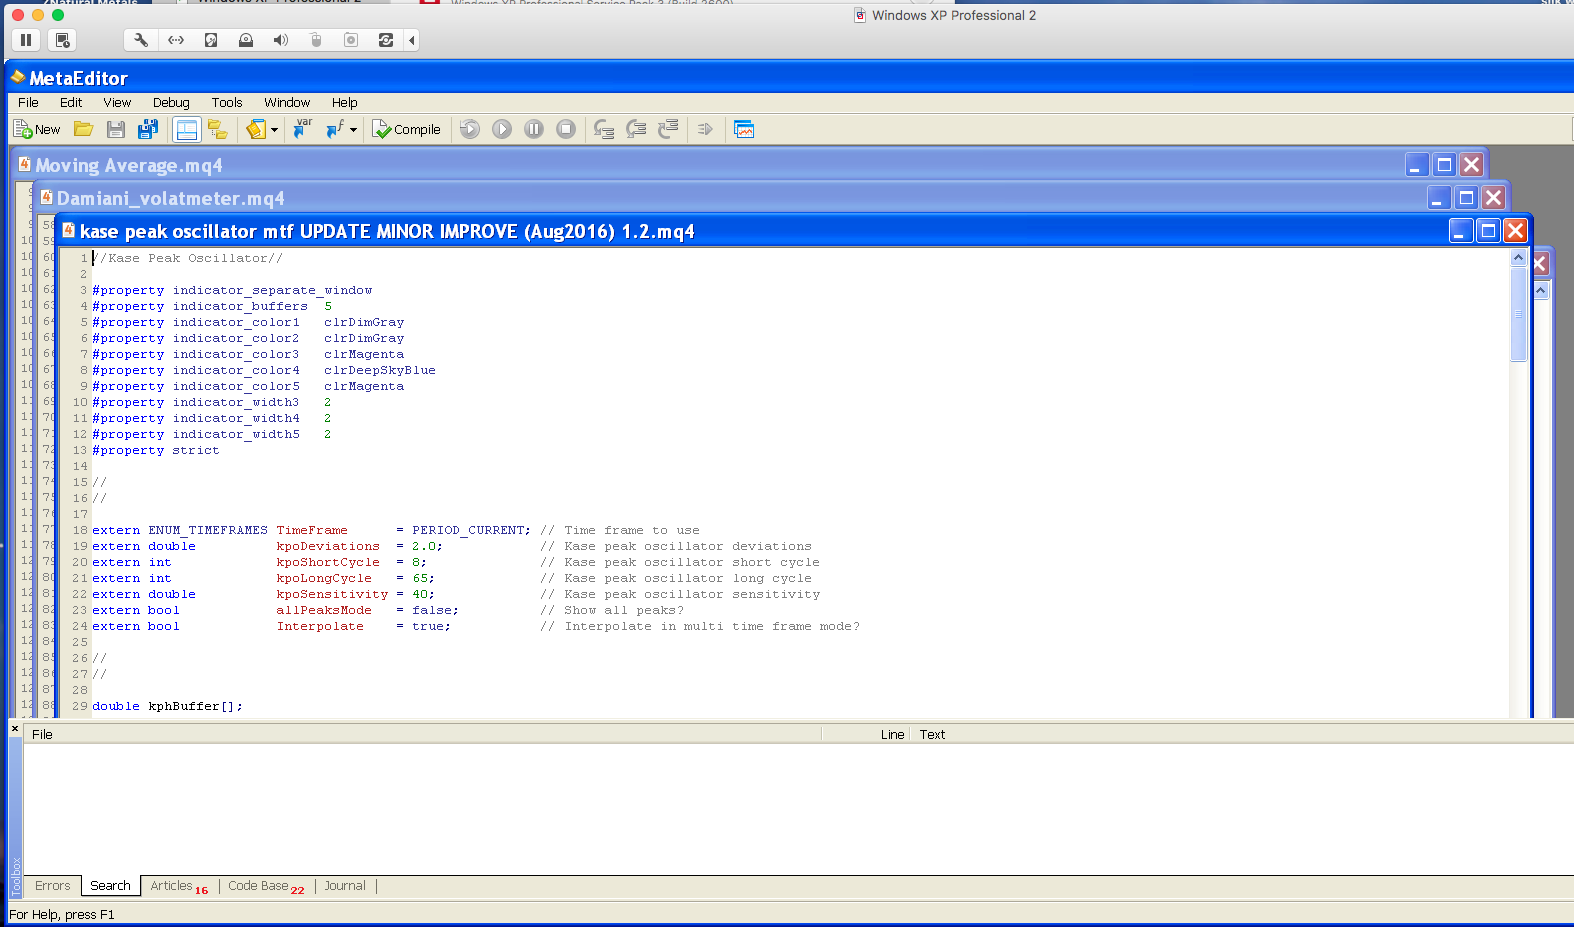
Derek thanked this postSorry, I thought this was mq4? Pls see screenshot. The files I got from the Forex TSD have the mq4 extension and show in my Apple finder as mq4?
I need the files, not the copy/pasted codes, in order to open them directly into Metaeditor, thank you.
Right, got it – files not the code. Attached here below:
(Note: It was 78% forecasting accuracy not 85% as in my post above).
Cheers
BardAbout this “forecasting accuracy”, I understand that the indicator give potential reverse zone and has 78% accuracy, but for how much time the trend reversal last? Because oscillator that rely on price mean reverting often give accurate result, but it depends on how you exit from position once you had already jumped in from a signal (after 1 bar, 10 bars, etc..).
I’ll have a look later (yes I know I always say that, but I’m on intermittent holidays). Please ‘up’ the topic once in a while, as a reminder for me 🙂
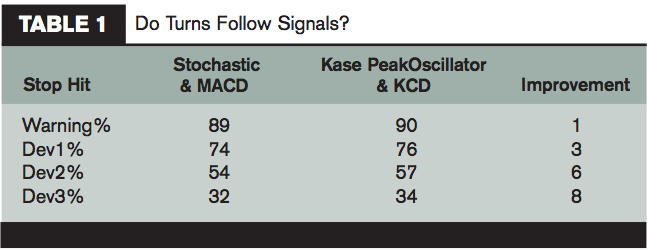
The oscillator is used in conjunction with the Kase Dev Stops that you already coded. The following two tables and copper chart and text pasted from the Two Faces of Momentum should clarify:
“To measure how well the momentum indicators work, we first must define what constitutes a successful indicator. For purposes of this study, we measured an indicator’s success rate in two ways. First, an indicator’s success was measured in terms of how often the market turned sufficiently to hit stops following a momentum divergence signal. Second, success was measured by how often market turns that were of sufficient magnitude to hit stops were preceded by a divergence signal.
So, we can classify our performance measures in terms of “what follows,” (e.g., does a turn follow the signal?), and “what leads,” (e.g., did the signal take place before the turn?).
For the stops, we employed the Kase DevStops, a system that uses the reversals based on True Range to set stops. True Range is the maximum of the high minus the low, the previous close minus the high, or the low minus the previous close.
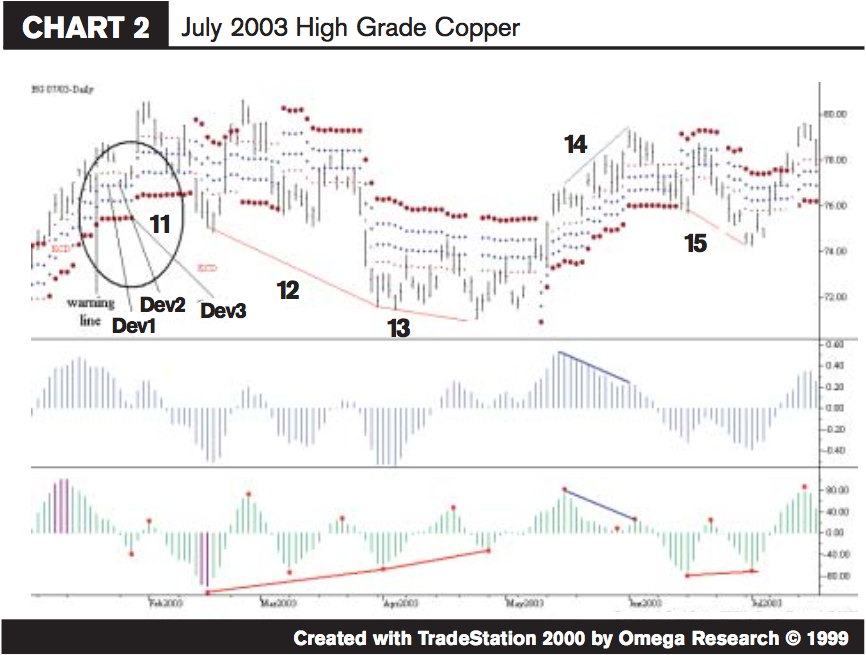
The warning line is set at the average two bar reversal and the three additional stops – Dev 1, Dev2 and Dev3 are set at levels around levels which represent one, two and three standard deviation reversals.
On Chart 2 – July 2003 High Grade Copper ñ the four stops just noted are labeled in the circle marked ì11.î One can see that minor reversals test Dev1 or Dev2, while the major reversals tend to break Dev3, and the stops follow the market moves well.
In order to evaluate the performance of the indicators discussed, we set up daily data charts over a range of futures contracts data including cattle, coffee, corn, cotton, crude oil, gold, natural gas and the S&P 500 index. Altogether, our test was performed on 47,000 days of data, about 185 years in total.
Divergence signals were programmed on the traditional indicators and on the Kase indicators using the rules and guidelines outlined above relative to the proper mechanics of identification.
For the first part of the momentum performance study, we looked at which stops were hit following divergence.
Because two Kase indicators, the PeakOscillator and KCD, are always used together, we show their results along with the results of two traditional indicators ñ the Stochastic and MACD – which, when used in conjunction with one another, give the best results. See Image Table 1.
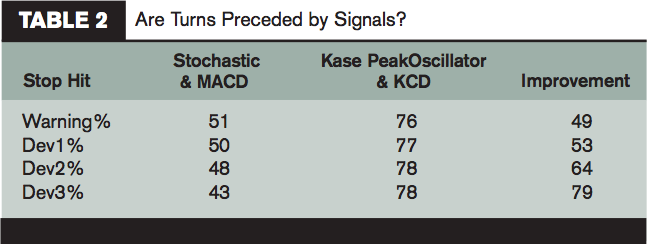
As Table 1 illustrates, we found that relative to what follows, the indicators work about the same. The Kase indicators result in an average improvement of about four percent, with the level of improvement increasing with the size of the reversal.See Image Table 2.
However, a huge difference is seen between the traditional indicators and the Kase indicators when we evaluate the data in the opposite direction, as to “what leads.” The traditional indicators catch less than half of the market turns, and the Kase indicators catch more than three-quarters of them (See Table 2). There is an overall improvement of more than 60 percent, and the larger the reversal, the greater the level of improvement.See Copper Chart Image.
If one were to use all three traditional indicators, the performance would be marginally better. The results would increase from an average of 48 percent of the turns caught to about 57 percent.
The Kase performance level of 78 percent is so high over the statistically significant sample of 47,000 days of test data used that even if one had managed to follow all three traditional indicators in addition to the Kase indicators, only a marginal improvement in performance, around 10 percent, would have resulted.
Chart 2 illustrates this point. The turns caught by both indicators are shown in blue, while those only caught by the KCD are shown in red.
12. The divergence labeled “12” was caught by the KCD when prices made a lower low and the indicator made a higher low. The MACD failed to catch it because it made a lower low. In this case, Dev1 was broken, and prices stalled right below Dev2.
13. The same is true of “13” as “12,” and the market reversed well beyond Dev3 following that turn.
14. Both indicators exhibited a lower high when prices made a higher high and Dev3 was definitively broken thereafter.
15. After the decline that followed “14,” the market turned back up, and that turn was caught by a higher low on the KCD that matched a lower low in price. The MACD failed to catch this turn that broke Dev3.”
Intermittent holidays sound like a very good idea. 🙂
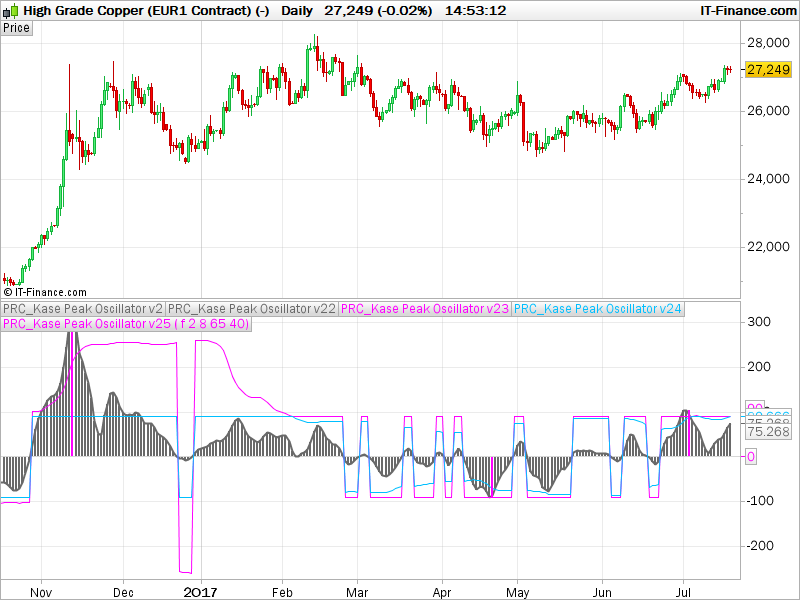
Nicolas thanked this postJust finished converting the Kase Peak Oscillator, a bit tricky but it’s finally done. The indicator is attached to this post. I’ll add all of them in the library when we’ll finished all conversions.
Results are the same between MT4 and Prorealtime (compared with GBPUSD), however there might be one bar difference for the purple histogram because MT4 paint it in the past while I plot it on the current bar (can’t plot histogram in the past with ProBuilder).
EDIT: Kase Peak Oscillator new version is now also available in the library.
Wow, thanks, great work Nicolas, and look at the perfect divergence signal from the oscillator formed between the late Nov high and the mid Feb lower high as the market price hits new highs but the market price then breaks down… and ditto again with the mid April oscillator low and mid May higher low as the market bottoms out then turns up.
Cheers, very much appreciated,
BardI’ve scan read the Two Faces of Momentum pdf, a few more links on the net, and the text parts of this Thread and sat looking at the image in post #41084 for an hour or so (watchjing tv also! 🙂 ) .
The Kase Oscillator seems highly thought of (?) and so Bard if you have any more examples of divergence, signals etc and how to use Kase then please point them out (with corresponding arrows on Oscillator and Price if you are able please) so I can ‘get all Kased up ‘? 🙂
Many Thanks
GraHalGood one @noobywan 🙂
@Bard , so what’s next?EDIT: Kase Peak Oscillator new version is now also available in the library.
Nice one Noobs … humour helps keep us sane! 🙂
I kept asking myself … how would I use Kase to enter and exit a trade? I could see the 2 x divergence that Bard pointed out in #41281 , but not sure I’d have leapt into a trade (at that time) one or two bars after the divergent peaks / troughs? Okay with hindsight when we can see the price curve and profit.
I also kept asking myself … how would I use the pink and blue lines on the image in post #41084 … maybe only usable at > 100 and < -100? I installed Kase on my platform and played around with the parameters … still didn’t come to any meaningful conclusion. Am I missing something?
If we had a Strat built around Kase then we could GRAPH the entry / exit triggers (valuable education) and it be evident how reliable / successful Kase is?
Thanks for Listening
GraHalHi GraHal,
A good place to start is would be by looking at Kase’s book “Trading with the Odds” which is on the net and has lots of charts showing divergences.
I also used to watch TV whilst “learning” stuff, I used to practice my scales on the guitar…Best Bard
GraHal thanked this postPs/ I should point out GraHal, the Kase Peak Oscillator is not a stand alone indicator – She used it with the Kase Convergence / Divergence indicator and the Kase Permission Histogram, which I’d imagine, @Nicolas has dropped all other coding assignments and is busy looking into coding if I’m not mistaken, right!? Ha ha. (re: you’re “so whats next” comment).
-
AuthorPosts
- You must be logged in to reply to this topic.
Kase Peak Oscillator, Kase CD and Kase Permission
ProBuilder: Indicators & Custom Tools
Summary
This topic contains 45 replies,
has 8 voices, and was last updated by ![]() ggolfet
ggolfet
7 years, 4 months ago.
Topic Details
| Forum: | ProBuilder: Indicators & Custom Tools |
| Language: | English |
| Started: | 07/05/2017 |
| Status: | Active |
| Attachments: | 32 files |
About personal data collected
The information collected on this form is stored in a computer file by ProRealCode to create and access your ProRealCode profile. This data is kept in a secure database for the duration of the member's membership. They will be kept as long as you use our services and will be automatically deleted after 3 years of inactivity. Your personal data is used to create your private profile on ProRealCode. This data is maintained by SAS ProRealCode, 407 rue Freycinet, 59151 Arleux, France. If you subscribe to our newsletters, your email address is provided to our service provider "MailChimp" located in the United States, with whom we have signed a confidentiality agreement. This company is also compliant with the EU/Swiss Privacy Shield, and the GDPR. For any request for correction or deletion concerning your data, you can directly contact the ProRealCode team by email at privacy@prorealcode.com If you would like to lodge a complaint regarding the use of your personal data, you can contact your data protection supervisory authority.