Grazie! Eccolo, spero non sia troppo lungo
——————————————————————
study(“Engulfing Look-back Alert”, overlay=true)
//User Defined Inputs
//TimeFrame to display engulfing candles on
isMonthly = iff (input(title=”Display on Monthly TF?”, type=input.bool, defval=true), “M”, na)
isWeekly = iff (input(title=”Display on Weekly TF?”, type=input.bool, defval=true), “W”, na)
isDaily = iff (input(title=”Display on Daily TF?”, type=input.bool, defval=true), “D”, na)
is4H = iff (input(title=”Display on 4H TF?”, type=input.bool, defval=true), “240”, na)
is1H = iff (input(title=”Display on 1H TF?”, type=input.bool, defval=true), “60”, na)
is15M = iff (input(title=”Display on 15M TF?”, type=input.bool, defval=true), “15”, na)
//Display engulfing on current timeframe?
timeframeEnabled = (timeframe.period==isMonthly or timeframe.period==isWeekly or timeframe.period==isDaily or timeframe.period==is4H or timeframe.period==is1H or timeframe.period==is15M)
//===============================================
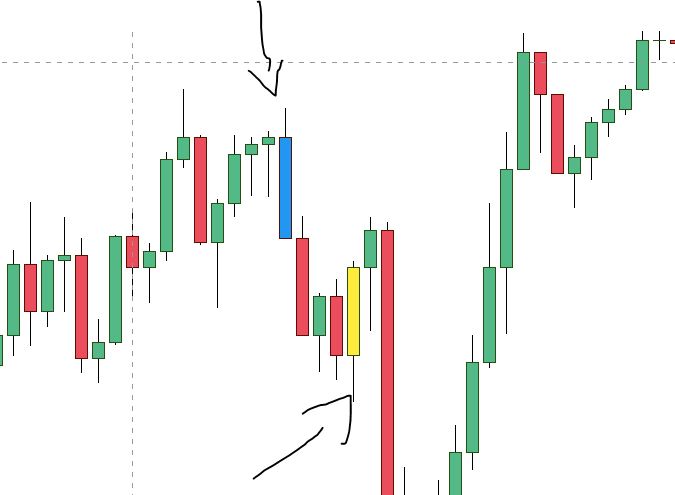
//BULLISH ENGULFING
//===============================================
//# of bars back (left) to compare the Engulfing Candle’s high and low
bullPeriodLookBackHighs = input(title=”BullEng Highs Look-back period”, minval=1, type=input.integer, defval=1)
bullPeriodLookBackLows = input(title=”BullEng Lows Look-back period”, minval=1, type=input.integer, defval=1)
// Calculate highest high comparing 1st historic candle with the look-back period
bullHiHighs = highest(high, bullPeriodLookBackHighs)[2]
// Calculate lowest low comparing 1st historic candle with the look-back period
bullLowLows = lowest(low, bullPeriodLookBackLows)[2]
//Candle must close above prev candle high AND candle low is lower than the lowest low for the look-back period (bullLowLows) AND candle high is higher than look-back period for the highest high (bullHiHighs)
isBullishEngulfing() =>
close[1] > high [2] and low[1] < bullLowLows and high[1] > bullHiHighs
foundBullish = isBullishEngulfing()
// Display on chart
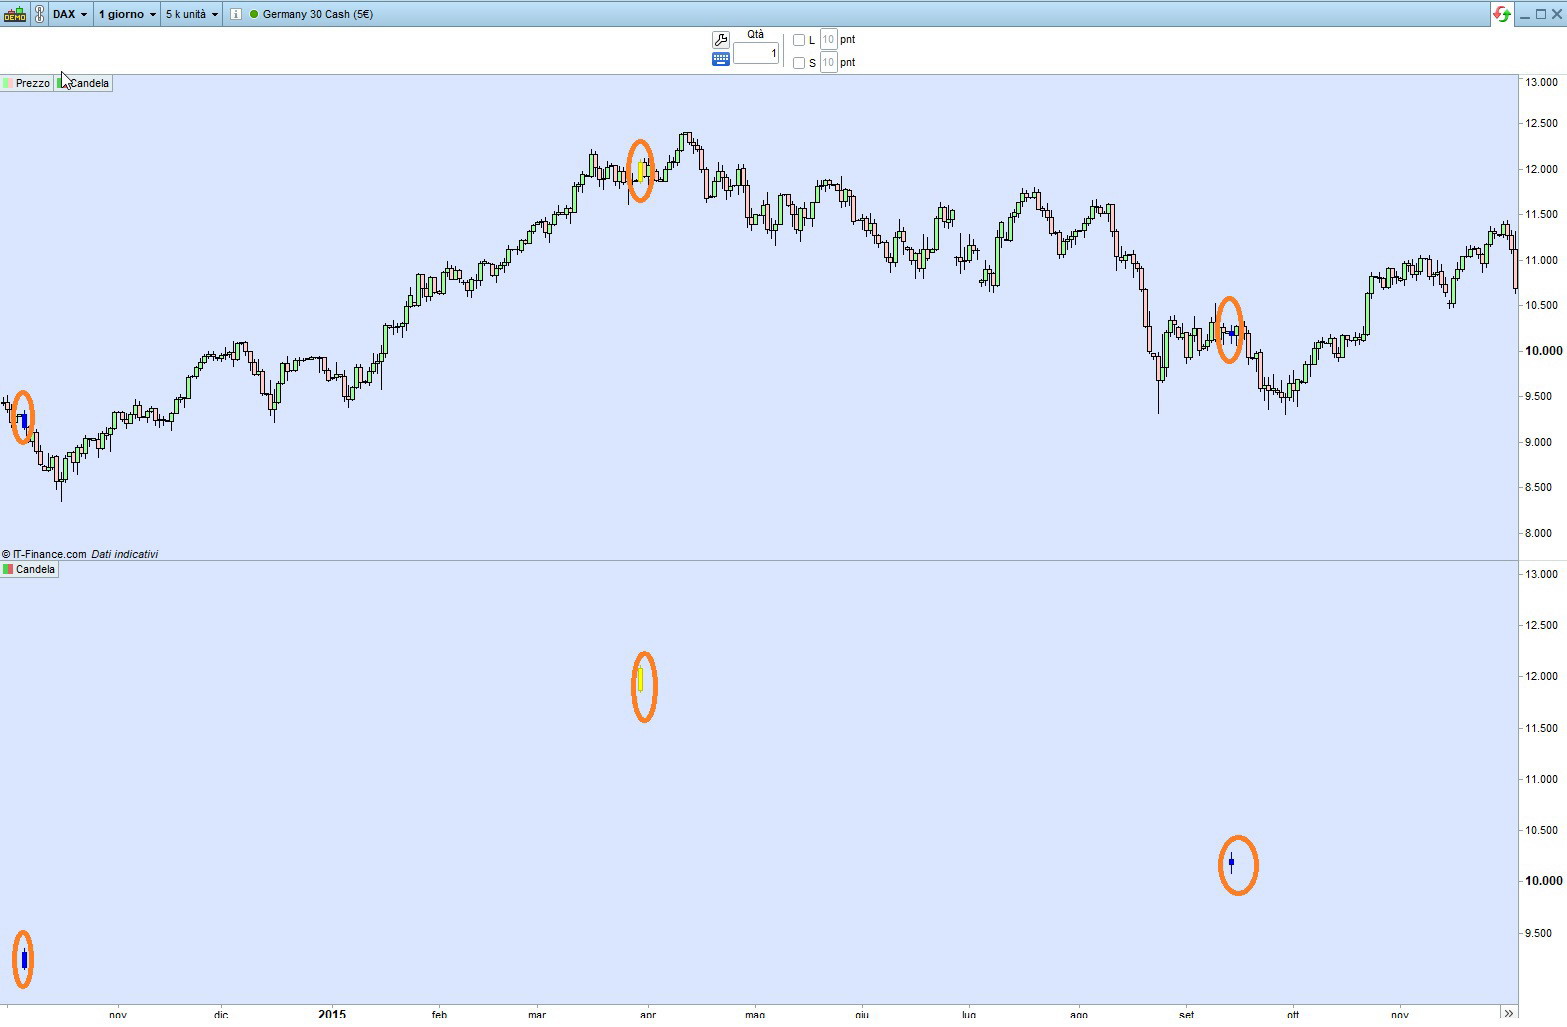
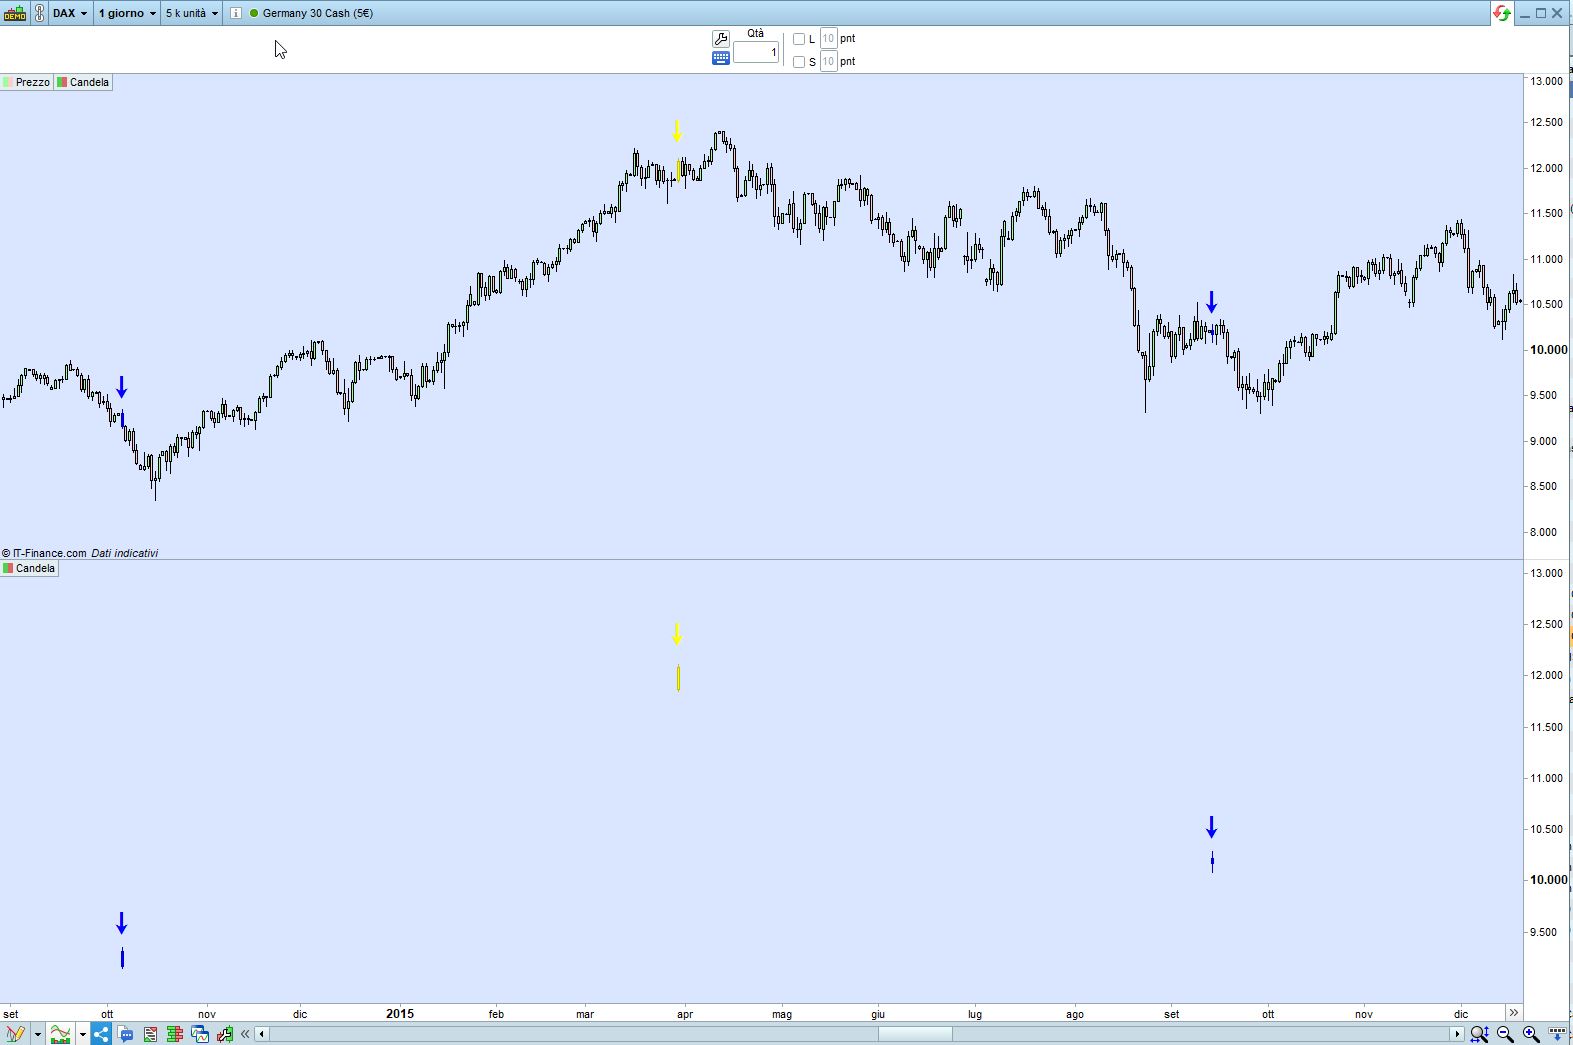
plotshape(foundBullish and timeframeEnabled,title=”BullEng Shape”, style=shape.triangleup, location=location.belowbar, color=#66ff00, text=”BullE”, size=size.auto, offset=-1)
barcolor(foundBullish and timeframeEnabled? color.yellow : na, title=”BullEng Bar Colour”, offset=-1)
//===============================================
//BEARISH ENGULFING
//===============================================
//# of bars back (left) to compare the Engulfing Candle’s high and low
bearPeriodLookBackHighs = input(title=”BearEng Highs Look-back period”, minval=1, type=input.integer, defval=1)
bearPeriodLookBackLows = input(title=”BearEng Lows Look-back period”, minval=1, type=input.integer, defval=1)
// Calculate highest high comparing 1st historic candle with the look-back period
bearHiHighs = highest(high, bearPeriodLookBackHighs)[2]
// Calculate lowest low comparing 1st historic candle with the look-back period
bearLowLows = lowest(low, bearPeriodLookBackLows)[2]
//Candle must close BELOW prev candle low AND candle high is higher than the highest high for the look-back period (bearHiHighs) AND candle low is lower than look-back period for the lowest low (bearLowLows)
isBearishEngulfing() =>
close[1] < low[2] and high[1] > bearHiHighs and low[1] < bearLowLows
foundBearish = isBearishEngulfing()
//Display on chart
plotshape(foundBearish and timeframeEnabled, title=”BearEng Shape”, style=shape.triangledown, location=location.abovebar, color=color.red, text=”BearE”, size=size.auto, offset=-1)
barcolor(foundBearish and timeframeEnabled? color.blue: na, title=”BearEng Bar Colour”, offset=-1)
//===========================================
//Display the current time-frame (in minutes) when the alert triggers
//
// Function below is courtesy of PineCoders MTF script
// ————— Converts current “timeframe.multiplier” plus the TF into minutes of type float.
f_resInMinutes() =>
_resInMinutes = timeframe.multiplier * (
timeframe.isseconds ? 1. / 60. :
timeframe.isminutes ? 1. :
timeframe.isdaily ? 1440. :
timeframe.isweekly ? 10080. :
timeframe.ismonthly ? 43800. : na)
// Plot value of the marker’s number without disrupting indicator scale. This doesn’t plot anything in
// CAVEAT: If multiple markers fire simultaneously, only one will be detected.
markerNo = f_resInMinutes()
plotchar(markerNo, “PeriodTF”, “”, location.top)
//===============================================
// Plot timeframe period in the alert
alertcondition(foundBullish, title = “Bullish Eng”, message = ‘{{plot(“PeriodTF”)}} min ‘ + “BullEng”)
alertcondition(foundBearish, title = “Bearish Eng”, message = ‘{{plot(“PeriodTF”)}} min ‘ + “BearEng”)
alertcondition(open==close, title = “DOJI”, message = ‘{{plot(“PeriodTF”)}} min ‘ + ” Doji”)