I was able to do what I think aldtrading wants :
Have one Stats form from a first situation. The Results List is onscreen, but is not related to further outcomes that I can see.
- Start a random backtest from “a” TF. Result List appears. Stats form appears as well.
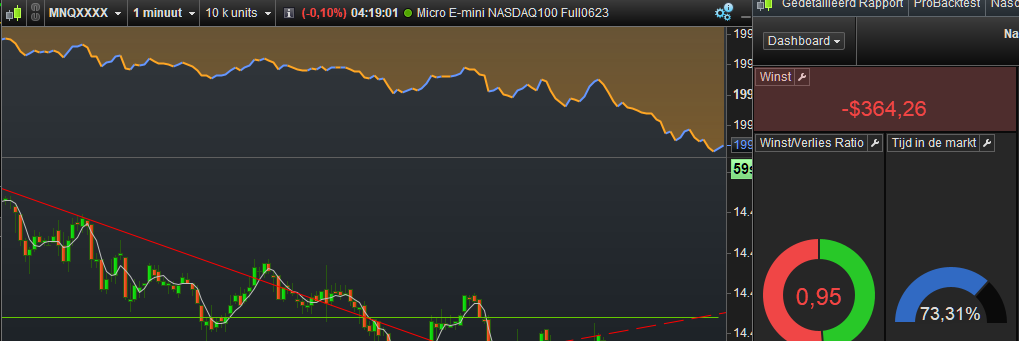
- Change the TF of the Chart. A new Stats form appears and it is relevant (it makes sense regarding my changes).
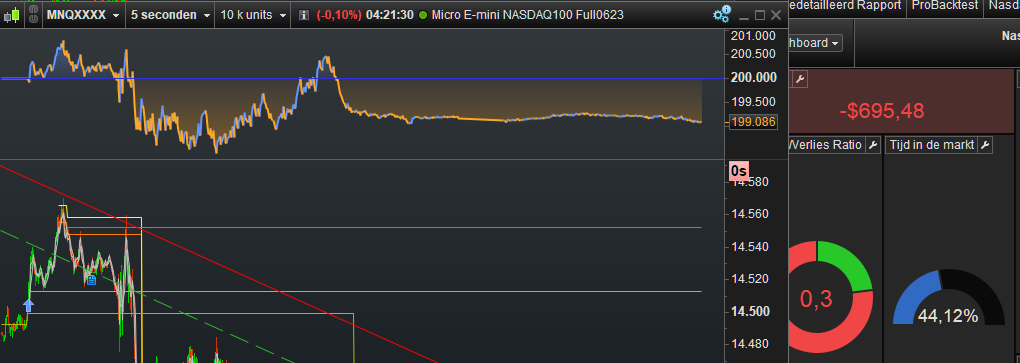
- Again a new TF on the Chart and again a relevant new Stats form appears.
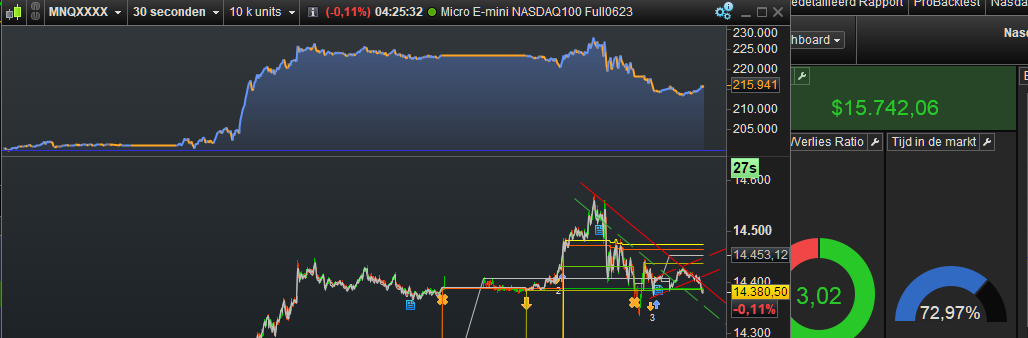
- Back and forth to the various TFs on the Chart and it keeps on working.
In each situation the Result List remains as it is. So only a first time it appears, but in the end is not important. Cross is away and all keeps on working as I told above.
When I do something wrong, like entering a TF with which the Strategy can’t deal (per error message), then I need to remove the backtest from the chart (label in the top (equity curve) and restart the backtest.
Having the backtest iterate over something, did not change the situation.
I think it is crucial that the Stats form appears automatically a first time. Thus e.g. (in extremo) restart the platform, clean the chart from previous backtests (or else it will have shown a Stats list already), apply the backtest – Result List shows and Stats from appears after that (no clicking).
It seems that it all depends on that it depends on how you start out with it. I mean, yesterday I tried it briefly too, and then I could not do it. Today it would not fail on me.
<hr />
I am pretty sure that clicking on lines in the Result List for different (revisiting of) results, will kill the situation. You can just sense this, because the Stats form is not related to the Result List, unless you want to see it such that a first line ever listed in there, is the line it showed in the Stats form. This would just be coincidental, just like changing the TF in the Chart will show a Stats form which never is related to the Result List – obviously, because you never ran a backtest from that TF.
The last part of the last sentence, is crucial I think.
All would behave like you just start the platform and it presents you the virtual backtest results of the backtest bound to the Chart, as visible in the top of the Chart.
In order for possible better understanding, I also notice this :
If the Backtest would output Graph / GraphOnPrice, then all what I did (see bullet points above) never will show graphing data on the chart. This, while clicking in the Result list surely would impose that. Thus, it is an entirely different situation. Thus also, as soon as you urge the platform to show graphing data as well, you’re on the wrong foot (somehow).
Compare this with the dreaded Stats form that usually appears after starting the platform and that old backtest still bound, and you will see that this never imposes graph data on the chart. So you must lure it into that same situation. And what the TF is on that moment, is unimportant (usually it is 10K, but set it to less at saving and it will do that less (and show it on the Stats form).
Did we learn something from this ? I personally not really. It is not even a hidden feature. It can work by coincidence and how to exploit that ? no clue. And @altrading, I am afraid that you too will say “oh, if it works like that it is useless for me”. And that could be the point, I’m afraid; you had something working in a coincidental situation which suited you. But it is/was not by design and therefore no rights can be claimed over it. However :
It could be the idea to write out what you’d functionally want with this, so PRT development can consider it as a nice feature and make it formal and always working; would you do that in this topic, they readily have a nice reference on the why of it.
Lastly, you might consider this :
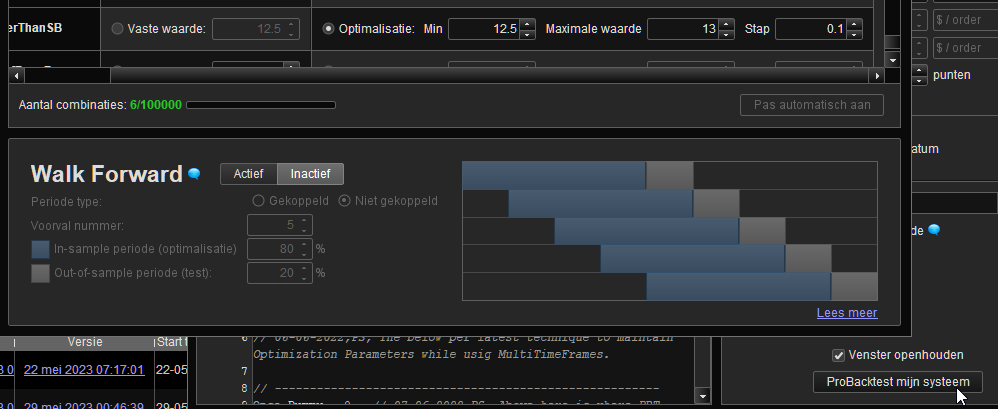
Changing the TF of the chart, would normally lead to a different result because the time period changes with it. Thus, I was testing with 1m vs 10s vs 15s because the system I was testing with did not accept other multiples. This means that I should have set the Starting Date in the backtest such, that I would limit all to the smallest TF, hence 10 seconds.
This feels odd and is at least nothing I ever did with a “real time” comparison. Now, if you did not realize this, something else could be amiss (incurring that you could not do what you expect it do do, or what by coincidental constraints coincidentally worked at first).
OK, you got that. Now, how would you be able to click in various Result list lines incurring for different TFs while the Chart does not change its TF from that clicking ? It really does not, you know. 🙂 And it *has* to or else the graphing (Graph / GraphOnPrice) would not work out.
Pfff ?