Hello, I’m trying to figure out how this detailed report works, a couple days ago after I finished optimizing my variables in 100K bars and got my Optimization Report array displayed, I just had to click on one line in this report, wait for it to load on my chart and display the Detailed Report, then I just had to change the Chart Time Frame from 100K bars to 200K bars for the Detailed Report (still opened) to be automatically refreshed with the new extended data.
Now when I switch to 200K bars, a loading bar appears and then a new line is added to the Optimization Report with the new data, so now I have to search for the line and click on it for my Detailed Report to be refreshed with the wanted data.
How can I go back to the first behavior ? This doesn’t seem like a big deal but when you have to review dozens of lines wasted time adds up real quick.. 😄
Also it was useful to be able to check how a specific optimization was performing on 200k bars while the Optimization was still processing, now in the second case, I will have to wait for the optimization to end before being able to load the 200K bars data
It is ProRealTime v11.1 – 1.8.0_202 if it changes anything..
I think something is bugged, since on my chart when checking Price Properties, no ProBackTest script is attached to it, but when modifying the timeframe, the Optimization Report shows up.
Is there another way than removing it from Price Properties to reset/release/remove all current ProBackTest scripts?
Resolved : My bad, there was still a P&L curve hidden at the top of my chart, which explains my issues
To come back to my original issue, if it can lead to something, the only slightly exotic thing I’ve done in the meantime was test the “Walk Forward” function, it might have modified a loading data parameter in PRT.. Not sure how to reset that
I will have to wait for the optimization to end before being able to load the 200K bars data
I do above and it shows how the optimised values (opti’d over 100K bars) perform over 200K bars.
Also it was useful to be able to check how a specific optimization was performing on 200k bars while the Optimization was still processing
I just tried above on my platform and it does NOT result in (Quote from your OP) …
“a new line is added to the Optimization Report with the new data”
So it appears that you are doing something weird or …mmm I’ll keep thinking! 🙂
so now I have to search for the line and click on it for my Detailed Report to be refreshed with the wanted data.
Please post a screen shot of the 200K opti data mixed in with the 100K opti data.
I am expecting above (from what you say) to show the same opti variable values. but a different value for Gain, but within one Opti Results Table (you refer to as array in your OP).
I will do it later but that’s exactly as you stated :
show the same opti variable values. but a different value for Gain, but within one Opti Results Table (you refer to as array in your OP)
Also different values for %gain and everything, just the same variables
I don’t understand what I could have done that changed from a few days ago 🤔 have you tried to do it after a Walk Forward? I guess you already used the Walk Forward function anyway..
Also different values for %gain and everything, just the same variables
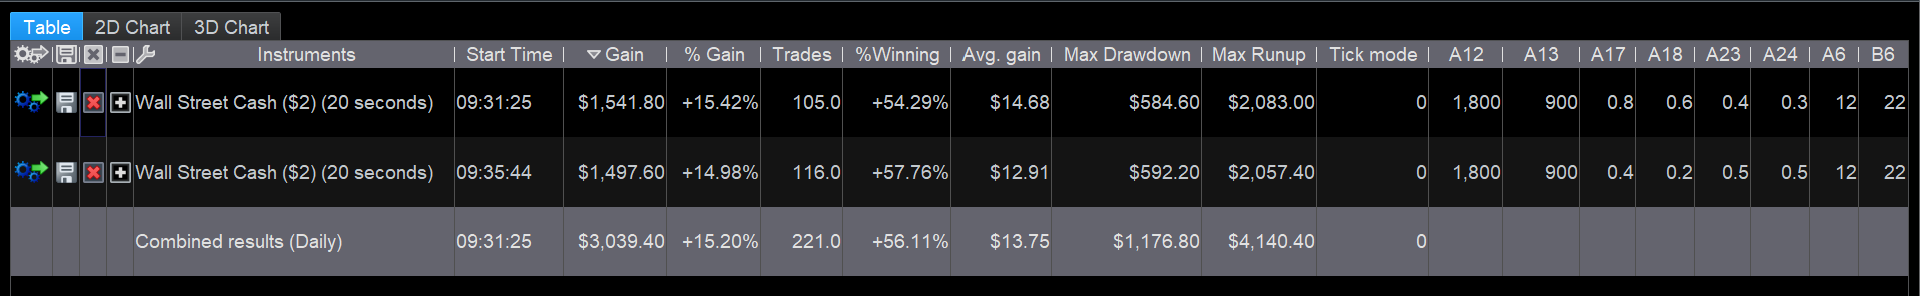
I suspect that you are seeing the different values across 2 different Tables.
To illustrate … attached is 2 different Tables … see the start Times, 09:31 and 09:35.
Do you have ‘Time’ selected as a column header in your Opti Tables?
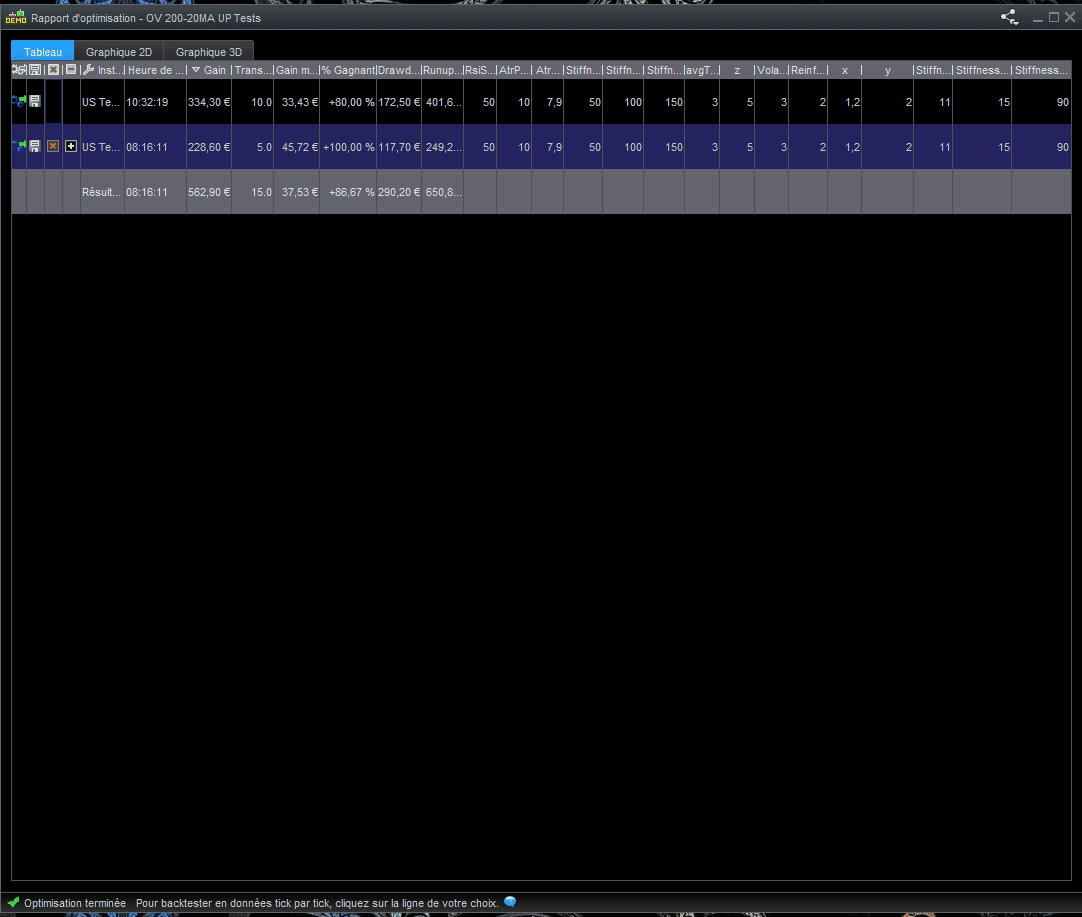
Here it is, first I had the array filled with the data from the 100K optimization.
Then I changed the chart from 100k bars to 200k bars, a first loading bar appeared on the chart (loading candles), then once finished, a bar appeared on the Optimization Report attached (loading optimization data) and the first line of the picture was added in the array.
I suspect that you are seeing the different values across 2 different Tables.
To illustrate … attached is 2 different Tables … see the start Times, 09:31 and 09:35.
Do you have ‘Time’ selected as a column header in your Opti Tables?
That is exactly the problem, it shouldn’t create a new table (a table of one line with the line’s variables I clicked on in the 100k bars table, here) but only load the data on the chart..
the first line of the picture was added in the array.
The first line at 10:32 is a new set of data values optimised for 200K bars.
The set of values showing time 08:16 are for 100K opti. Click on the + sign and you will see all the possible values for your varaiables.
What you are experiencing is normal behaviour same as we all get.
it shouldn’t create a new table (a table of one line
I agree, now I am begining to understand your problem … see what a difference 1 screenshot (you posted) has made to the understanding of readers (me!) … a picture tells a thouand words and all that. 😉
Are you 100% sure you only have 1 line time at 10:32??
Is it not that, for some obscure reason, the + is not showing and therefore you are not able to show / see the other lines??
The thing is, it didn’t do that a few days back on my end.
PRT created new sets of data only when I clicked on “Backtest my trading system” but not automatically when I only changed the timeframe to see how the current line (with specific variables) I’m analyzing is doing on a longer timeframe.
Is it really the normal behavior?
I agree, now I am begining to understand your problem … see what a difference 1 screenshot has made to the understanding oif readers … a picture tells a thouand words and all that. 😉
Are you 100%sure you only have 1 line?? Is it not that, for some obscure reason, the + is not showing and therefore you are not able to show / see the other lines??
Yeah I probably should have added a picture, as well as make my OP clearer..
Yes I’m sure, it only loads this line (related to the line I clicked on in the 100k bars optimization table)
No … getting 1 line only is not normal behaviour.
Are you 100% sure you only have 1 line time at 10:32??