That’s what I expected, a detailed explanation of how those tags are born and their progression.
Pics are not important, as they change and form different patterns each time. Only text can set the rules (pics may help, though).
That’s a good start, despite it’s seems not to be the same rules that have formed the pics. The rules you posted DO NOT produce the patterns in your pics, there’s more rules that are missing, I guess.
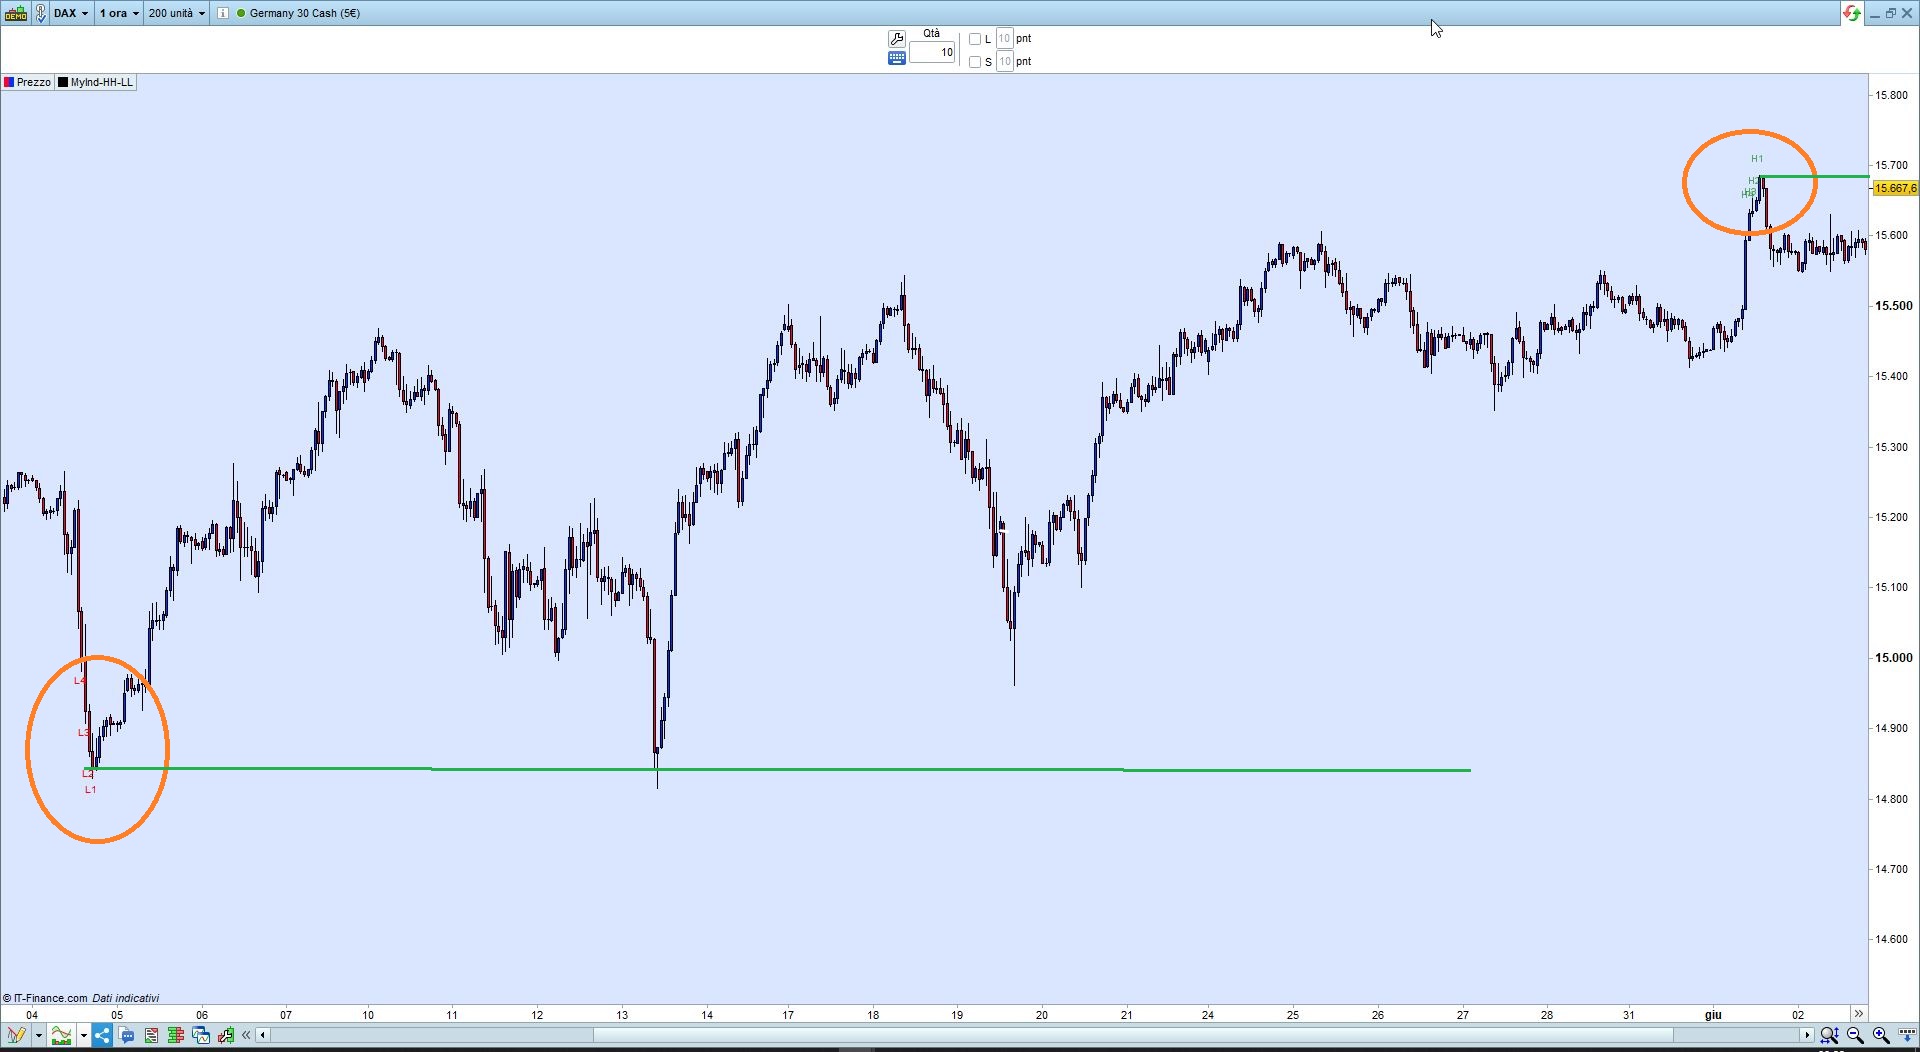
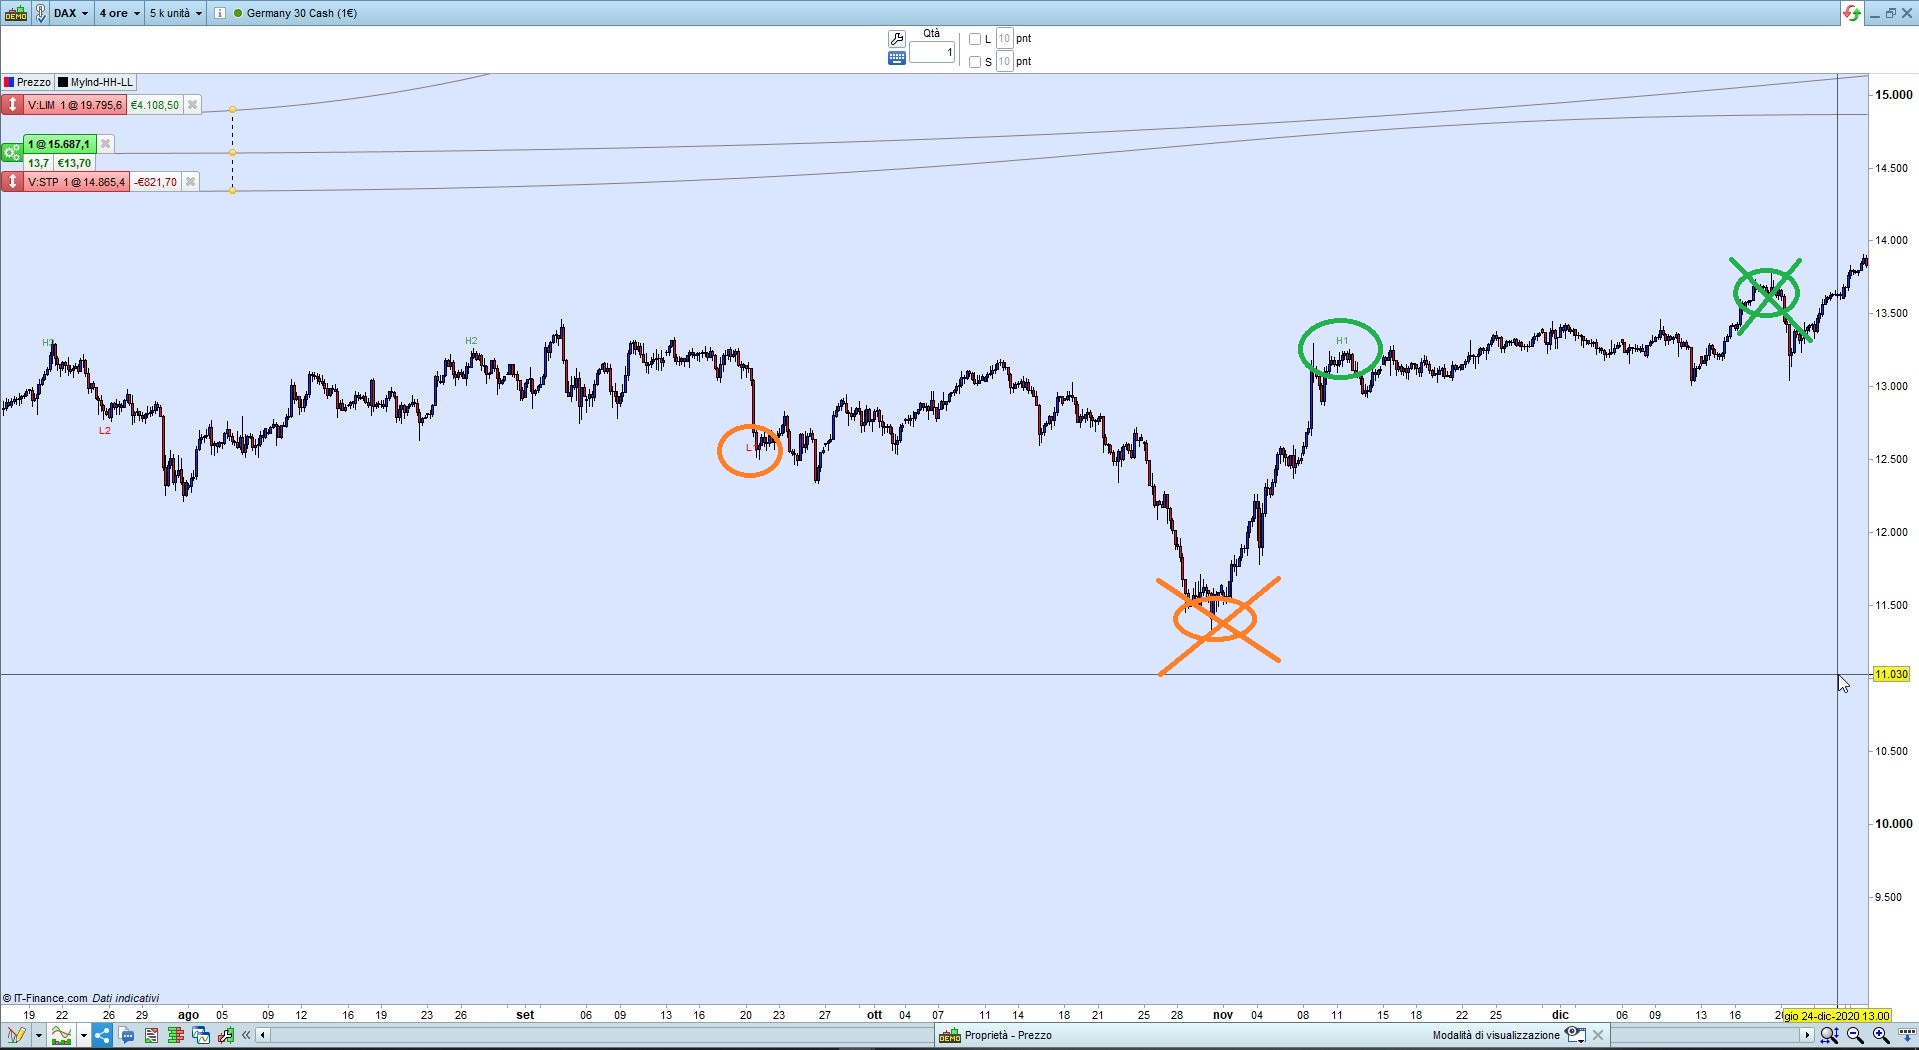
As you can see at some points there are NO MORE higher highs and NO MORE lower lows, so those tags are likely to sit there for a long time (pic X).
Moreover, they do not appear to behave the way your pics do, they are much similar to a ladder (pic Y).
I am waiting for additional rules to make the code adhere to your pics.
//At the start of the indicator H1 = 0 and L1 = 0
//
//Evaluate on each period close;
//If Current Close > Previous Close AND If Current Close > H1 THEN Current Close = H1
//AND the old H1 becomes H2, the old H2 becomes H3, the old H3 becomes H4
//
//If Current Close < Previous Close AND Current Close < H1 THEN Current Close = L1
//AND the old L1 becomes L2, the old L2 becomes L3, the old L3 becomes L4
//
DEFPARAM DrawOnLastBarOnly   = True
DEFPARAM CalculateOnLastBars = 1000
N = 4                               //4  number of tags (for each side)
// initialize arrays
IF BarIndex = 0 THEN
   FOR i = 1 TO N
      $hh[i]    = 0
      $hhBar[i] = 0
      $ll[i]    = 9999999
      $llBar[i] = 0
   NEXT
ENDIF
// check higher highs
IF (close > close[1]) AND (close > $hh[1]) THEN
   FOR i = N DOWNTO 2
      $hh[i]    = $hh[i - 1]
      $hhBar[i] = $hhBar[i - 1]
   NEXT
   $hh[1]    = close
   $hhBar[1] = BarIndex
ENDIF
// check lower lows
IF (close < close[1]) AND (close < $ll[1]) THEN
   FOR i = N DOWNTO 2
      $ll[i]    = $ll[i - 1]
      $llBar[i] = $llBar[i - 1]
   NEXT
   $ll[1]    = close
   $llBar[1] = BarIndex
ENDIF
// plot tags
FOR i = 1 TO N
   IF $hh[i] <> 0 THEN
      DrawText("H#i#",$hhBar[i],$hh[i] + range) coloured(0,128,0,160)
   ENDIF
   IF $ll[i] <> 9999999 THEN
      DrawText("L#i#",$llBar[i],$ll[i] - range) coloured(255,0,0,255)
   ENDIF
NEXT
RETURN
Thank you Roberto,
I understand and it is quite difficult to elicit the requirements in words. Leave this with me for a while and I will try to figure out all the if statements and nested if statements to try and achieve what I am trying to do. I am away for a few days but will respond as soon as I have some additions. Thanks again for your time and help on this, I am starting to see how powerful this platform can be and really appreciate it.
Have a great weekend.
Hi Roberto,
I hope you had a good weeeknd, I will try and explain further the logic.
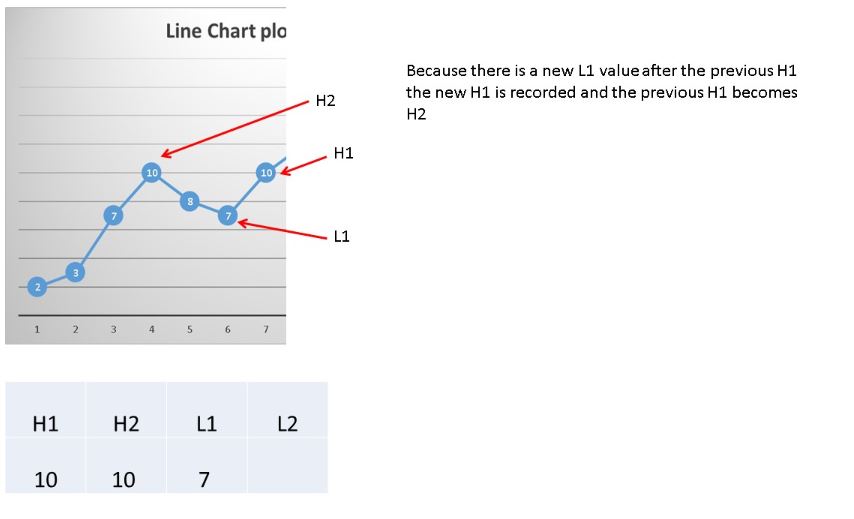
Only when there is a new L1 after the previous H1, the new H1 is recorded and the previous H1 becomes H2 (see pic 1 – slide 8)
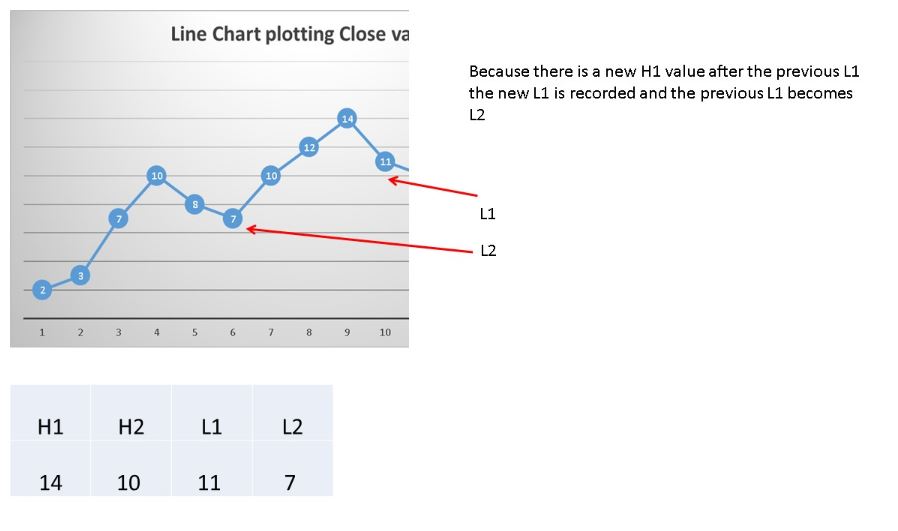
Only when there is a new H1 after the previous L1, the new L1 is recorded and the previous L1 becomes L2 (see pic 2 – slide 11)
The pictures attached are based on the close price of each period and as can be seen in pic 2 – slide 11 L1 is at a higher price than L2, this is ok and it is fine to have a higher low just as fine to have a lower high for H1.
I hope that this clarifies the remaining logic, please let me know any questions remaining?
Thanks again for your time on this.
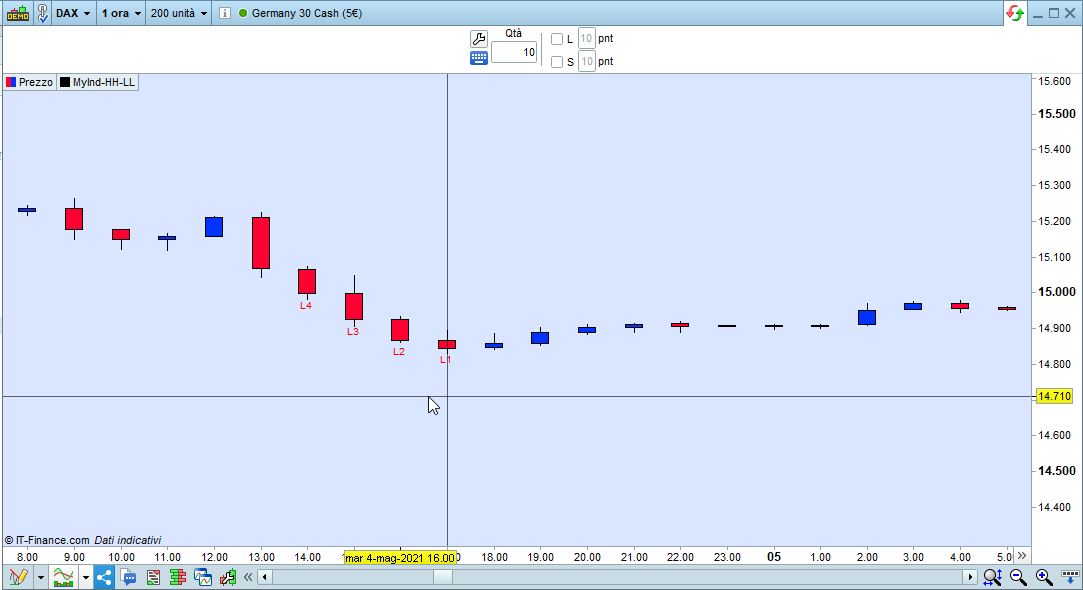
As you can see from the attached pic, it now plots a new Hn tag after there’s been a Ln occurrence and viceversa.
The result is that after L1 there is a new lower low, but it isn’t plotted because there hasn’t been any new high in between.
The same occurs with H1, as the nexr new high is not recorded as there was no new low in between.
I wrote this version based on the indicator https://www.prorealcode.com/prorealtime-indicators/pivot-support-resistance-zones/:
the first one plots LL and HH tags alternatevely:
DEFPARAM DrawOnLastBarOnly   = True
//DEFPARAM CalculateOnLastBars = 1000
//-------------------------------------------------------------------------------
ONCE Flag = 0                            //1=new High,  -1=new Low
ONCE N    = 4                            //4  number of tags (for each side)
// initialize arrays
IF BarIndex = 0 THEN
FOR i = 1 TO N
$hh[i]    = 0
$hhBar[i] = 0
$ll[i]    = 9999999
$llBar[i] = 0
NEXT
ENDIF
//-------------------------------------------------------------------------------
// https://www.prorealcode.com/prorealtime-indicators/pivot-support-resistance-zones/
PivotBAR     = 2                      //2  bars AFTER  pivot
LookBack     = 4                      //3  bars BEFORE pivot
BarLookBack  = PivotBAR + 1
IF close[PivotBAR] < lowest[LookBack](close)[BarLookBack] THEN
IF close[PivotBAR] = lowest[BarLookBack](close) AND Flag >= 0 THEN
FOR i = N DOWNTO 2
$ll[i]    = $ll[i - 1]
$llBar[i] = $llBar[i - 1]
NEXT
$ll[1]    = close[PivotBAR]
$llBar[1] = BarIndex[PivotBAR]
Flag      = -1
ENDIF
ENDIF
IF close[PivotBAR] > highest[LookBack](close)[BarLookBack] AND Flag <= 0 THEN
IF close[PivotBAR]  = highest[BarLookBack](close) THEN
FOR i = N DOWNTO 2
$hh[i]    = $hh[i - 1]
$hhBar[i] = $hhBar[i - 1]
NEXT
$hh[1]    = close[PivotBAR]
$hhBar[1] = BarIndex[PivotBAR]
Flag = 1
ENDIF
ENDIF
//-------------------------------------------------------------------------------
// plot tags
FOR i = 1 TO N
IF $hh[i] <> 0 THEN
DrawText("H#i#",$hhBar[i],$hh[i] + range) coloured(0,128,0,160)
ENDIF
IF $ll[i] <> 9999999 THEN
DrawText("L#i#",$llBar[i],$ll[i] - range) coloured(255,0,0,255)
ENDIF
NEXT
RETURN
the second one is the same, as above, but it plots tags as they occur:
DEFPARAM DrawOnLastBarOnly   = True
//DEFPARAM CalculateOnLastBars = 1000
//-------------------------------------------------------------------------------
ONCE N    = 4                            //4  number of tags (for each side)
// initialize arrays
IF BarIndex = 0 THEN
FOR i = 1 TO N
$hh[i]    = 0
$hhBar[i] = 0
$ll[i]    = 9999999
$llBar[i] = 0
NEXT
ENDIF
//-------------------------------------------------------------------------------
// https://www.prorealcode.com/prorealtime-indicators/pivot-support-resistance-zones/
PivotBAR     = 2                      //2  bars AFTER  pivot
LookBack     = 4                      //3  bars BEFORE pivot
BarLookBack  = PivotBAR + 1
IF close[PivotBAR] < lowest[LookBack](close)[BarLookBack] THEN
IF close[PivotBAR] = lowest[BarLookBack](close) THEN
FOR i = N DOWNTO 2
$ll[i]    = $ll[i - 1]
$llBar[i] = $llBar[i - 1]
NEXT
$ll[1]    = close[PivotBAR]
$llBar[1] = BarIndex[PivotBAR]
ENDIF
ENDIF
IF close[PivotBAR] > highest[LookBack](close)[BarLookBack] THEN
IF close[PivotBAR]  = highest[BarLookBack](close) THEN
FOR i = N DOWNTO 2
$hh[i]    = $hh[i - 1]
$hhBar[i] = $hhBar[i - 1]
NEXT
$hh[1]    = close[PivotBAR]
$hhBar[1] = BarIndex[PivotBAR]
ENDIF
ENDIF
//-------------------------------------------------------------------------------
// plot tags
FOR i = 1 TO N
IF $hh[i] <> 0 THEN
DrawText("H#i#",$hhBar[i],$hh[i] + range) coloured(0,128,0,160)
ENDIF
IF $ll[i] <> 9999999 THEN
DrawText("L#i#",$llBar[i],$ll[i] - range) coloured(255,0,0,255)
ENDIF
NEXT
RETURN
Hi Roberto,
I think I may have identified where I have not been clear. I have copied your response form above and will highlight where I think the confusion has come from.
Your message;As you can see from the attached pic, it now plots a new Hn tag after there’s been a Ln occurrence and viceversa.
The result is that after L1 there is a new lower low, but it isn’t plotted because there hasn’t been any new high in between.
My comment – There has been new high (close at a higher price than the lower low), there has not been a new highest high and we do not need to evaluate on highest high. If you can evaluate that in the code then this will be working as expected.
The same occurs with H1, as the next new high is not recorded as there was no new low in between. – as above comment – we dont need to evaluate against new lowest low, we need to evaluate at any close less than h1 has happened.
I hope that makes sense, it is really difficult to explain these things sometimes but I think we are there now.
Thanks agan for taking time to help on this.
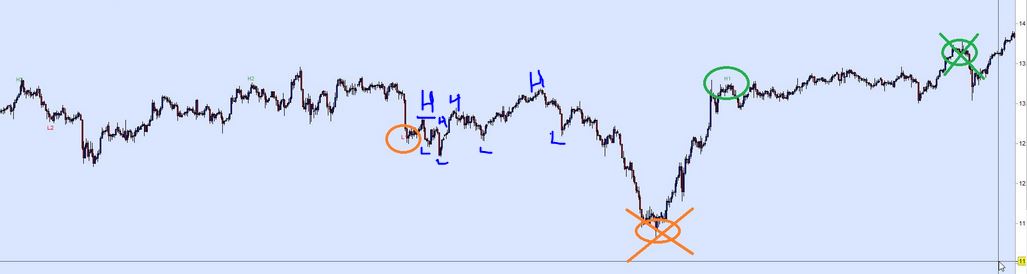
I have used your example chart to illustrate what I mean by marking up a few examples of the highs and lows and explain a bit more here;
on each close we are evaluating for a higher close (not the highest close).
if the close is a higher close then that has the H1 label
same for each close evaluation so it is quite possible to have several bars where the H1 just goes on each new bar which close is > prev close. Once the close is lower than previous close then it has the L1 label and if the next close < prev close then L1 and so on.
In your examples you mention Pivot points, is this where the market changes direction from mini down trend to mini uptrend?
Thanks, I hope this makes things clearer.
Sorry, but the Highs you marked in blue are NOT higher than H2 and H1 on the left side of the chart. The one higher than H2 (and showing a new Low in between) is H3 on the right.
What I am asking you is not pics, because CODE cannot deal with pics., it has to follow plain text rules. That’s the only thing I need, the rules that I can turn into code.
Hi Roberto, I will try to explain only with words as requested.
A high does not have to be higher than the last highest high.
You can have a higher high and you can also have a lower high.
A low does not need to be lower than the lowest low
You can have a higher low and a lower low
I am trying to identify and label every high and low that fits the 4 criteria below;
Where a close is higher than the previous close and higher than the previous high it is a higher high
Where a close is higher than the previous close and lower than the previous high it is a lower high
Where a close is lower than the previous close and lower than the previous low it is a lower low
Where a close is lower than the previous close and higher than the previous low it is a higher low
I hope that clarifies the requirement.
Many thanks
There you go (you may want to test it on a 5 or 10-second TF to see how it changes quickly):
//--------------------------------------------------------------------------------------------
//I am trying to identify and label every high and low that fits the 4 criteria below;
//
//Where a close is higher than the previous close and higher than the previous high it is a higher
//                 high
//Where a close is higher than the previous close and lower than the previous high it is a lower high
//Where a close is lower than the previous close and lower than the previous low it is a lower low
//Where a close is lower than the previous close and higher than the previous low it is a higher low
//--------------------------------------------------------------------------------------------
//
DEFPARAM DrawOnLastBarOnly   = True
//DEFPARAM CalculateOnLastBars = 1000
//-------------------------------------------------------------------------------
ONCE N    = 4                            //4  number of tags (for each side)
// initialize arrays
IF BarIndex = 0 THEN
FOR i = 1 TO N
$hh[i]    = 0              //Higher High
$hhBar[i] = 0
$lh[i]    = 0              //Lower  High
$lhBar[i] = 0
$ll[i]    = 9999999        //Lower  Low
$llBar[i] = 0
$hl[i]    = 9999999        //Higher Low
$hlBar[i] = 0
NEXT
ENDIF
//-------------------------------------------------------------------------------
// check higher highs
IF (close > close[1]) AND (close > $hh[1]) THEN
FOR i = N DOWNTO 2
$hh[i]    = $hh[i - 1]
$hhBar[i] = $hhBar[i - 1]
NEXT
$hh[1]    = close
$hhBar[1] = BarIndex
//-------------------------------------------------------------------------------
// check lower highs
ELSIF (close > close[1]) AND (close <= $hh[1]) THEN
FOR i = N DOWNTO 2
$lh[i]    = $lh[i - 1]
$lhBar[i] = $lhBar[i - 1]
NEXT
$lh[1]    = close
$lhBar[1] = BarIndex
//-------------------------------------------------------------------------------
// check lower lows
ELSIF (close < close[1]) AND (close < $ll[1]) THEN
FOR i = N DOWNTO 2
$ll[i]    = $ll[i - 1]
$llBar[i] = $llBar[i - 1]
NEXT
$ll[1]    = close
$llBar[1] = BarIndex
//-------------------------------------------------------------------------------
// check higher lows
ELSIF (close < close[1]) AND (close >= $ll[1]) THEN
FOR i = N DOWNTO 2
$hl[i]    = $hl[i - 1]
$hlBar[i] = $hlBar[i - 1]
NEXT
$hl[1]    = close
$hlBar[1] = BarIndex
ENDIF
//-------------------------------------------------------------------------------
// plot tags
FOR i = 1 TO N
// plot higher highs
IF $hh[i] <> 0 THEN
DrawText("HH#i#",$hhBar[i],$hh[i] + range*i) coloured(0,128,0,160)
ENDIF
// plot lower highs
IF $lh[i] <> 0 THEN
DrawText("LH#i#",$lhBar[i],$lh[i] + range*i) coloured(0,128,0,160)
ENDIF
// plot lower lows
IF $ll[i] <> 9999999 THEN
DrawText("LL#i#",$llBar[i],$ll[i] - range*i) coloured(255,0,0,255)
ENDIF
// plot higher lows
IF $hl[i] <> 9999999 THEN
DrawText("HL#i#",$hlBar[i],$hl[i] - range*i) coloured(255,0,0,255)
ENDIF
NEXT
RETURN
Thanks Roberto, I think it looks like it is calculating the right levels now but I don’t see the values on the respective bars any longer (1 minute chart), they all seem to be at the far right of the screen as shown in the attachment. Is this a config setting on my system possibly?
I’ll have a look at it next early week.
This is going to plot a little better, but it seems not possible to plot perfectly:
//--------------------------------------------------------------------------------------------
//I am trying to identify and label every high and low that fits the 4 criteria below;
//
//Where a close is higher than the previous close and higher than the previous high it is a higher
//                 high
//Where a close is higher than the previous close and lower than the previous high it is a lower high
//Where a close is lower than the previous close and lower than the previous low it is a lower low
//Where a close is lower than the previous close and higher than the previous low it is a higher low
//--------------------------------------------------------------------------------------------
//
DEFPARAM DrawOnLastBarOnly   = True
//DEFPARAM CalculateOnLastBars = 1000
//-------------------------------------------------------------------------------
ONCE N      = 4                          //4  number of tags (for each side)
ONCE Offset = 1                          //0, 1, etc...  ID of the bar uset to check prices
ONCE LO     = 0
ONCE HI     = 0
// initialize arrays
IF BarIndex = 0 THEN
FOR i = 1 TO N
$hh[i]    = 0              //Higher High
$hhBar[i] = 0
$lh[i]    = 0              //Lower  High
$lhBar[i] = 0
$ll[i]    = 9999999        //Lower  Low
$llBar[i] = 0
$hl[i]    = 9999999        //Higher Low
$hlBar[i] = 0
NEXT
ENDIF
//IF BarIndex <> BarIndex[1] THEN
//-------------------------------------------------------------------------------
// check higher highs
IF (close[Offset] > close[Offset+1]) AND (close[Offset] > $hh[1]) AND HI = 0 AND BarIndex <> $hhBar[1] THEN
FOR i = N DOWNTO 2
$hh[i]    = $hh[i - 1]
$hhBar[i] = $hhBar[i - 1]
NEXT
$hh[1]    = close[Offset]
$hhBar[1] = BarIndex[Offset]
HI = 1
LO = 0
//-------------------------------------------------------------------------------
// check lower lows
ELSIF (close[Offset] < close[Offset+1]) AND (close[Offset] < $ll[1]) AND LO = 0 AND BarIndex <> $llBar[1] THEN
FOR i = N DOWNTO 2
$ll[i]    = $ll[i - 1]
$llBar[i] = $llBar[i - 1]
NEXT
$ll[1]    = close[Offset]
$llBar[1] = BarIndex[Offset]
HI = 0
LO = 1
//-------------------------------------------------------------------------------
// check lower highs
ELSIF (close[Offset] > close[Offset+1]) AND (close[Offset] < $hh[1]) AND HI = 0 AND BarIndex <> $lhBar[1] THEN
FOR i = N DOWNTO 2
$lh[i]    = $lh[i - 1]
$lhBar[i] = $lhBar[i - 1]
NEXT
$lh[1]    = close[Offset]
$lhBar[1] = BarIndex[Offset]
HI = 1
LO = 0
//-------------------------------------------------------------------------------
// check higher lows
ELSIF (close[Offset] < close[Offset+1]) AND (close[Offset] >= $ll[1]) AND LO = 0 AND BarIndex <> $hlBar[1] THEN
FOR i = N DOWNTO 2
$hl[i]    = $hl[i - 1]
$hlBar[i] = $hlBar[i - 1]
NEXT
$hl[1]    = close[Offset]
$hlBar[1] = BarIndex[Offset]
HI = 0
LO = 1
ENDIF
//-------------------------------------------------------------------------------
// plot tags
FOR i = 1 TO N
// plot higher highs
IF $hh[i] <> 0 THEN
DrawText("HH#i#",$hhBar[i],$hh[i] + range[Offset]*i) coloured(0,128,0,160)
ENDIF
// plot lower highs
IF $lh[i] <> 0 THEN
DrawText("LH#i#",$lhBar[i],$lh[i] + range[Offset]*i) coloured(0,128,0,160)
ENDIF
// plot lower lows
IF $ll[i] <> 9999999 THEN
DrawText("LL#i#",$llBar[i],$ll[i] - range[Offset]*i) coloured(255,0,0,255)
ENDIF
// plot higher lows
IF $hl[i] <> 9999999 THEN
DrawText("HL#i#",$hlBar[i],$hl[i] - range[Offset]*i) coloured(255,0,0,255)
ENDIF
NEXT
//ENDIF
RETURN
 Zigo
ZigoParticipant
Master
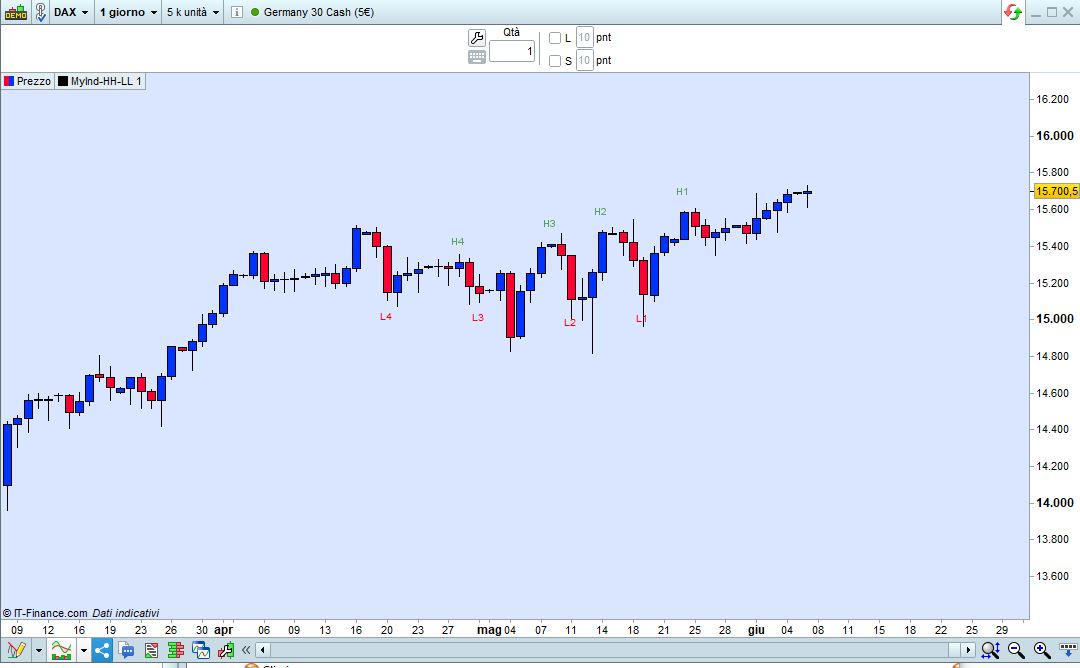
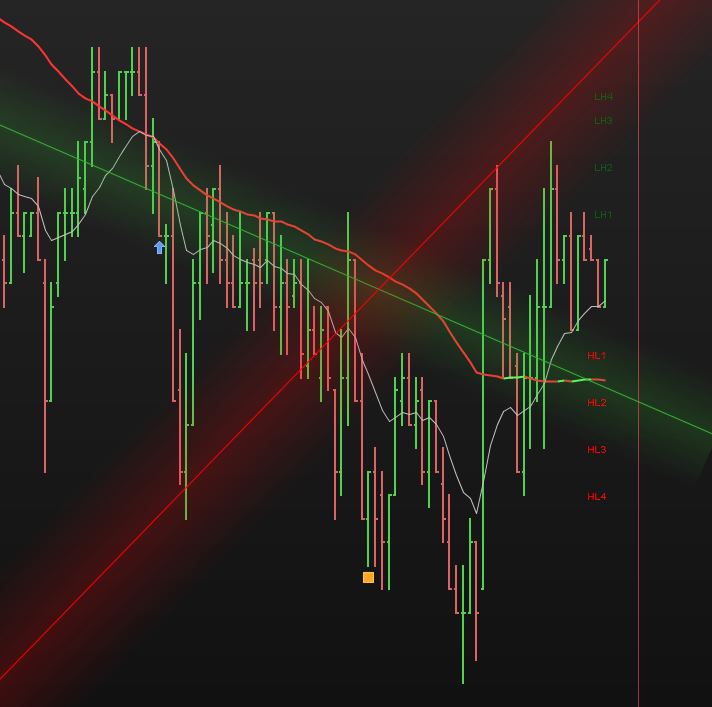
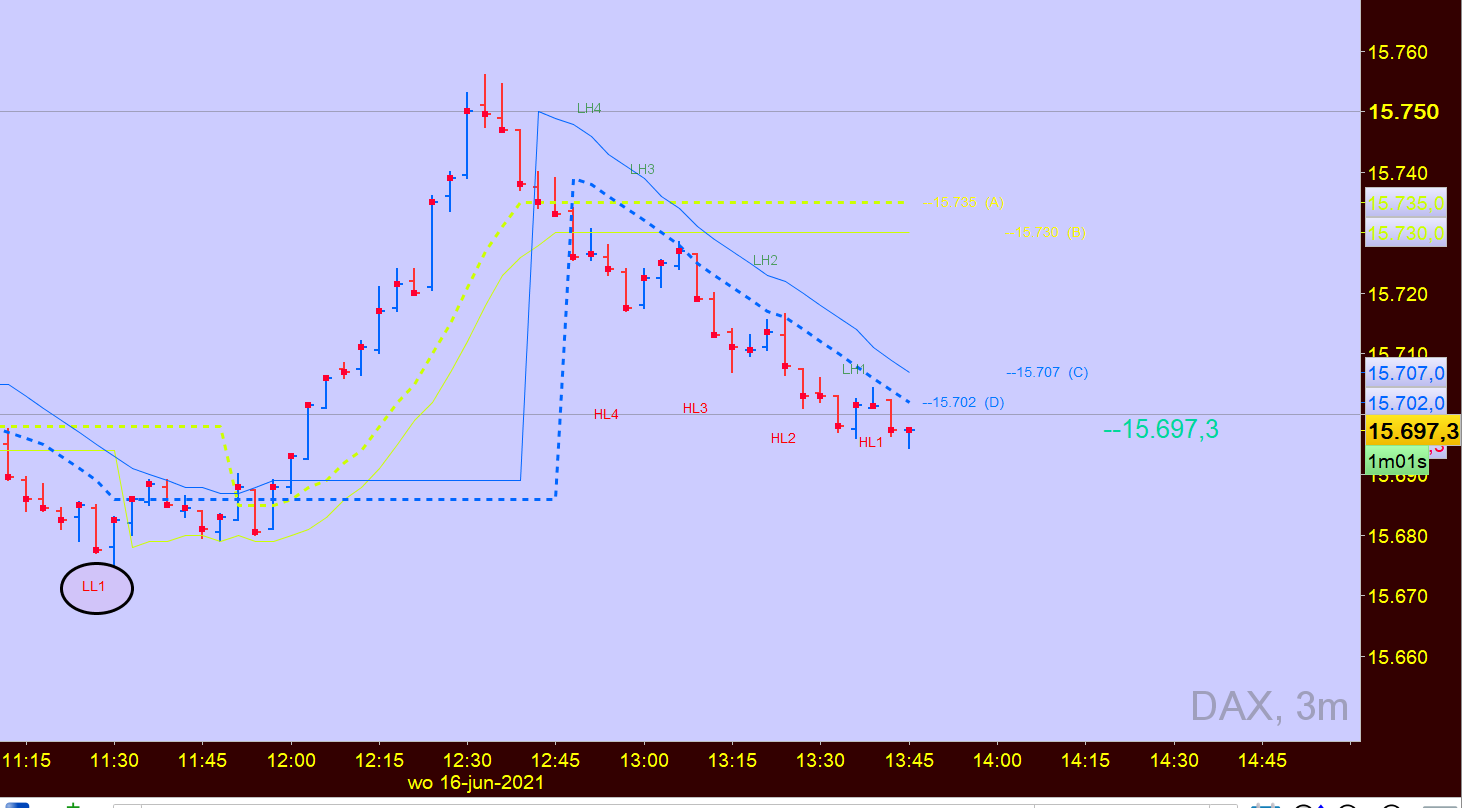
I have a picture that shows LL1 thereafter LH4, HL4 …. LH1, HL1(see attachement)
What’s next? because LL1 and HH1 is to far away.
Rules are in comment lines 4-8, as requested by lazybaby.
The rules are that CLOSE be used, not High/Low.
HH is when a High is higher than the last one, so when there is an absolute high, until it’s broken there will be no higher highs for a long time. This could be avoided by resetting everything every, say, 200 bars.
The reverse is true for LL’s.
LH is when there are new highs that are lower than the last HH.
The reverse is true for HL’s.