Hi, I have a simple scan that seems to work ok on Daily and Weekly, but when I try intraday on 15min -60min the MACD lines are not in correct sequence.
The simple scan is Stochastic over bough/ Sold which works fine on all time frames but the MACD lines do not match.
Is there another setting needed to work in smaller timeframes? ( Please see screenshots)
Is there an alarm that can be set when these patters complete?
Thanks very much.
Could you please share the related screener’s code. It would much easier to understand the logic of what you are exactly looking for as conditions and why it doesn’t work in intraday timeframes. Thanks in advance 🙂
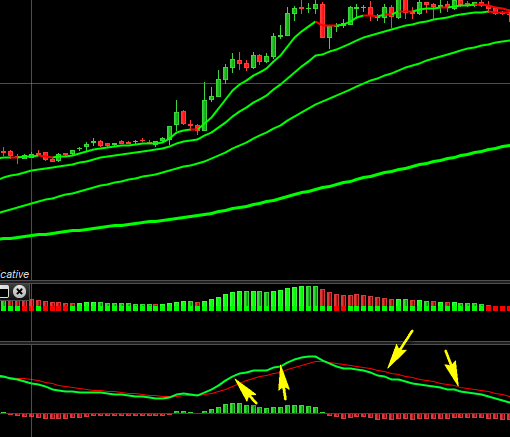
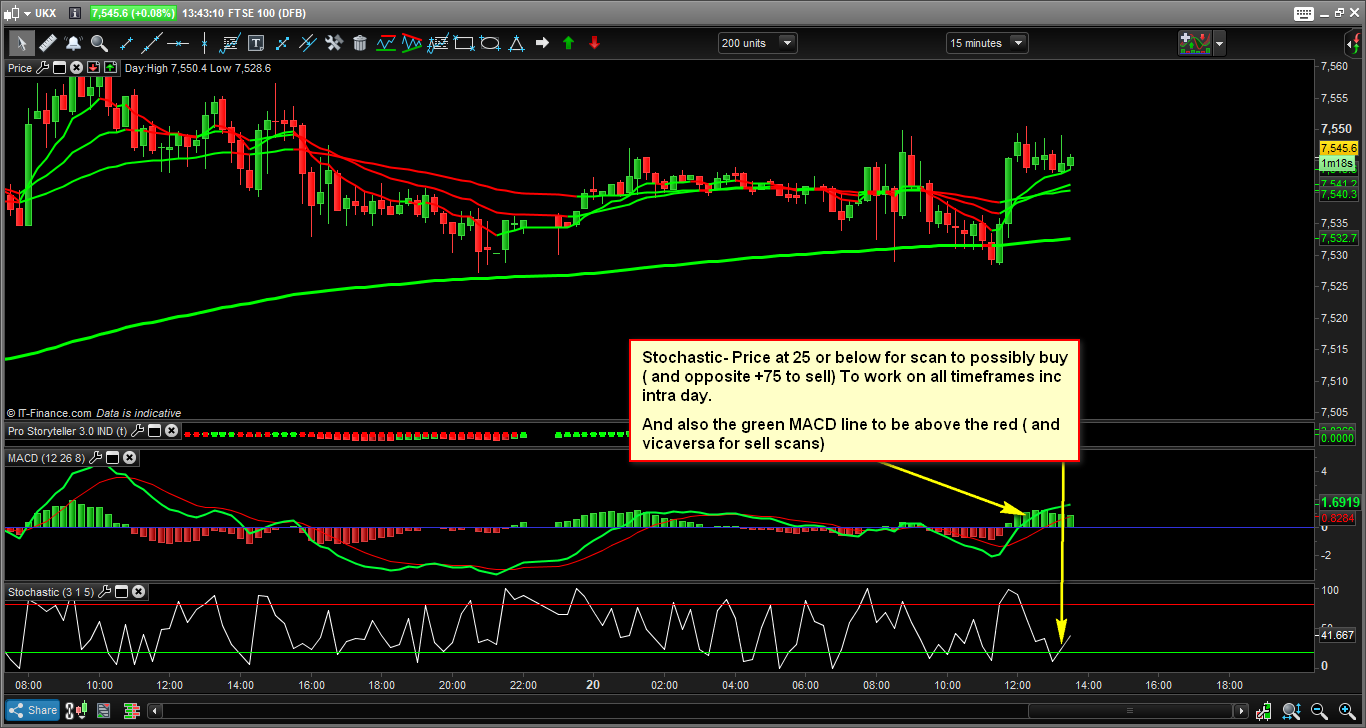
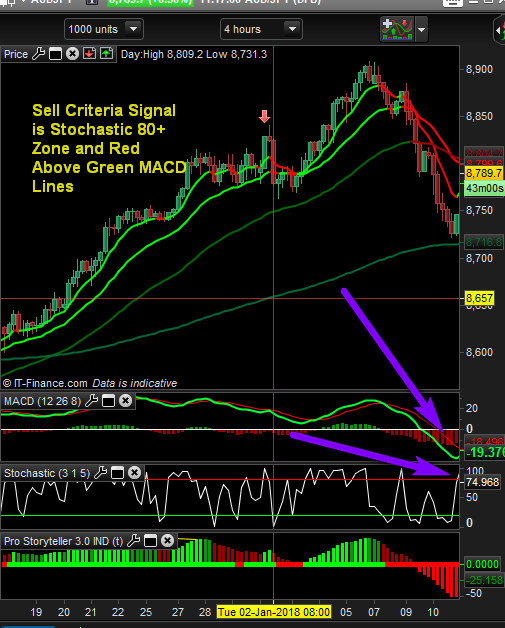
Hi Nicolas, thanks for your message. I have attached a screenshot of the exact scan I am trying to achieve. It’s only based to 2 indicators and when the Stochastics become over bought or oversold in conjunction with the MACD lines in agreement above or below to establish and scan for a possible buy or sell.
It seemed ok on a daily time frame but MACD is wrong on intraday settings.
I really don’t know the best way to get it to work.
Thanks again
Hi, thanks. I have my main screener – 15min for buys and another made for sells. I really want to have both of these screener windows on display on my screen for both the buy side and the sell criteria.
Is there a way to have either 2 screener windows or combine both buy and sell into one?
Thanks again
I think the problem is that you don’t have live data feeds for the stocks you are testing with your screener. Are you only an ‘End Of Day’ subscriber?
Hi, yes I have a full live feed. I have now for separate screeners done for my 3 main time frames – 15min, 60min and 4 hour + buy and sells.
Is there no easy way to have these all in one window and be able to run and to identify them as say a “buy setup” on 15m £/$ ?
Below is just an example of my screener code on 4 hours which is working…
indicator1 = Average[1](Stochastic[3,1](close))
c1 = (indicator1 > 72)
indicator2 = MACDline[12,26,8](close)
c2 = (indicator2 < 0)
SCREENER[c1 AND c2] (null AS “null”)
Thanks again
If you want to have all of them into the same window, you’ll have to combine all codes into 1 screener, there is no other solution.
In order to get all the codes into one screener, you can make it like this:
timeframe(daily)
indicator1 = Average[1](Stochastic[3,1](close))
c1 = (indicator1 > 72)

indicator2 = MACDline[12,26,8](close)
c2 = (indicator2 < 0)

cDaily = c1 and c2

timeframe(1 hour)
indicator11 = Average[1](Stochastic[3,1](close))
c11 = (indicator11 > 72)

indicator21 = MACDline[12,26,8](close)
c21 = (indicator21 < 0)

cIntraday = c11 and c21


if cDaily then
result = 1
endif
if cIntraday then
result = 2
endif

SCREENER[c1 AND c2] (result as "timeframe")
The found stocks will be sorted with “result” variables, which is 1 for Daily timeframe and 2 for the 1 hour timeframe, for this example.
Now you can modify it to include all your preferred timeframes for your screener.
Hi Nicolas, I really thank you for your help.
The scans I tried to make are not correct, for the MACD lines are not selected properly for a buy or a sell.
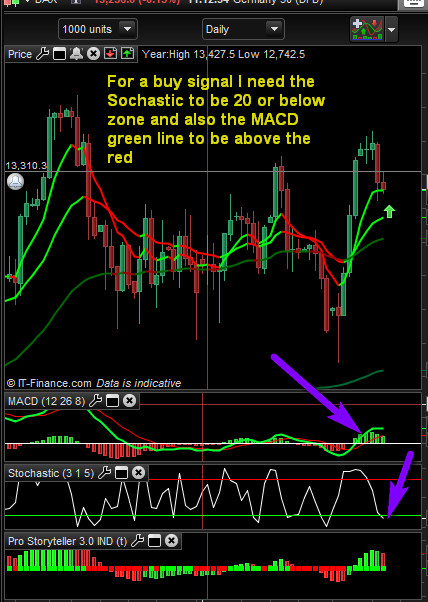
Please see below example of the code for a BUY. First criteria – Stochastic s works great, but the MACD lines …for a buy signal as below
the green MACD line needs to be above the red.
What do I need to do to sort the MACD lines correctly for the Screener?
Also see screenshots…
indicator1 = Average[1](Stochastic[3,1](close))
c1 = (indicator1 < 28)
indicator2 = MACDline[12,26,8](close)
c2 = (indicator2 > 0)
SCREENER[c1 AND c2] (null AS “null”)
I would appreciate a lot if you could use the specified button to incorporate code into your message, thank you.
You are trying to compare the MACD with its signal line, which can be done as follows:
indicator1 = Average[1](Stochastic[3,1](close))
c1 = (indicator1 < 28)

indicator2 = MACDline[12,26,8](close)
signal = exponentialaverage[8](indicator2)
c2 = (indicator2 > 0) and indicator2>signal

SCREENER[c1 AND c2] (null AS “null”)