Dear guys,
I need support by encode a strategy based on the Dax (1h).
First of all I want to the check the outcome of each bar. That means an indicator to check each hour of the day.
The indicator:
Check the open and close of each bar (1h).
I want to see the performance of each hour of the day. Start from 8 am till 22.
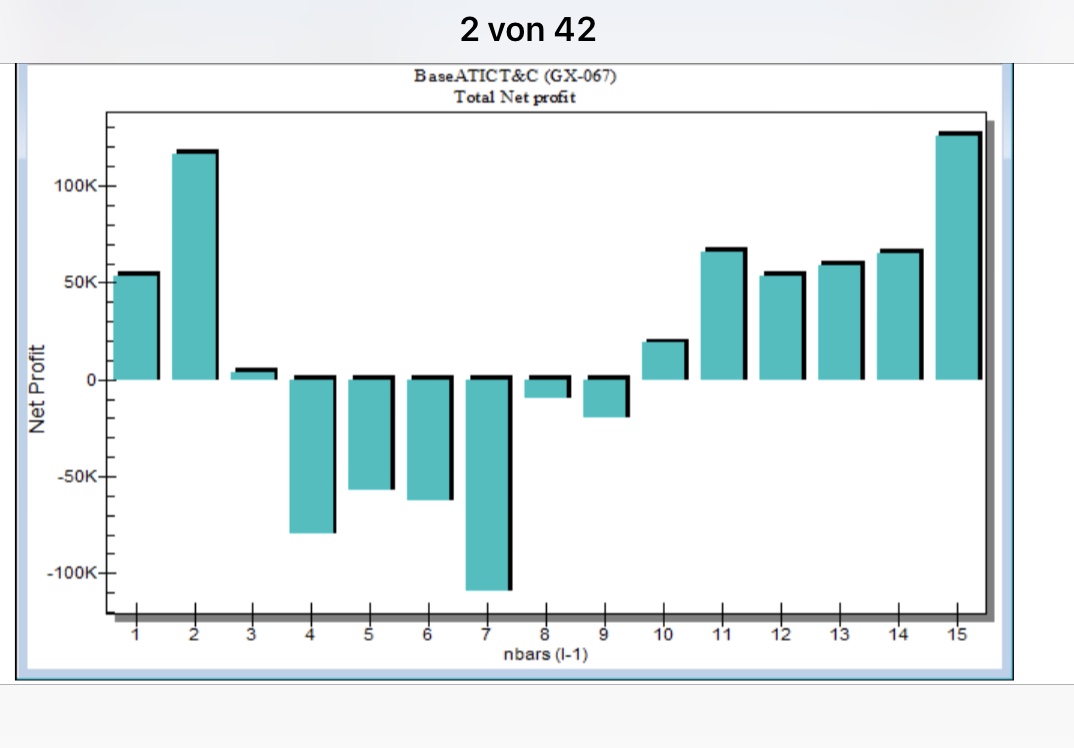
Once we have the results we can try to build a strategy. See example attached. If we enter a position at 8 o’clock and exit at 12 o’clock to reach the best results.
As a filter we can use the Dfactor.
If we see that at certain time of the day the indices start to claim we can open a buy position.
I hope the explanation will be useful, otherwise feel free to ask.
Best regards, Giuseppe
There is an indicator in our library about the most active hours of the day, that you could analyze to take the trading decision: Most active hours of trading indicator
Thanks Nicolas, I will try later and let you know.
Have a nice week.
Thanks for pointing out that indicator Nicolas – I hadn’t spotted it in the library.
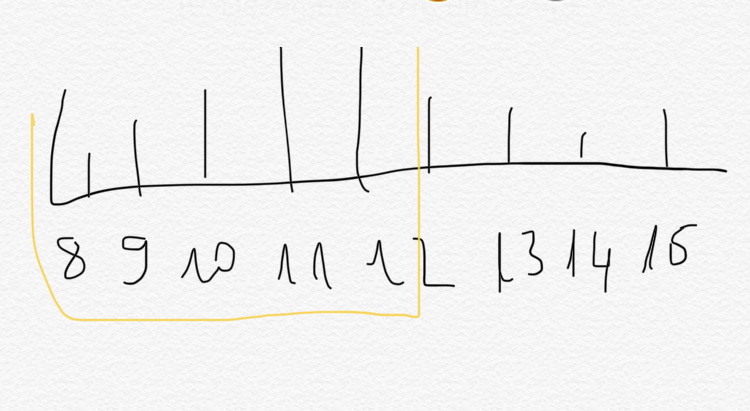
I notice though that the indicator calculates using HOUR and not OPENHOUR and so the results for say 16 are in fact the results for 1500 to 1600 and not the hour that starts at 1600
Not exactly what I am looking for.
I attached a picture to explain it better.
I want to see the strentgh of each hour …….. If I always buy at 7 am and sell at 8 am. How is the strentgh ?
not really.
I have tried several times without success … 🙁
I want to see the inefficency of the day ….. I hope you understand what I mean.
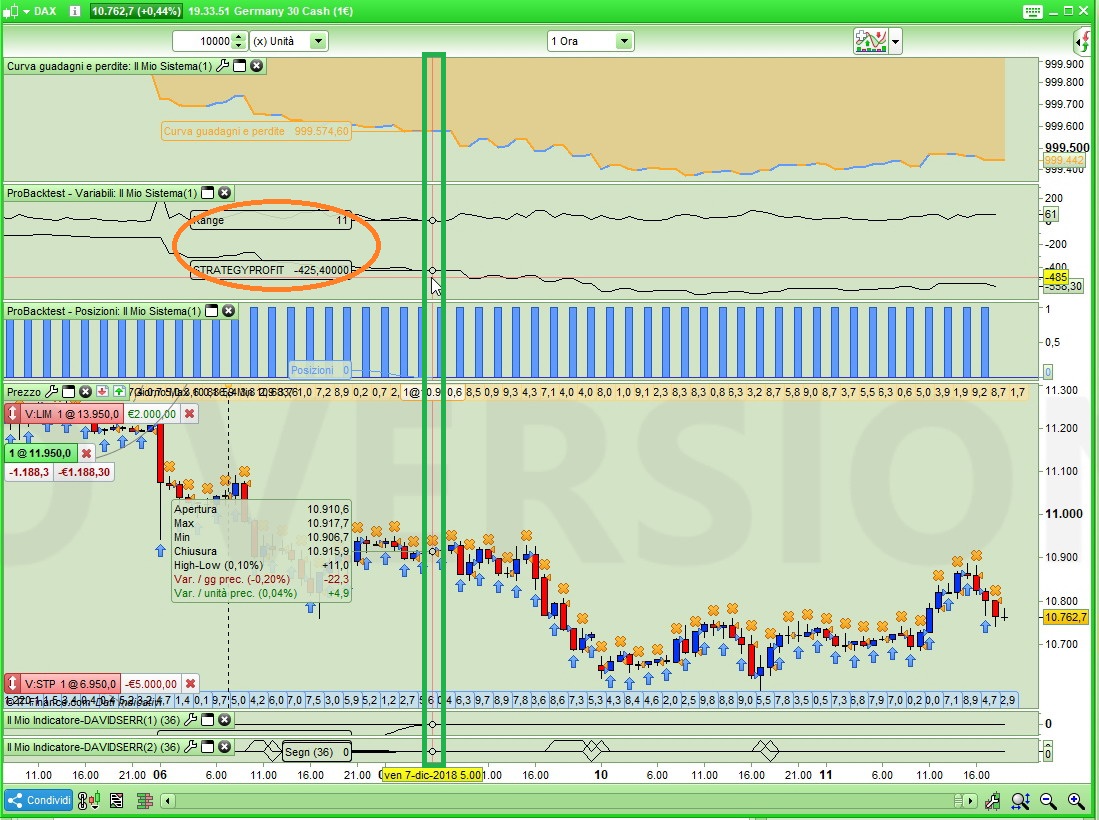
Maybe the strategy can sounds like this:
If time = 1000 then buy this bar at close …
On a 1-hour TF:
DEFPARAM CumulateOrders = False
IF LongOnMarket THEN
   SELL AT MARKET
ENDIF
BUY 1 CONTRACT AT MARKET
graph STRATEGYPROFIT
graph Range
see attached pic.
I’m not sure that you are communicating what you want very clearly but then again my German is appalling!
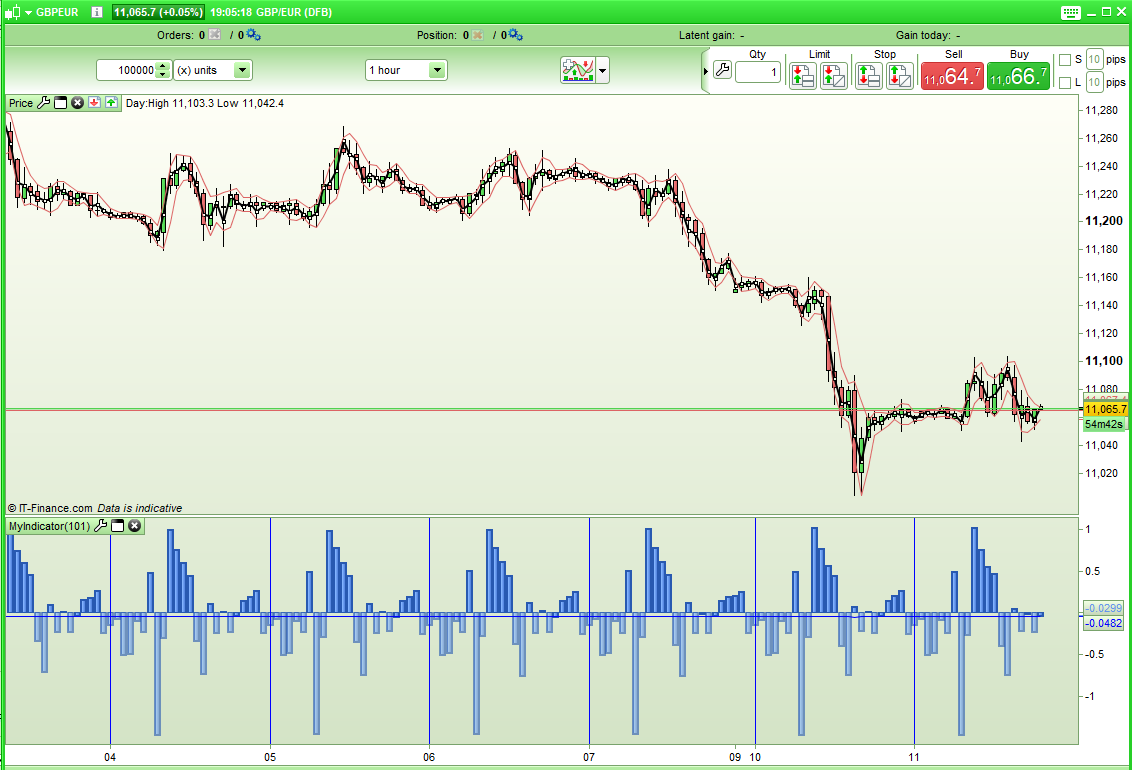
Maybe this is the sort of idea you have. It is a version of my library indicator but it just totals up the balance of close minus open for every hour:
//Most Active Hours
//By Vonasi (thanks to throwaway200 for the idea)
//20181211

//defparam calculateonlastbars = 1000

IF openhour = 0 THEN
H0 = (H0 + (close - open))
H0Count = (H0Count + 1)
ThisHour = (H0 / H0Count)
drawvline(barindex) coloured(0,0,255)
ELSIF openhour = 1 THEN
H1 = (H1 + (close - open))
H1Count = (H1Count + 1)
ThisHour = (H1 / H1Count)
ELSIF openhour = 2 THEN
H2 = (H2 + (close - open))
H2Count = (H2Count + 1)
ThisHour = (H2 / H2Count)
ELSIF openhour = 3 THEN
H3 = (H3 + (close - open))
H3Count = (H3Count + 1)
ThisHour = (H3 / H3Count)
ELSIF openhour = 4 THEN
H4 = (H4 + (close - open))
H4Count = (H4Count + 1)
ThisHour = (H4 / H4Count)
ELSIF openhour = 5 THEN
H5 = (H5 + (close - open))
H5Count = (H5Count + 1)
ThisHour = (H5 / H5Count)
ELSIF openhour = 6 THEN
H6 = (H6 + (close - open))
H6Count = (H6Count + 1)
ThisHour = (H6 / H6Count)
ELSIF openhour = 7 THEN
H7 = (H7 + (close - open))
H7Count = (H7Count + 1)
ThisHour = (H7 / H7Count)
ELSIF openhour = 8 THEN
H8 = (H8 + (close - open))
H8Count = (H8Count + 1)
ThisHour = (H8 / H8Count)
ELSIF openhour = 9 THEN
H9 = (H9 + (close - open))
H9Count = (H9Count + 1)
ThisHour = (H9 / H9Count)
ELSIF openhour = 10 THEN
H10 = (H10 + (close - open))
H10Count = (H10Count + 1)
ThisHour = (H10 / H10Count)
ELSIF openhour = 11 THEN
H11 = (H11 + (close - open))
H11Count = (H11Count + 1)
ThisHour = (H11 / H11Count)
ELSIF openhour = 12 THEN
H12 = (H12 + (close - open))
H12Count = (H12Count + 1)
ThisHour = (H12 / H12Count)
ELSIF openhour = 13 THEN
H13 = (H13 + (close - open))
H13Count = (H13Count + 1)
ThisHour = (H13 / H13Count)
ELSIF openhour = 14 THEN
H14 = (H14 + (close - open))
H14Count = (H14Count + 1)
ThisHour = (H14 / H14Count)
ELSIF openhour = 15 THEN
H15 = (H15 + (close - open))
H15Count = (H15Count + 1)
ThisHour = (H15 / H15Count)
ELSIF openhour = 16 THEN
H16 = (H16 + (close - open))
H16Count = (H16Count + 1)
ThisHour = (H16 / H16Count)
ELSIF openhour = 17 THEN
H17 = (H17 + (close - open))
H17Count = (H17Count + 1)
ThisHour = (H17 / H17Count)
ELSIF openhour = 18 THEN
H18 = (H18 + (close - open))
H18Count = (H18Count + 1)
ThisHour = (H18 / H18Count)
ELSIF openhour = 19 THEN
H19 = (H19 + (close - open))
H19Count = (H19Count + 1)
ThisHour = (H19 / H19Count)
ELSIF openhour = 20 THEN
H20 = (H20 + (close - open))
H20Count = (H20Count + 1)
ThisHour = (H20 / H20Count)
ELSIF openhour = 21 THEN
H21 = (H21 + (close - open))
H21Count = (H21Count + 1)
ThisHour = (H21 / H21Count)
ELSIF openhour = 22 THEN
H22 = (H22 + (close - open))
H22Count = (H22Count + 1)
ThisHour = (H22 / H22Count)
ELSIF openhour = 23 THEN
H23 = (H23 + (close - open))
H23Count = (H23Count + 1)
ThisHour = (H23 / H23Count)
ENDIF

avg = (h0 + h1 + h2 + h3 + h4 + h5 + h6 + h7 + h8 + h9 + h10 + h11 + h12 + h13 + h14 + h15 + h16 + h17 + h18 + h19 + h20 + h21 + h22 + h23)/(h0count + h1count + h2count + h3count + h4count + h5count + h6count + h7count + h8count + h9count + h10count + h11count + h12count + h13count + h14count + h15count + h16count + h17count + h18count + h19count + h20count + h21count + h22count + h23count)

c = 155
if ThisHour > Avg then
c = 255
endif

RETURN thishour coloured (100,149,237,c) style(histogram, 2) as "Average Range", avg coloured(0,0,255) style(line,1) as "All Time Average"
[attachment file=86881]
sorry …. not whta I mean.
Which time of the day will be profitable.
Let me explain:
Day 1 of the Month
Hour 1 = Calculate Open at 010000 – Close at 020000
Hour 2 = Calculate Open at 020000 – Close at 030000
and so on…….
Day 2 of the Month
Hour 1 = Calculate Open at 010000 – Close at 020000 (cumulate of Day 1)
I hope it will be better ….
my previous post refers to Roberto
I think my indicator that I just posted matches your description otherwise I am really confused! 🙂
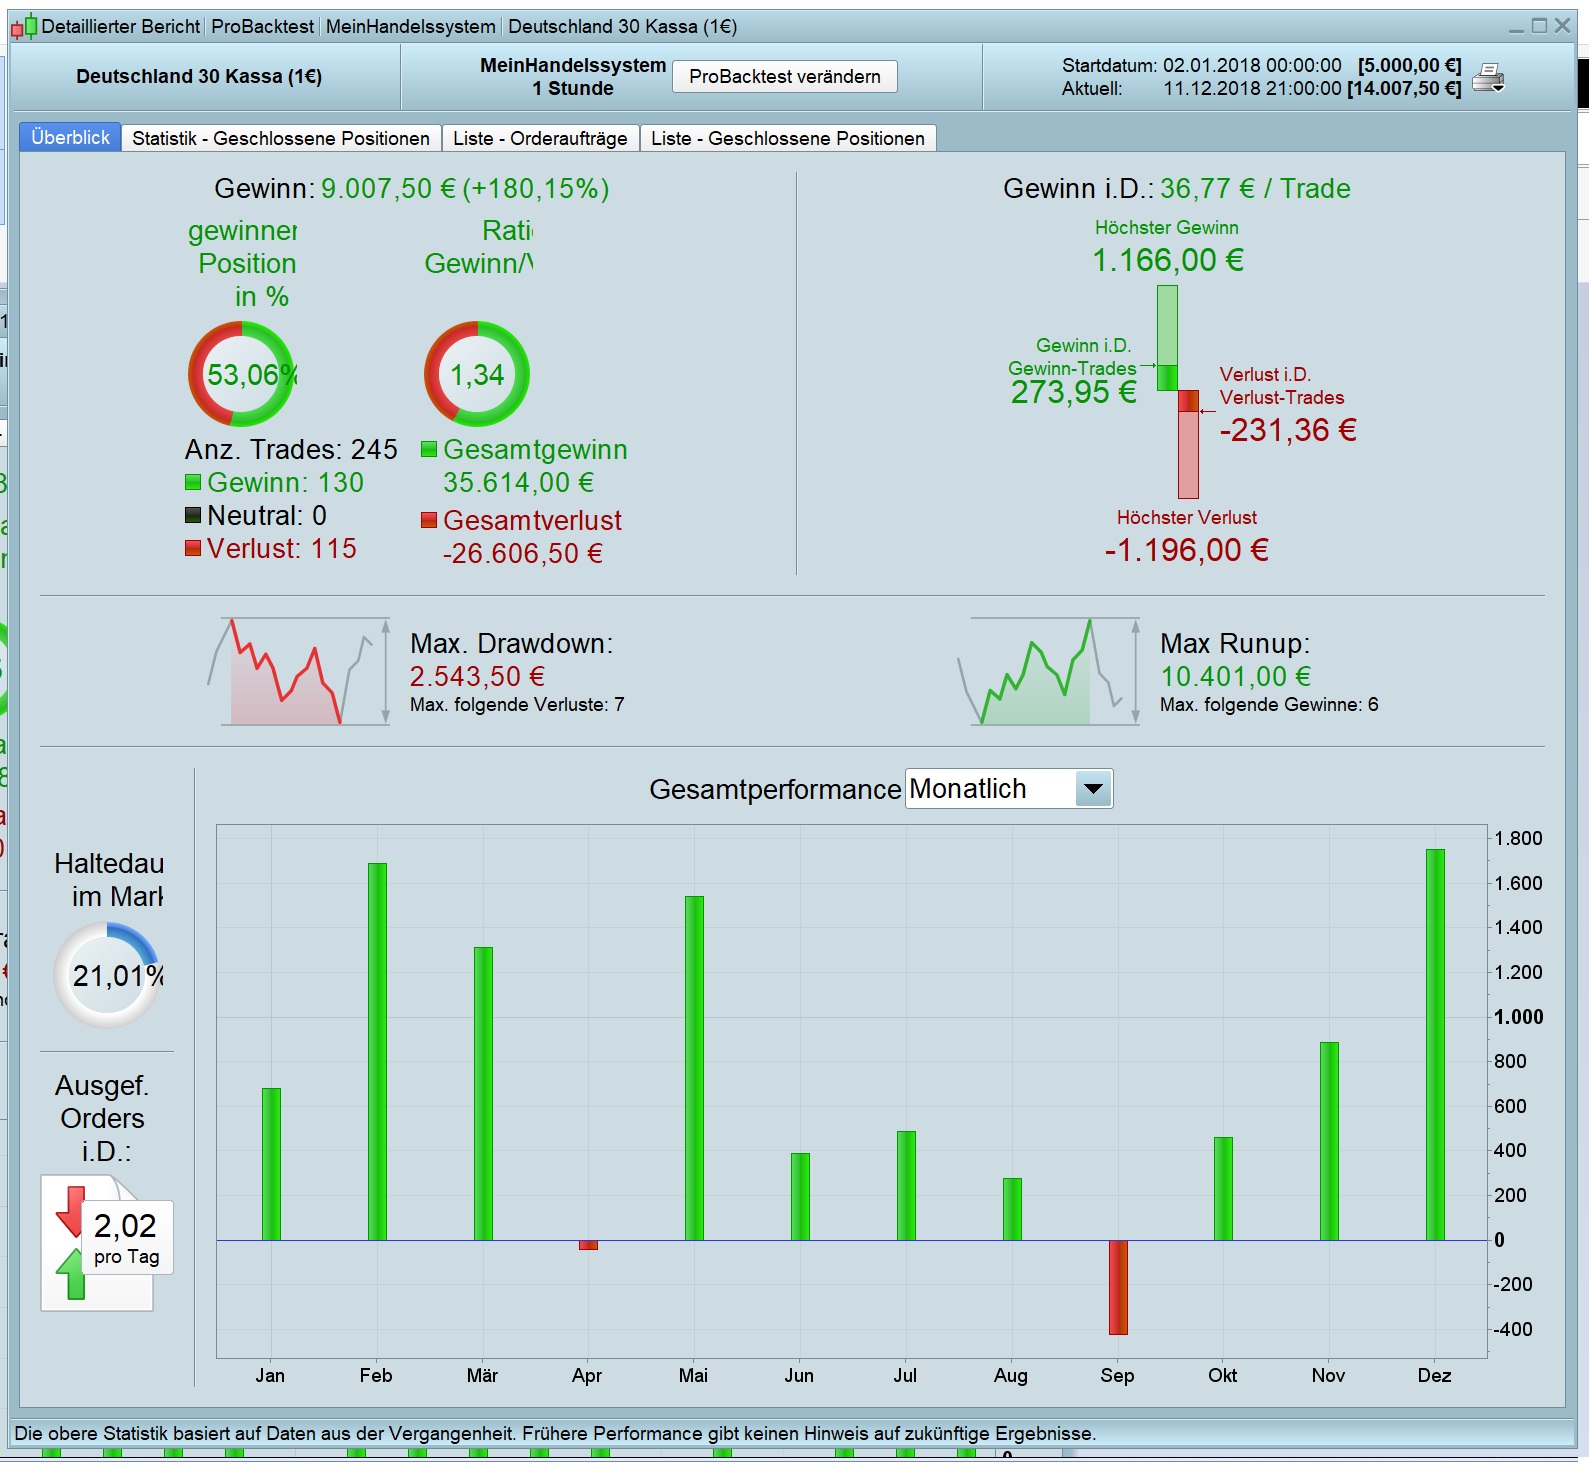
// Bedingungen zum Einstieg in Short-Positionen
IF NOT ShortOnMarket AND Time = 120000 THEN
SELLSHORT 5 CONTRACTS AT MARKET
ENDIF
// Bedingungen zum Ausstieg aus Short-Positionen
IF ShortOnMarket AND time = 170000 THEN
EXITSHORT AT MARKET
ENDIF
Isn’t that just pure data mining? You would need a long forward test to see if it works as well in the future as just matching it to history does.
You would be better to check each hour if it is a long or short profitable hour and how long that will last in the indicator and then do the same thing. Maybe adding in only trading in very active hours. Maybe this is something for me to test tomorrow but I fear history by the hour will not necessarily repeat in the future.
Why ? It is not the same like seasonal charts ?