Here is a template for creating an overlay of an indicator which one can usually not place into the charts window. It is mainly intended for scalping (non trending market) where you have your scalping chart adjusted just once (or twice if price is exploding). As usual heavy commenting (that’s just my style).
Use it like this:
- adjust your price chart window, import the layer
- look at what price level your lowest bars/candles are
- in the adjustment for the layer
- put the value of “ZeroLine” a bit below the price level of your bars/candles
- put the “HundredLine” at a value where you think “enough, not into my price bars”
- adjust color not to disturb too much but be unique to see what belongs to it
- maybe little re-adjustment of the zero and Hundred line
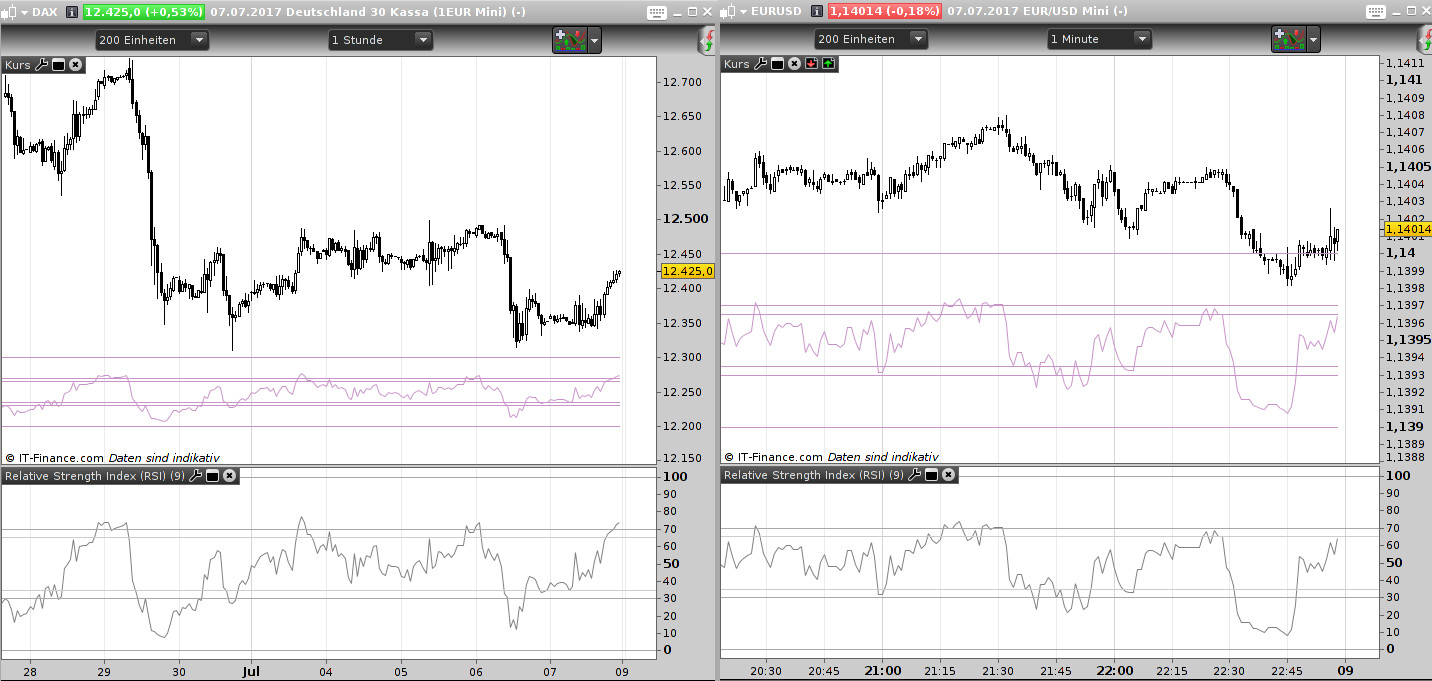
When rewriting the code to your needs: You can use it for any indicator having “fixed borders”, means their values cannot exeede a certain value. Example is the RSI which can have only values between 0 and 100. If negative range is involved: do your logic thinking first, load the indicator you want to layer in a separte window with same length, and choose a price chart which has big enough values to do a 1:1 layer for comparing your logic with the original (DAX, CAC, FTSE, DOW). If the result looks ok, change the price chart to something completely different scaling (forex) and check the ratio is working.
Rewriting for something like ATR (which has the ZeroLine as reference but can value-explode straight through the chart depending on the timeframe) should work, but needs a bit more logical thinking.
// === RSI overlay for a chart
// --- for PRT 10.3, July 2017, by AVT bigsister-gmt@gmx.de

// === Variables Begin
// --- variables for calculation
//     RSIlength: strategy fixed (default: 9), added changing option

// --- variables for painting
//     user MUST define 0-Line and 100-Line position, automatic calculation is a complete mess
//     ZeroLine: the lowest line, an RSI value cannot be less than 0
//     HundredLine: the highest line, an RSI value cannot be higher than 100
//     UpperBorder1, UpperBorder2: strategy fixed (default: 65), added a second one
//     LowerBorder1, LowerBorder2: strategy fixed (default: 35), added a second one
//     R,G,B: the values for the red, green and blue part defining an RGB Color Code
// --- set limits to the allowed color values (thanks @Nicolas for the code)
//     logic max(0,R): if a user pushes the ColorNumberingButton to -1,
//     R returns the maximum value between 0 and users push
//     which is in this case 0, because 0 is bigger than -1
R = max(0,R)
R = min(255,R)
G = max(0,G)
G = min(255,G)
B = max(0,B)
B = min(255,B)
// === Variables End

// === Calculation Begin
// --- calculating the painting
//     naming: O(verlay)[U(pper)|L(ower)]WhateverName[1-9]
// --- get the range size between zero and hundred line, then get the ratio value for 1 unit
// !!! works directly only for indicators which have fixed limits for their highest and lowest value
ORange = HundredLine - ZeroLine  // rsi limits: 0-100
OUnit = ORange / 100             // instead of normal unit=1 we get maybe a ratio unit=0.34 for forex

// --- calculate the values of the border lines
//     logic: a normal upper border of 65 has the 1-unit value of 65 which is added to the 0-line value 0,
//            so it would be drawn at the y-axis position 65;
//            we need the ratio unit of 65, because the distance between 0 and 100 is less than normal,
//            (and add that to the user-defined 0-line position later when drawing)
OUBorder1 = UpperBorder1 * OUnit
OUBorder2 = UpperBorder2 * OUnit
OLBorder1 = LowerBorder1 * OUnit
OLBorder2 = LowerBorder2 * OUnit

// --- calculate the value of the rsi
//     RSI in a separate window would simply use a unit of 1 and draw its line between 0 and 100
// --- adjust the RSI values to the calculated ratio
ORSIval = RSI[RSIlength](close) * OUnit       // MUST be close, otherwise a mess with DRAWSEGMENT
ORSIpreval = RSI[RSIlength](close[1]) * OUnit // DRAWSEGMENT needs a begin, that's the previous value
// === Calculation End

// === Drawing Begin
// --- for orientation: limiting zero and 100 line (positions were given by user)
DRAWSEGMENT(barindex-1,ZeroLine,barindex,Zeroline) coloured(R,G,B)
DRAWSEGMENT(barindex-1,HundredLine,barindex,HundredLine) coloured(R,G,B)
// --- the border lines
//     border distance as ratio value calculated above, add this distance to the zero line to get its y-axis position
DRAWSEGMENT(barindex-1,ZeroLine+OUBorder1,barindex,Zeroline+OUBorder1) coloured(R,G,B)
DRAWSEGMENT(barindex-1,ZeroLine+OUBorder2,barindex,Zeroline+OUBorder2) coloured(R,G,B)
DRAWSEGMENT(barindex-1,ZeroLine+OLBorder1,barindex,Zeroline+OLBorder1) coloured(R,G,B)
DRAWSEGMENT(barindex-1,ZeroLine+OLBorder2,barindex,Zeroline+OLBorder2) coloured(R,G,B)
// --- the rsi line
//     rsi value as ratio value calculated above, add this rsi value to the zero line to get its y-axis position
DRAWSEGMENT(barindex-1,ZeroLine+ORSIpreval,barindex,Zeroline+ORSIval) coloured(R,G,B)
// === Drawing End
RETURN
// === Program End