Help for graphical indicators development version 10.3
I open this topic up a ‘knowledge base’ for the development of indicators for version 10.3 and new graphics capabilities that it brings.
You will find all new graphics instructions, with examples, in the online documentation in the “GRAPHICAL” section here:
http://www.prorealcode.com/documentation/category/graphical/
If you have trouble or issue specific, you can post them here after this message.
I’ll post here also examples and / or “templates” to create your own indicators.
This thread will also be open in forums other languages, for your information. I’ll post the links here.
Hi Nicolas,
Thanks! I’m actually looking to create 1 simple Indicator (to combine my strategy) to display info like the Spread PIPS, if the current trend is bullish or bearish (accordingly to some of my strategy of course) and perhaps some simple text on the screen to show some other info.
In this way, I can react faster and while looking at the chart, I can fine tune my strategy against maybe 1 year of data manually, and then go for Backtesting again.
However, I notice this is for 10.3… IG only running 10.2.
Do you have any ideas if they are changing or does 10.2 support simple drawings? Trying hard to find the examples.
Cheers!
Hi smurfy,
I don’t know when IG will change to 10.3. On version 10.2, drawing are not possible, even text, but you can add points of different colors or any curves you like.
Hi Nicolas,
thanks for your reply. Yes I had dropped IG an email to check with them also. Doubt would be fast.
Im thinking with 10.3, it definitely adds alot of nice indicators and draw onto the chart for easy reference.
Any idea where you can point me to an example on the color and curves for 10.2? Please… 🙂
You got plenty of examples of how to draw curves onto chart in the Library. The documentation has also of good set of examples.
IG will change to 10.3 in March.
I am currently using the Demo of 10.3. I did copy Paste one drawline example, but it does not. I don’t get an error, the code is correct, but no line is painted in the chart. Anyone else have this Problem?
Did you applied your code on the price chart and not in another separate window?
Thanks!! I was in a wrong window…now it works!
Hi Nicholas,
I have question about how Drawsegment or DrawLine works ….
If I place a segment or horizontal line manually on a 1 hour chart, the line will display also across lower timframes ie 15min and 5min …
Now , Using drawsegment in an indicator on a 1hour the line displays on the 1 hour chart , however the line does not display across any lower time frame chars.
Is this how it is intended to work , or is there a switch in the syntax I am missing ?
Thanks
If the indicator that drawn your segment / line is still running, it will continue to draw on any timeframe, like any other indicator..
The indicator runs on the 1 hour chart displays the segment correctly , but the same segment does not show up on the 5min or the 15 min charts .. as would if the line had been draw manually …
Well, maybe you are not drawing the segment at the same place (different coordinates)? What is the code?
Here is the code :
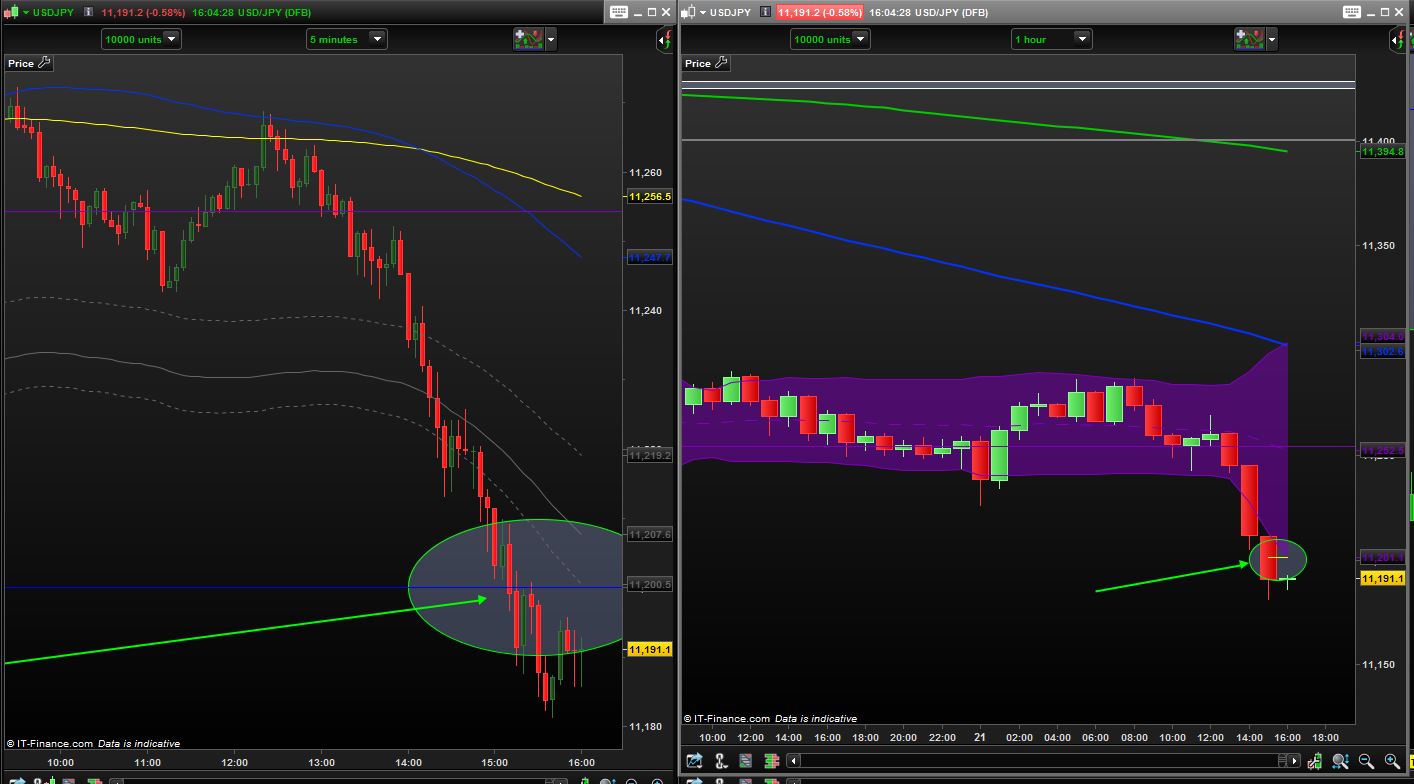
And a screen shot to show you the difference between the 2 timeframes …
As you can see the segment shows on the 1 hour chart , but not the 5 mins .
Also the arrow and circle are drawn manually on the 1 hour chart , and show through onto the 5mins chart
The indicator only runs on the 1 hour chart.
===================================================
defparam CalculateOnLastBars = 500
defparam drawonlastbaronly = true

BBd = BollingerDown[20](close)
BBu = BollingerUp[20](close)

IF HIGH > BBu  THEN
Drawsegment(barindex,BBu,barindex-1,BBu)COLOURED(250,0,0)
ENDIF
IF Low < BBd THEN
Drawsegment(barindex,BBd,barindex-1,BBd)COLOURED(250,250,0)
ENDIF
RETURN
I think there is a misunderstood from me: If the indicator only run in the 1 hour chart, you will not see anything drawn on the 5 minutes one, like it is the case with a graphic object drawn by hand. An indicator is running only on the chart where it stands.