I found a lot of Ehlers’ stuff on HK-Lisse website:
MESA period indicator :
REM TRENDLINE DE J. EHLERS
REM Indicateur "MESA PERIODE"
REM Calcul de la période du cycle dominant

PRIX = (high + low) / 2

IF Barindex <= 5 THEN
    PERIODE = 0
    V5 = 0
ENDIf

IF Barindex > 5 THEn
    REM Détermination de la phase de chaque tic
    V1 = PRIX - PRIX[6]
    V2 = V1[3]
    V3 = 0.75*(V1-V1[6])+0.25*(V1[2]-v1[4])
    ENPHASE = 0.33*V2+0.67*ENPHASE[1]
    ENQUADRATURE = 0.2*V3 + 0.8*ENQUADRATURE[1]
    IF ABS(ENPHASE + ENPHASE[1]) > 0 THEN
        A = ABS((ENQUADRATURE + ENQUADRATURE[1]) / (ENPHASE+ENPHASE[1]))
        PHASEDEG = ATAN(A)
    endif

    REM Correction si autres quadrants
    IF ENPHASE < 0 AND ENQUADRATURE > 0 THEN
        PHASEDEG = 180 - PHAsedeg
    endif

    IF ENPHASE < 0 AND ENQUADRATURE < 0 THEN
        PHASEDEG = 180 + PHASEDeg
    endif

    IF ENPHASE > 0 AND ENQUADRATURE < 0 THEN
        PHASEDEG = 360 - PHASedeg
    endif

    REM Phase différentielle et corrections éventuelles
    DELTAPHASE = PHASEDEg[1]-phasedeg
    IF PHASEDEG[1] < 90 AND PHASEDEG > 270 THEN
        DELTAPHASE = 360 + DELTaphase
    endif

    IF DELTAPHASE < 1 THEN
        DELTAPhase=1
    endif

    IF DELTAPHASE > 60 THEN
        DELTAphase=60
    endif

    REM Calcul de la période instantanée du cycle actuel
    REM et correction éventuelle
    PERIODEINSTANT = 0
    V4 = 0
    J = 0
    WHILE J<41
        V4 = V4 + DELTAPHASE[J]
        IF V4>360 AND PERIODEINSTANT=0 THEN
            PERIODEINSTANT =J
        ENDIF
        J=J+1
    WEND

    IF PERIODEINSTANT=0 THEN
        PERIODEINSTANT = PERIODEINSTANT[1]
    ENDIF

    REM Calcul de la PERIODE
    V5 = 0.25 * PERIODEINSTANT +0.75*V5[1]
    periode=v5
ENDIF

RETURN PERIODE as "PERIODE" , DELTAPHASE as "deltaphase"
MESA PHASE INDICATOR :
REM TRENDLINE DE J. EHLERS
REM Indicateur "MESA PHASE"
REM Calcul de la phase du cycle dominant

IF Barindex > 5 THEN

    PRIX = (high + low) / 2
    myPERIODE, myDELTAPHASE = CALL "MESA PERIODE"

    PERIODE = ROUND(myPERIODE)

    PARTIEREELLE = 0
    PARTIEIMAGINAIRE = 0

    K = 0
    REM Calcul en degrés
    WHILE K < PERIODE
        PARTIEREELLE = PARTIEREELLE + SIN(360*K/PERIODE)*PRIX[K]
        PARTIEIMAGINAIRE = PARTIEIMAGINAIRE + COS(360*K/PERIODE)*PRIX[K]
        K = K+1
    WEND

    IF ABS(PARTIEIMAGINAIRE) > 0.001 THEN
        DCPHASEDEG = ATAN(PARTIEREELLE/PARTIEIMAGINAIRE)
    ENDIF

    IF ABS(PARTIEIMAGINAIRE) <= 0.001 THEN
        IF PARTIEREELLE >= 0 THEN
            SIGNEPARTIEREELLE=1
        ELSE
            SIGNEPARTIEREELLE=-1
        ENDIF
        DCPHASEDEG = 90*SIGNEPARTIEREELLE
    ENDIF

    DCPHASEDEG = DCPHASEDEG + 90

    IF PARTIEIMAGINAIRE<0 THEN
        DCPHASEDEG = DCPHASEDEG + 180
    ENDIF

    IF DCPHASEDEG>315 AND DCPHASEDEG<=360 and myDELTAPHASE <> 500 THEN
        DCPHASEDEG = DCPHASEDEG - 360
    ENDIF

    PHASE = DCPHASEDEG

ENDIF

RETURN PHASE as "PHASE"
MESA RSB :
REM Indicateur "MESA RSB"
REM Calcul du rapport signal / bruit (RSB en dB)
REM Ajout ligne horizontale = 6


IF Barindex <= 8 THEN
    RSB = 0
    RANGERSB = 0
    ENPHASE = 0
    ENQUADRATURE = 0
ENdif

IF Barindex > 8 THEn
    PRIX = (high + low) /2
    REM Détermination des composantes en phase et en quadrature
    REM Transformation de Hilbert
    RANGERSB = 0.2*(high - low) + 0.8*RANGERSB[1]
    V1 = PRIX-PRIX[6]
    V2 = V1[3]
    V3 = 0.75*(V1-V1[6]) + 0.25*(V1[2]-V1[4])
    ENPHASE = 0.33*V2 + 0.67*ENPHASE[1]
    ENQUADRATURE = 0.2*V3 + 0.8*Enquadrature[1]
    REM Lissage du rapport signal/bruit
    V2 = 0.2*(square(ENPHASE) + square(ENQUADRATURE)) + 0.8*V2[1]
    REM Calcul du rapport signal/bruit lissé
    IF V2<0.001 THEN
        V2=0.001
    endif

    IF RANGE>0 THEN
        RSB = 0.25*(10* LOG(V2 / square(RANGERSB)) / LOG(10)+4.7) + 0.75*RSB[1]
    ENDif
endif

RETURN RSB as "Rapport Signal-Bruit"
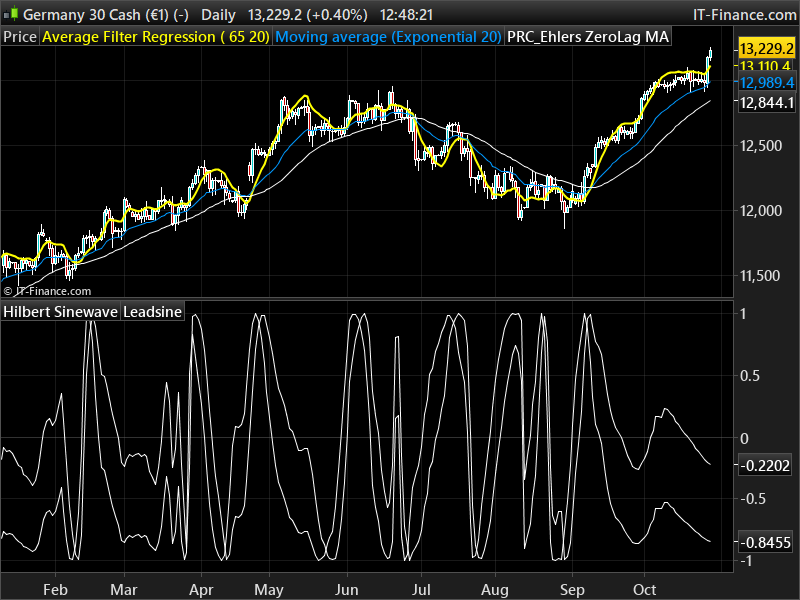
MESA SINEWAVE INDICATOR :
REM TRENDLINE DE J. EHLERS
REM Indicateur "MESA SINEWAVE"
REM Calcul du SINEWAVE et du LEAD_SINEWAVE
REM Sinus de la phase et ce même sinus avancé de 45°

myPHASE = CALL "MESA PHASE"

IF Barindex > 5 THEN
    PHASE = myPHASE
    SINEWAVE = SIN(PHASE)
    LEADSINEWAVE = SIN(PHASE + 45)
ENDif

RETURN SINEWAVE as "SINEWAVE" , LEADSINEWAVE as "LEAD SINEWAVE"
MESA TRENDLINE indicator :
REM TRENDLINE DE J. EHLERS
REM Indicateur "MESA TRENDLINE"
REM Calcul de la TRENDLINE et du FILTRE DE KALMAN
REM Utilisés comme 2 moyennes mobiles adaptatives en mode Tendance

IF Barindex > 5 THEN

    PRIX = (high + low) /2
    myPERIODE, myDELTAPHASE = CALL "MESA PERIODE"

    PERIODE = ROUND(myPERIODE)
    TRENDLINE = 0
    J =0
    WHILE J < PERIODE+2
        TRENDLINE = TRENDLINE + PRIX[J]
        J = J+1
    wend

    IF PERIODE>0 THEN
        TRENDLINE = TRENDLINE / (PERIODE+2)
    endif

    REM Filtre de Kalman zero lag
    KALMAN = 0.33*(PRIX + 0.5*(PRIX - PRIX[3])) + 0.67*Kalman[1]
    IF Barindex<26 and myDELTAPHASE <> 500 THEN
        TRENDLINE = PRIX
        KALMAN =prix
    ENDIf
endif

RETURN TRENDLINE as "TRENDLINE" , KALMAN as "KALMan"
MESA trend cycle :
REM TRENDLINE DE J. EHLERS
REM Indicateur "MESA CYCLE TENDANCE"
REM Essai de détermination du mode cycle ou tendance
REM Variable P1 = 0.3

myPERIODE, myDELTAPHASE = CALL "MESA PERIODE"
mySINEWAVE, myLEADSINEWAVE = CALL "MESA SINEWAVE"
myTRENDLINE, myKALMAN = CALL "MESA TRENDLINE"
myRapportSignalBruit = CALL "MESA RSB"

P = myPERIODE
DEL = myDELTAPHASE
S = mySINEWAVE
LS = myLEADSINEWAVE
TL = myTRENDLINE
K = myKALMAN
RSB = myRapportSignalBruit

TENDANCE=1
CYCLES=0

REM Détecter un croisement LS/S et initialiser le mode cycle si RSB suffisant
IF LS crosses over S OR LS crosses under S AND RSB>6 THEN
    TENDANCE=0
    CYCLES=1
ENDIf

REM Vérifier progressivité de la variation de la phase
IF P<>0 AND DEL>(1-P1)*360 / P AND DEL<(1+P1)*360 / P THEN
    TENDANCE=0
    CYCLES=1
endif

REM Détecter un croisement K/TL et initialiser le compteur de jours
IF K crosses over TL OR K crosses under TL THEN
    NB=0
endif
REM Incrémenter compteur de jours
NB=nb+1
REM Confirmer mode cycle si compteur < une demi-période, sinon tendance
IF NB<P/2 THEN
    CYCLES=1
    TENDANCE=0
ELSE
    CYCLEs=0
    tendance=1
endif

RETURN CYCLES as "CYCLES", TENDANCE as "TENDANCE"
I haven’t test anything. Don’t really know if it’s personal work or original Ehlers indicators. If it’s not, please tell me and I’ll convert your given code.
This is the URL where I found these prorealtime codes: http://hk-lisse.over-blog.com/article-16635860.html