DRAWRECTANGLE manuell zeichnen

Viewing 5 posts - 1 through 5 (of 5 total)
  • Author
    Posts
  • #203993 quote
    LiriosLirios
    Participant
    New

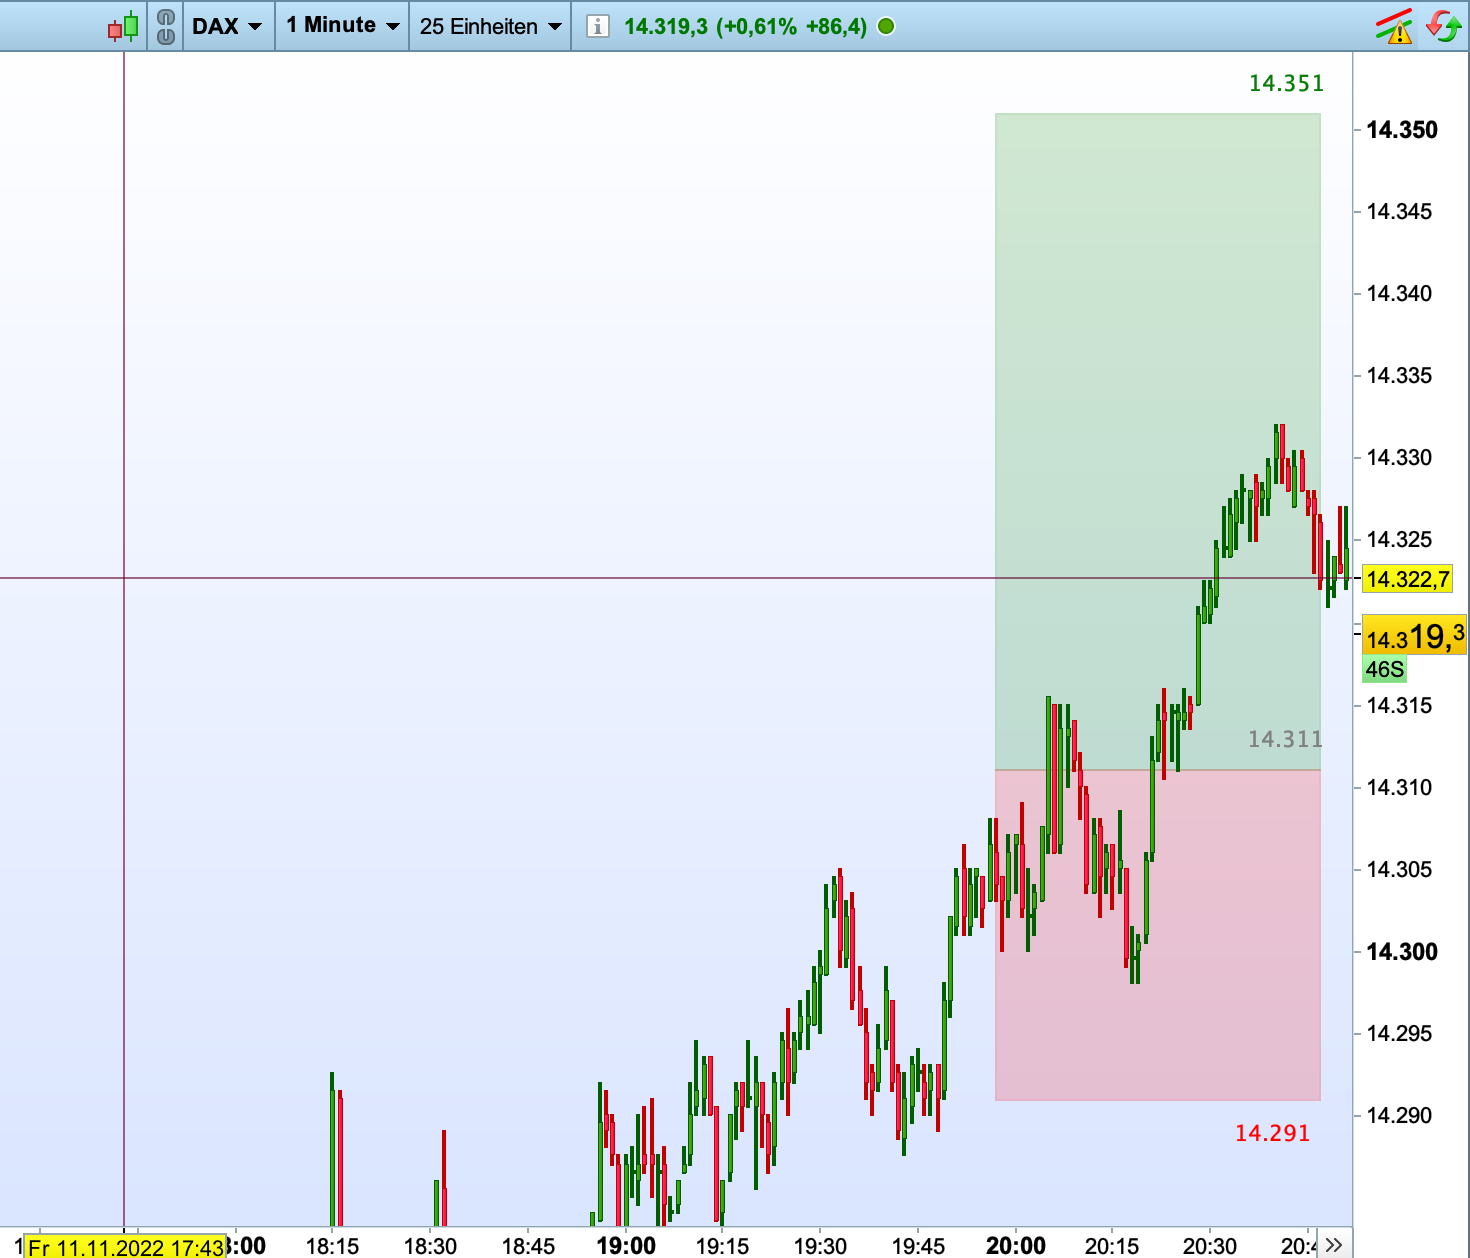
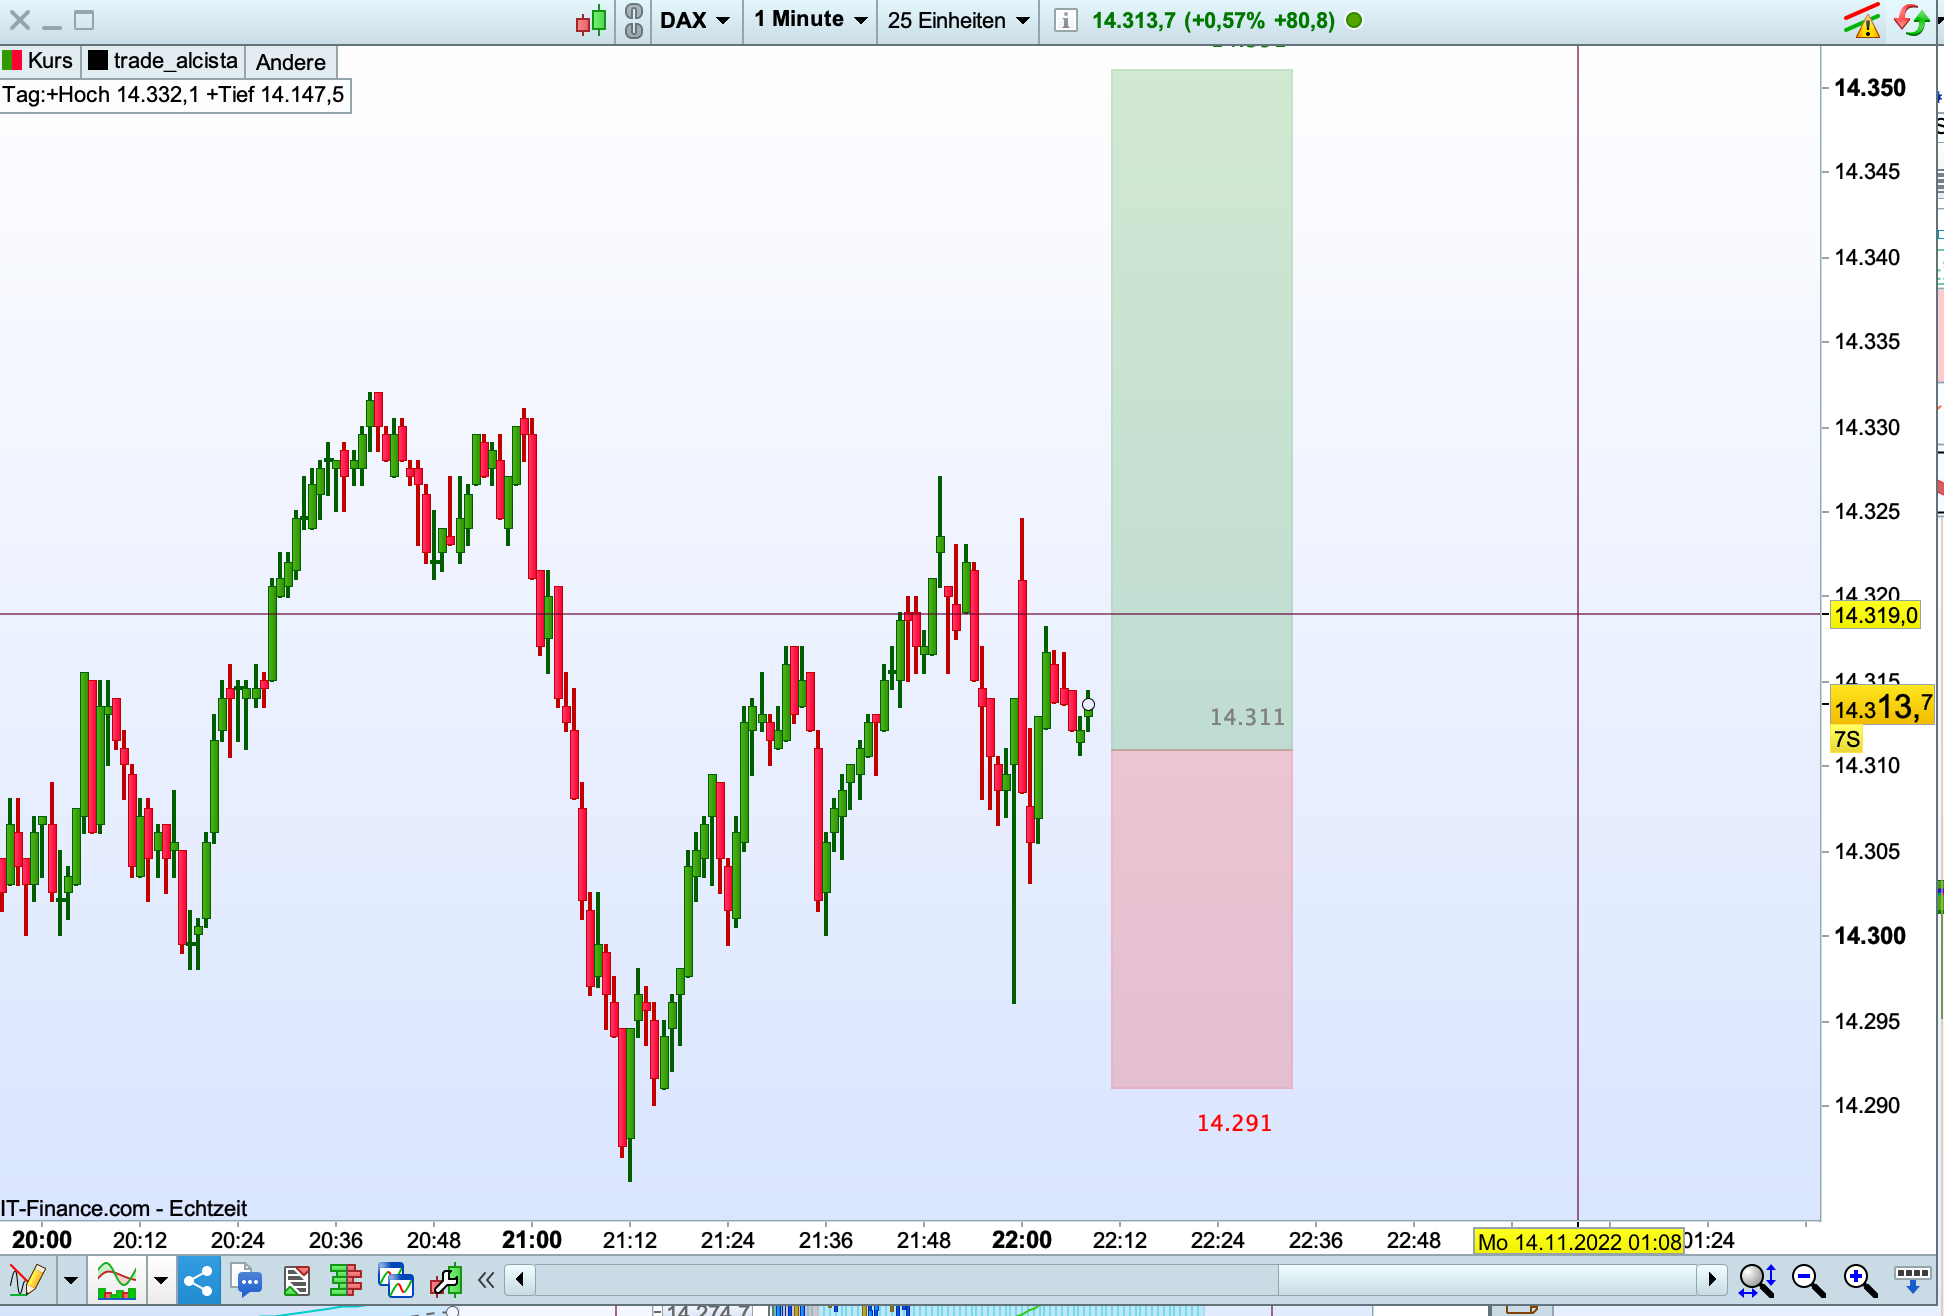
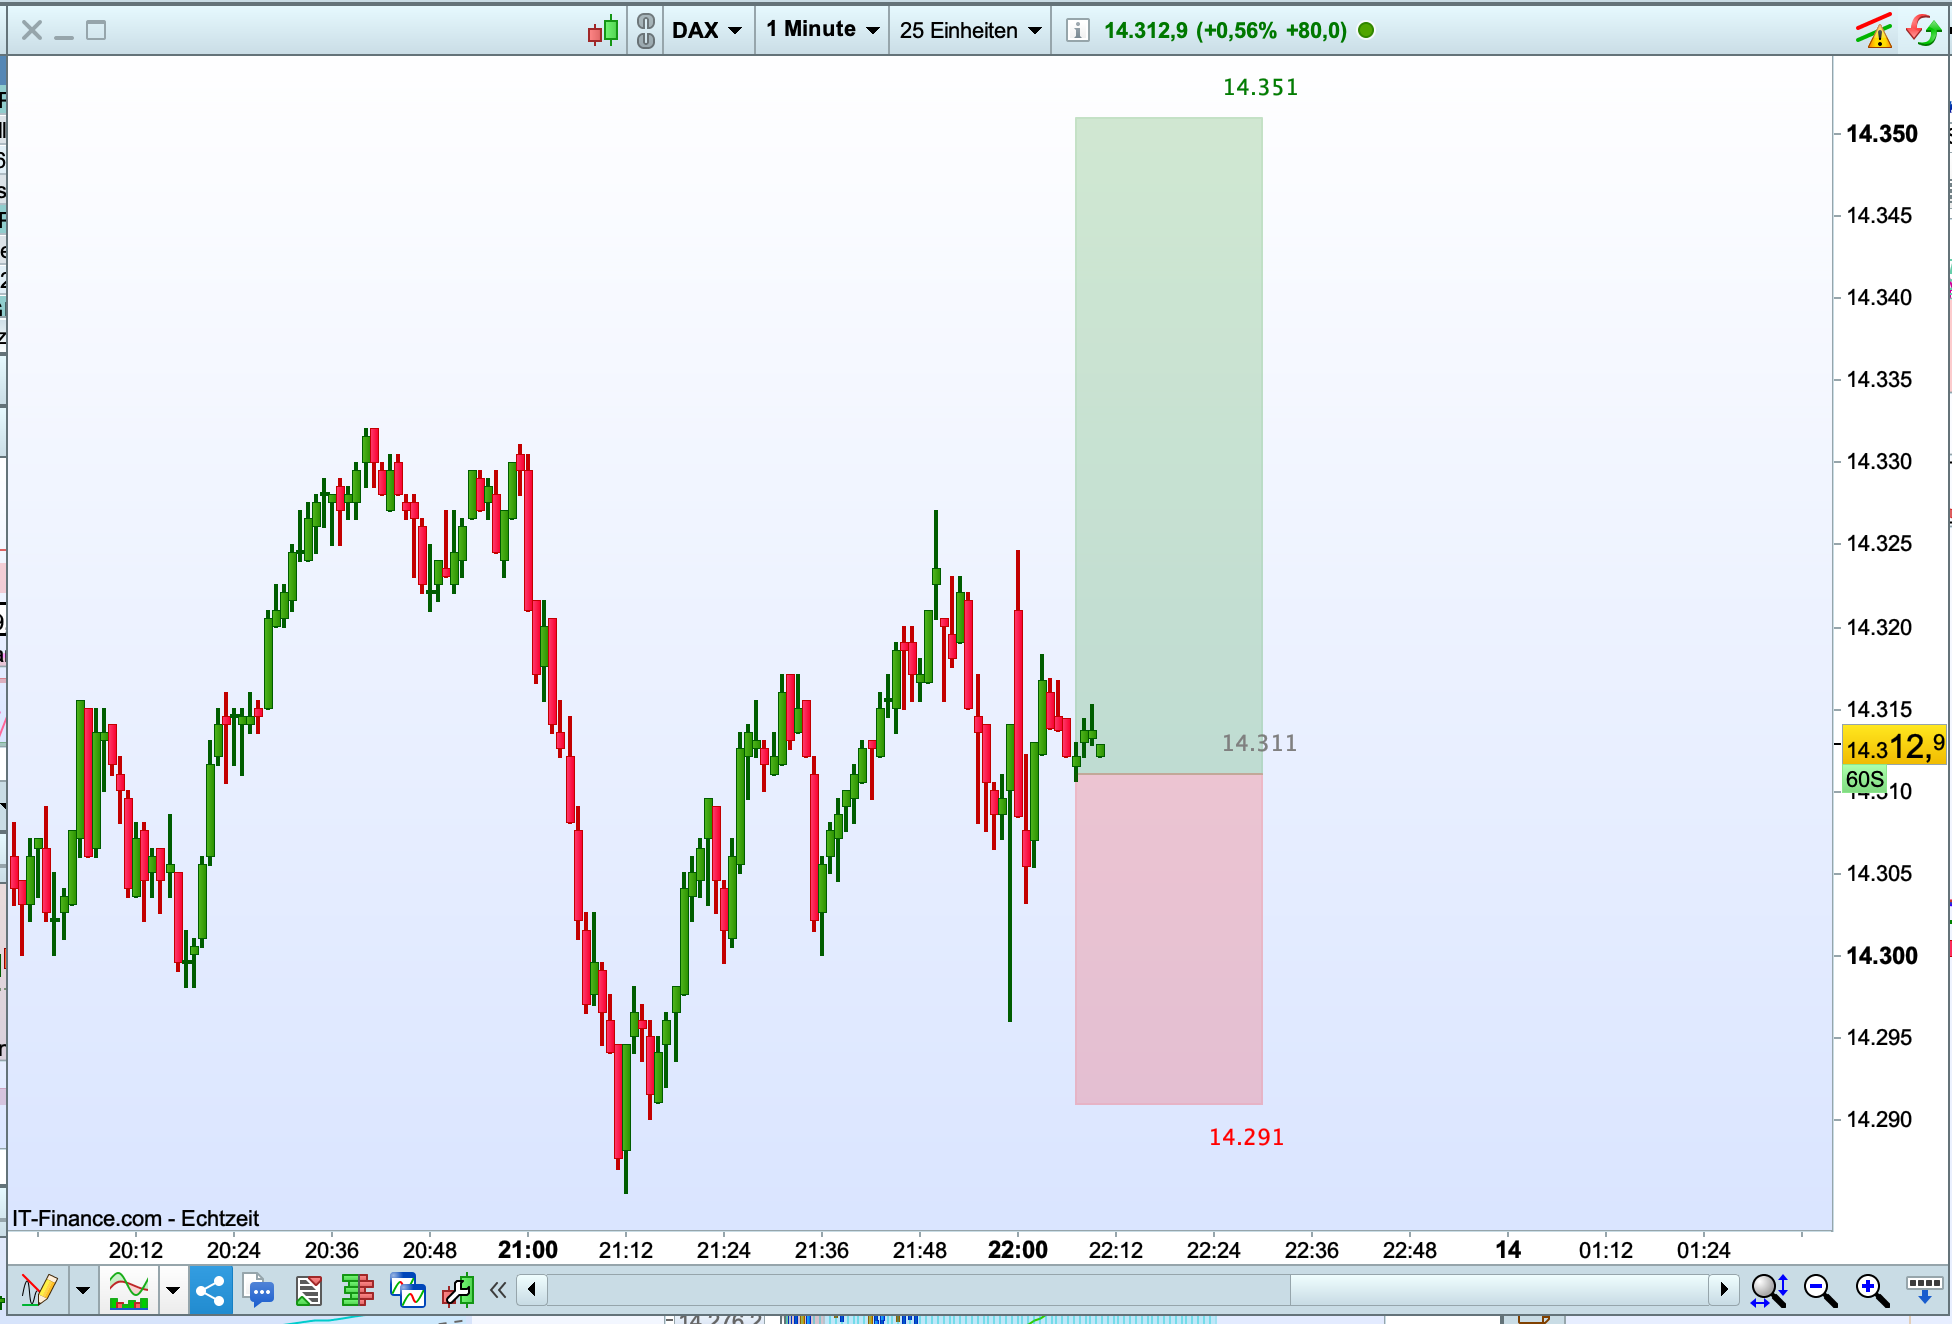
    Guten Tag, ich brauche Hilfe bei einem Indikator, der zwei Rechtecke zeichnet, die eine Long-Trade-Position für den Tag signalisieren.
    Dieses Signal sollte auf dem Chart sichtbar sein, bevor oder nachdem der Kurs das Einstiegsniveau erreicht.

    Dies wäre der Code zur Verbesserung:

    —————————————-

    defparam drawonlastbaronly=true // Zeichung nur am letzten Bar

    ratio=3.4
    stoploss=269
    Long=1
    entrada=16920

    SLL=entrada-stoploss
    TPl=entrada+(ratio*stoploss)
    pipsTP= abs(ratio*stoploss)
    pips= abs(salida-entrada)
    salida= tpl

    if islastbarupdate and LONG=1 then
    short=0
    DRAWTEXT(” #Entrada# “, barindex+8, entrada+2)coloured(“gray”)
    DRAWTEXT(” #tpl#”, barindex+8, tpl+2) coloured(“green”)
    DRAWRECTANGLE(barindex-125, tpl, barindex+2, entrada) coloured(“green”,45) bordercolor(“green”,15)
    DRAWRECTANGLE(barindex-125, sll, barindex+2, entrada) coloured(“red”,45) bordercolor(“red”,15)
    DRAWTEXT(” #SLL#”, barindex+8, sll-2)coloured(“red”)

    endif

    return

    1.png 1.png 2.png 2.png 3.png 3.png
    #204198 quote
    robertogozzirobertogozzi
    Moderator
    Legend

    Vorher oder nachher bedeutet IMMER. Tut es das jetzt nicht?

    Von den Fotos verstehe ich nicht, was Sie bekommen wollen.

    #204223 quote
    LiriosLirios
    Participant
    New

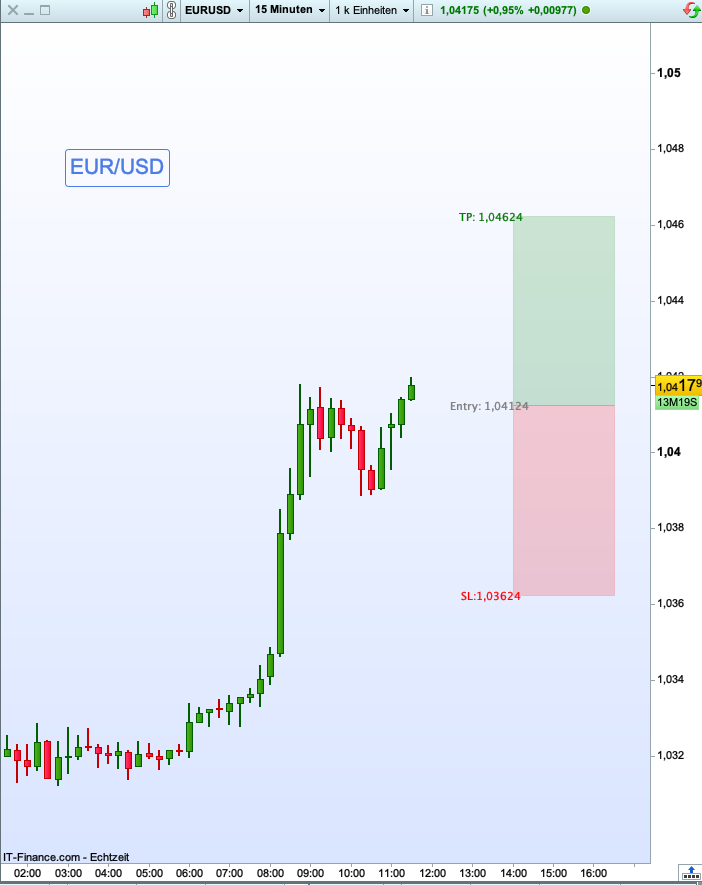
    vielen Dank für Ihr Muhe, lassen Sie mich besser erklären, zum Beispiel heute in der eur/usd, es geht um das Zeichnen von zwei Rectangle zwischen  14:00 bis 15:30 Uhr am, aber sollten um 11:00 Uhr gezeichnet werden, das heißt, der Preis hat noch nicht berührt die Entry-Level wie in der Grafik 1.

    1-1.png 1-1.png
    #204250 quote
    robertogozzirobertogozzi
    Moderator
    Legend

    Dies ab 11:00 druckt das verschobene Rechteck um 14:30 (für 1 1/2 Stunden):

    defparam drawonlastbaronly=true // Zeichung nur am letzten Bar
    ratio=3.4
    stoploss=269
    Long=1
    entrada=14300 //16920
    SLL=entrada-stoploss
    TPl=entrada+(ratio*stoploss)
    pipsTP= abs(ratio*stoploss)
    pips= abs(salida-entrada)
    salida= tpl
    if OpenTime >= 110000 AND OpenTime <= 153000 then
       IF OpenTime = 110000 THEN
          StartBar = Barindex + 18
          EndBar   = StartBar + 6
       ENDIF
       short=0
    endif
    DRAWTEXT(" #Entrada# ", StartBar+8, entrada+2)coloured("gray")
    DRAWTEXT(" #tpl#", StartBar+8, tpl+2) coloured("green")
    DRAWRECTANGLE(StartBar, tpl, EndBar, entrada) coloured("green",45) bordercolor("green",15)
    DRAWRECTANGLE(StartBar, sll, EndBar, entrada) coloured("red",45) bordercolor("red",15)
    DRAWTEXT(" #SLL#", barindex+8, sll-2)coloured("red")
    return
    #204266 quote
    LiriosLirios
    Participant
    New

    Vielen Dank!

Viewing 5 posts - 1 through 5 (of 5 total)
  • You must be logged in to reply to this topic.

ProRealAI ProRealAI New

Stuck on this ProBuilder code?

Describe what this topic is trying to build, in plain English, and ProRealAI writes the ProRealTime™ indicator, screener or system for you.

Available in 7 languages
Try ProRealAI

DRAWRECTANGLE manuell zeichnen


ProBuilder: Indikatoren & Custom Tools

New Reply
Author
author-avatar
Lirios @lirios Participant
Summary

This topic contains 4 replies,
has 2 voices, and was last updated by LiriosLirios

3 years, 10 months ago.

Topic Details
Forum: ProBuilder: Indikatoren & Custom Tools
Language: German
Started: 11/11/2022
Status: Active
Attachments: 4 files
ProRealCode ProRealCode
Loading...