

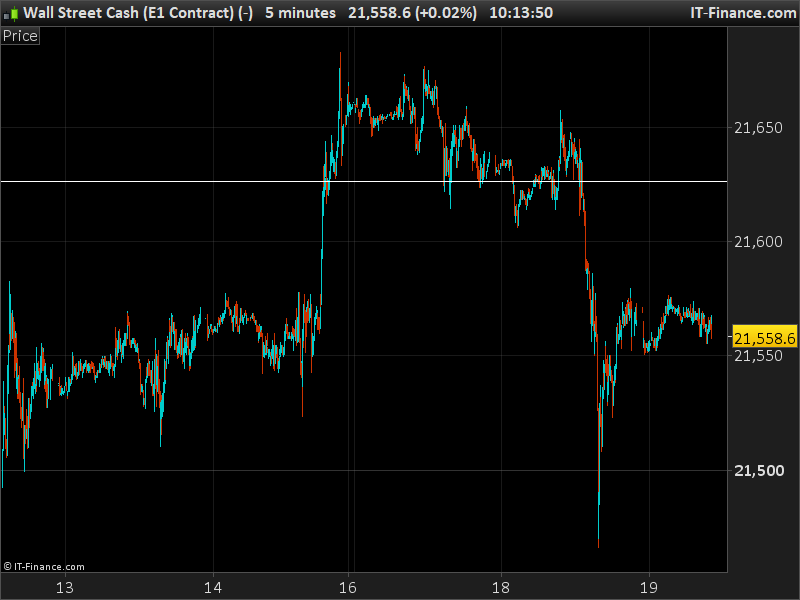
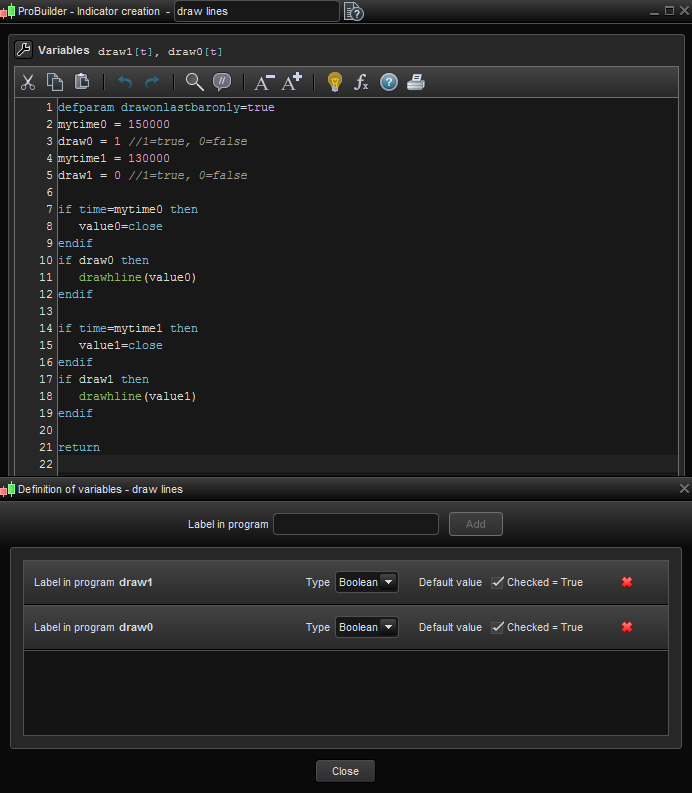
Drawing a horizontal line at the close of a H1 candle on the Dow
- You must be logged in to reply to this topic.
New Reply

Author
Summary
This topic contains 15 replies,
has 4 voices, and was last updated by ![]()
8 years, 4 months ago.
Topic Details
| Forum: | ProBuilder: Indicators & Custom Tools |
| Language: | English |
| Started: | 07/19/2017 |
| Status: | Active |
| Attachments: | 2 files |
Loading...