Hi Bard,
i have no idea, the code is working well at my system.
I am using the beta version 11.1.
Did you check the availability of the Stochasticd…. at your workstation.
The syntax for STOCHASTIC in v10.3 can be found here:
Stochastic
There are only two variables which is why you get the error. Perhaps in v11 STOCHASTIC has been modified to allow for the third value without an error but as Nicolas explains in the comments the third value is not really required as it is just the smoothing period for the signal line and so is not required to calculate it.
 Bard
BardParticipant
Master
Hi @Vonasi,
I looked at the documentation and see the format is:
Stochastic[N,K](price)
So I removed the extra third value but still get a warning using the following code? :
DCSTO= Stochasticd[Period,3](close)
mySTO= Stochasticd[14,3](close)
Any ideas?
Cheers!
I’m guessing that the extra ‘d’ on the end of STOCHASTIC is a typo and not actually in your code?
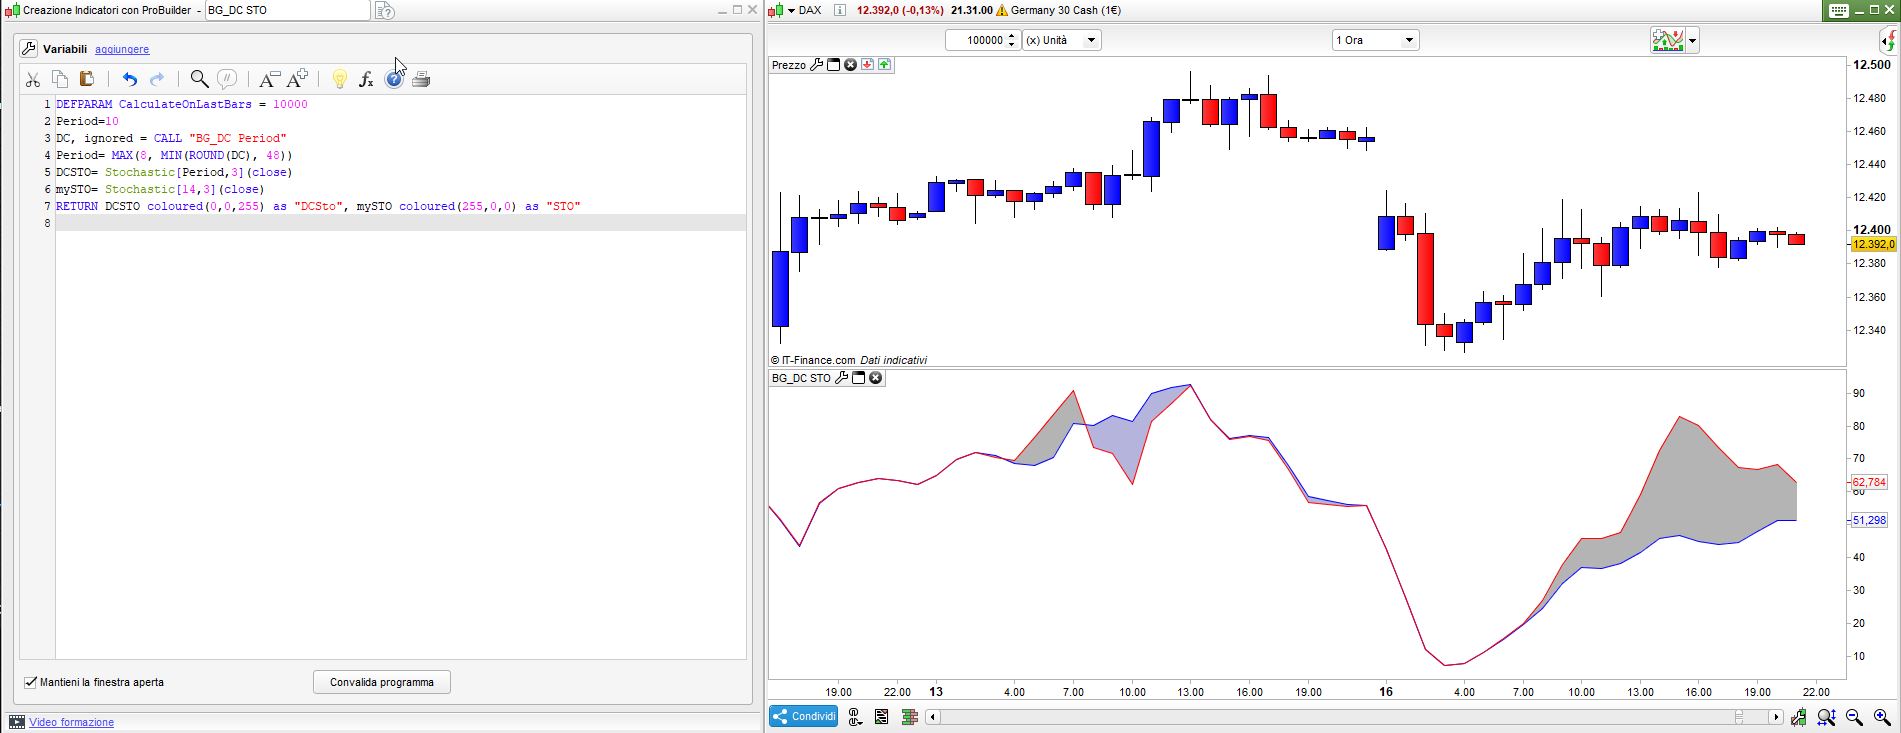
With this code I get two lines drawn in a separate indicator window – do you?
period = 10
DCSTO= Stochastic[Period,3](close)
mySTO= Stochastic[14,3](close)

return dcsto, mysto
BardParticipant
Master
Ah, yes thanks, it works taking out the “d” and using your code but now it says “the variable is not used in the code:bp”?
Pls see https://www.prorealcode.com/topic/dominat-cycle-calculation-by-band-pass-corssing-over/page/2/#post-104226
Cheers
Change BP for IGNORED in the CALL line.
BardParticipant
Master
Hi @Vonasi,
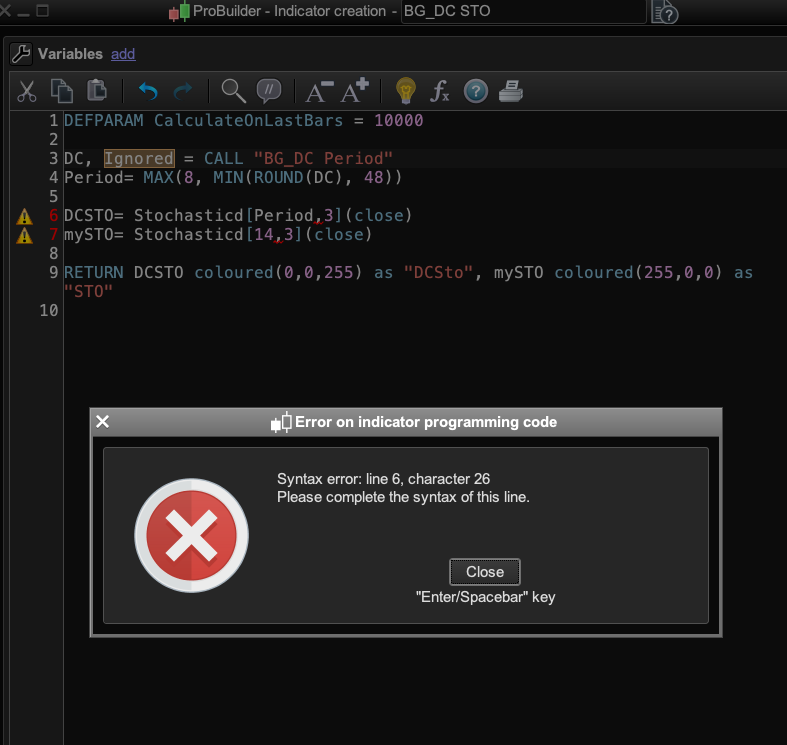
I just noticed something which I don’t understand, I can import BG DC STO (I had deleted it last week) and even with the extra values of “3”:
DCSTO= Stochasticd[Period,3,3](close)
mySTO= Stochasticd[14,3,3](close)
it does load okay onto the bottom of a chart (whereas I am sure weeks ago I couldn’t get it to because of the extra “3” and hence my writing on this thread) but now.. as soon as I replace BG with Ignored and add it, it now gives me this warning — Pls see image:
Your code from post above (#106661) loads fine but then it doesn’t use the dominant cycle period, right? (#104226)
Any ideas!?
Cheers.
Remove the extra “d” from Stochasticd, since it thinks it’s a variable and you are wrongly using two parameters, instead of one, to reference previous bars!
Moreover, use only 2 parameters with STOCHASTIC.
BardParticipant
Master
Sorry, I just realised I had downloaded the original code with the “d” in the code. Removed it. All good now, thanks.
BardParticipant
Master
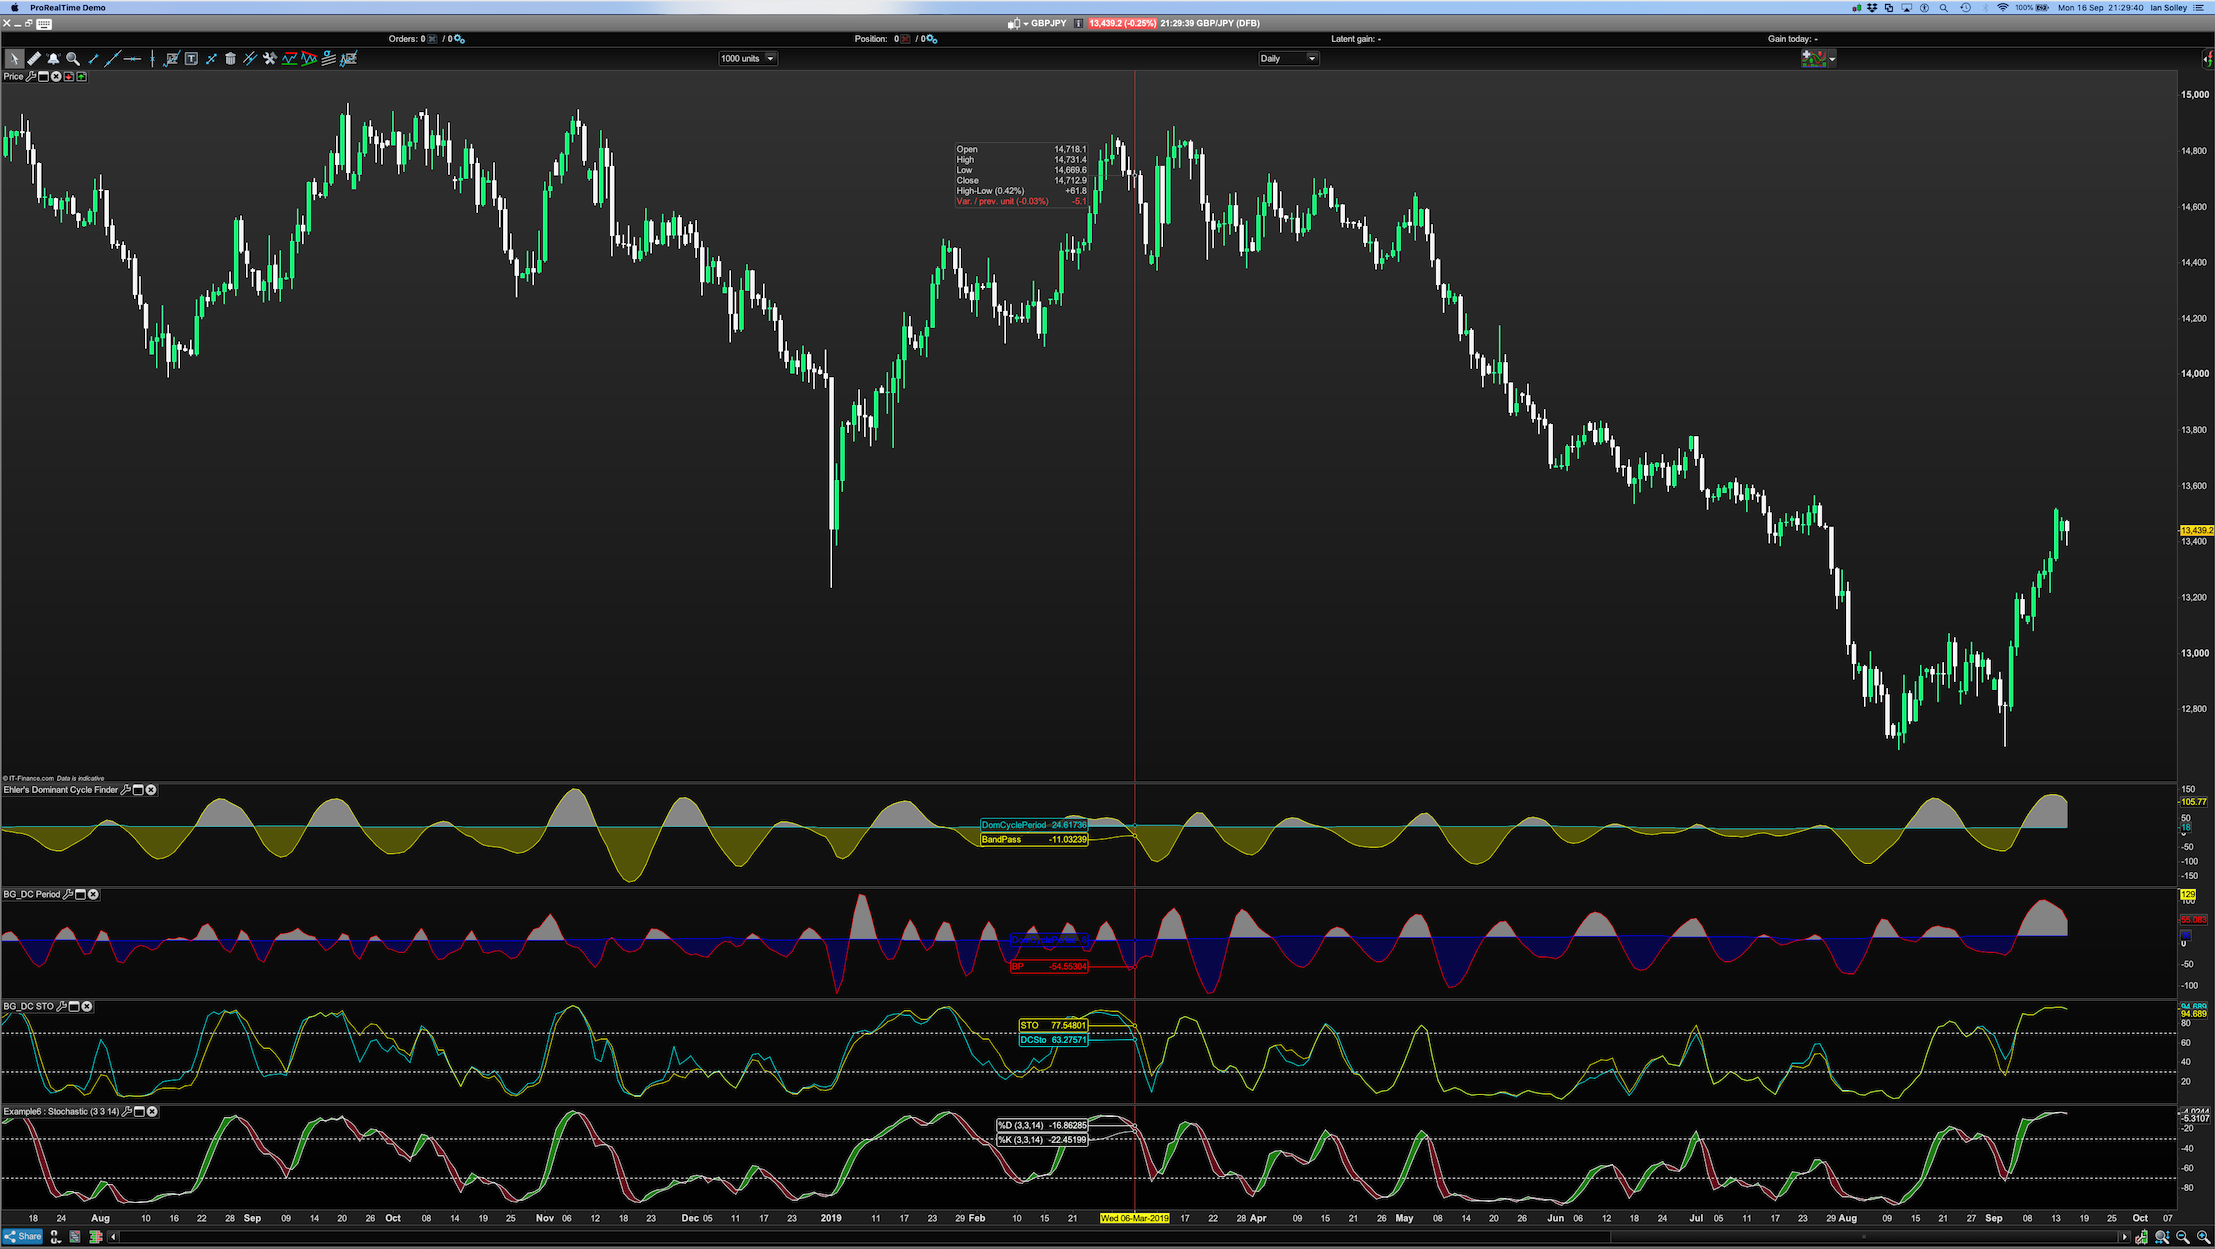
Dominant Cycle Stochastic and regular Stochastic Comparison — £/Y:
BardParticipant
Master
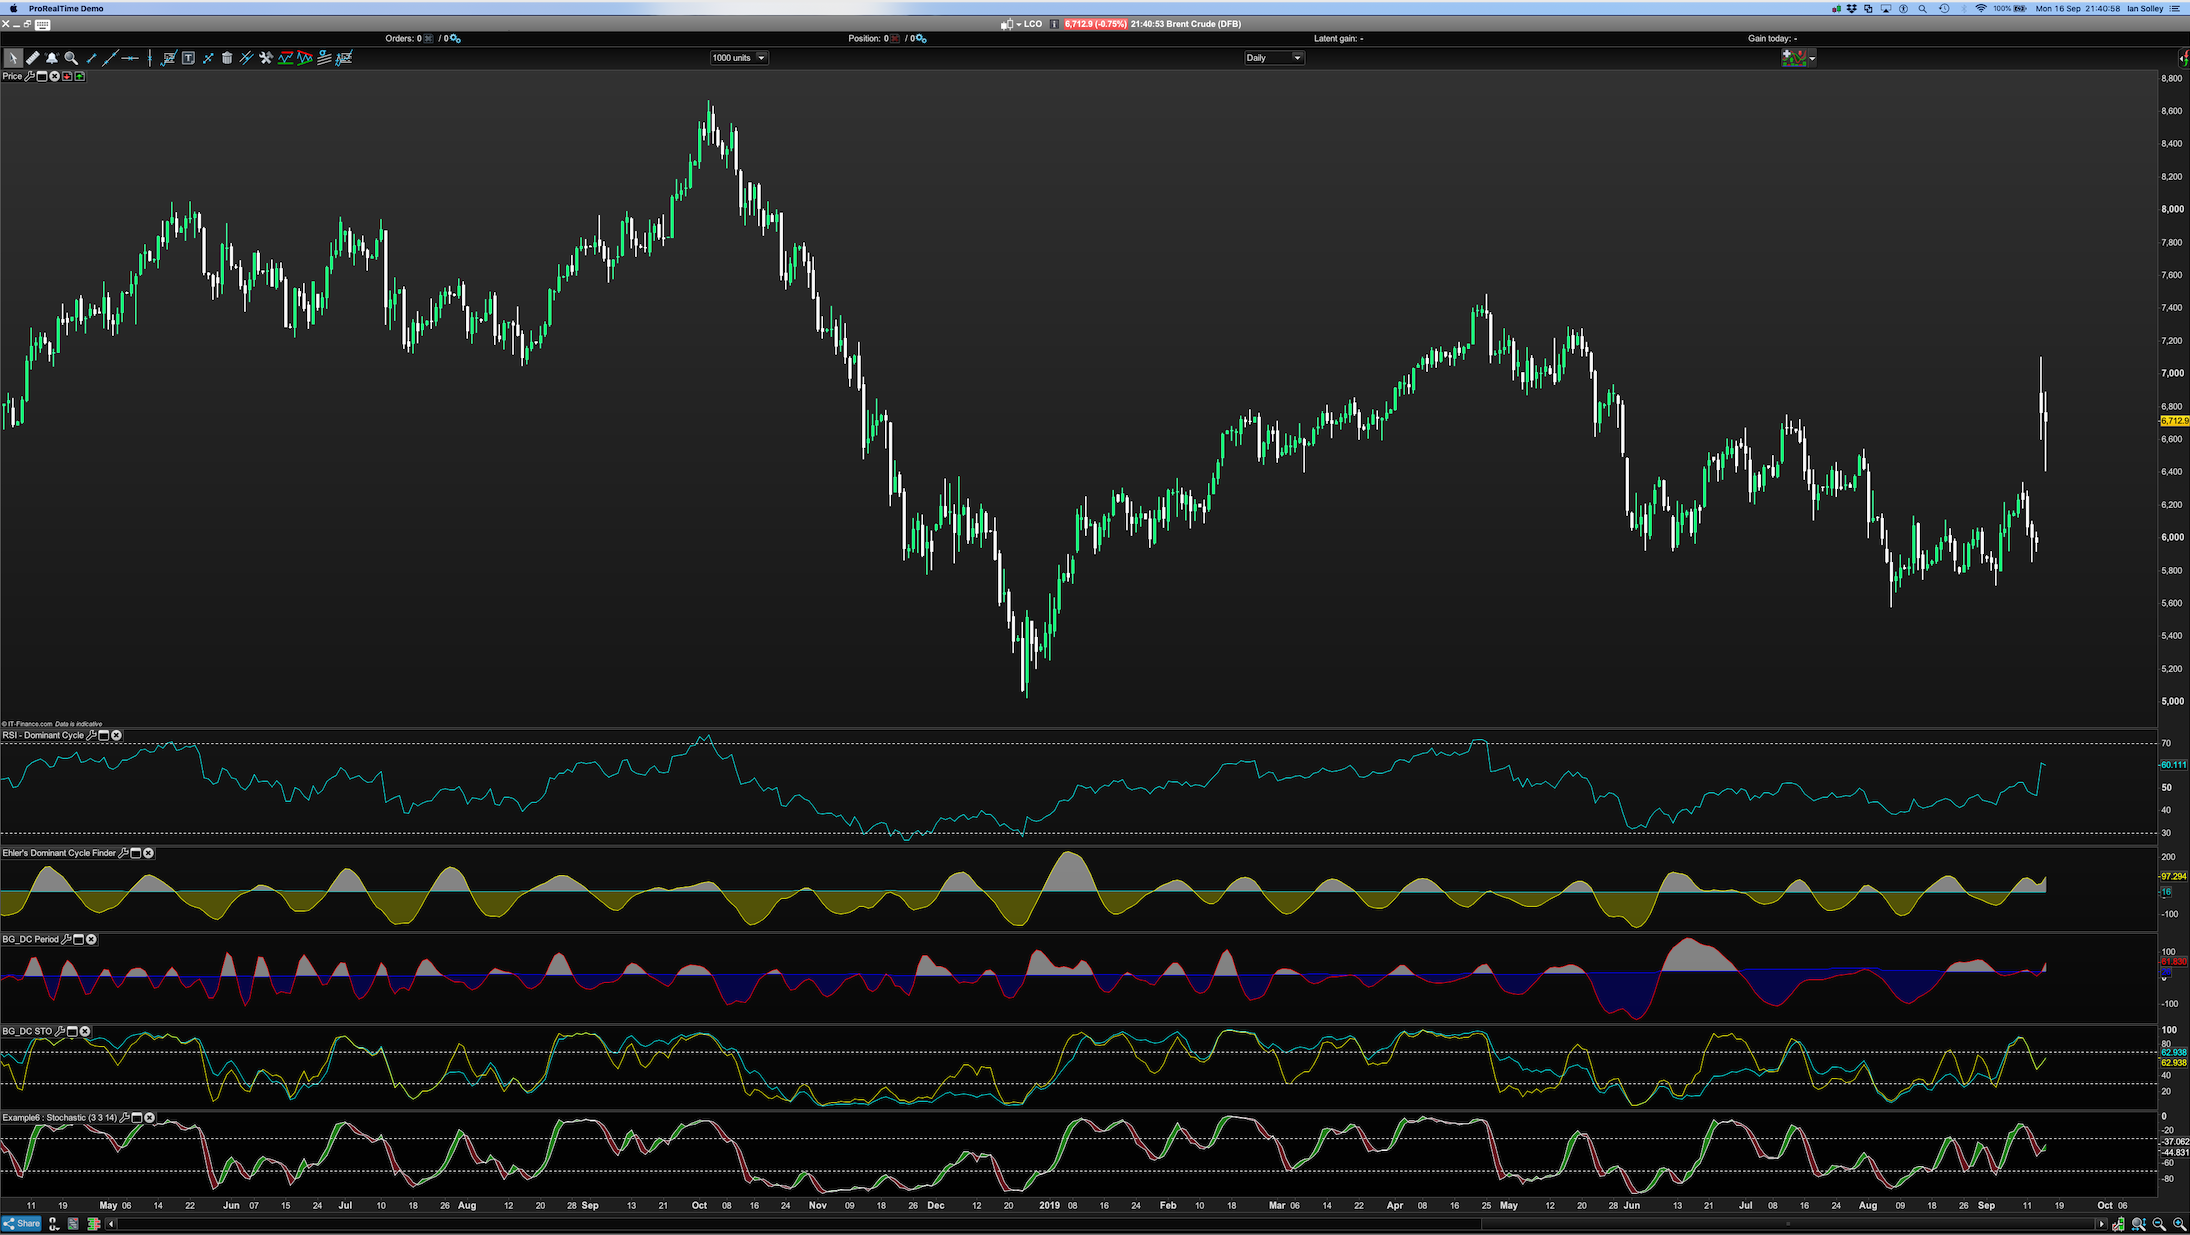
Brent Crude – including Dominant Cycle RSI:
Hi Bard,
niche to see it is working!
Do you have an impression about the advantage?
Best regards
Hasardeur
BardParticipant
Master
Hi Hasardeur,
Yes, all good now! I am not sure if you can use it as a stand alone indicator because these type indicators can stay overbought and oversold for long periods.
I think it’s good to use it (with other indicators) and also when the RSI or Oscillator crosses above the 30 line and below the 70 line. Do you use it on it’s own or do you prefer to use it with another indicator(s)?
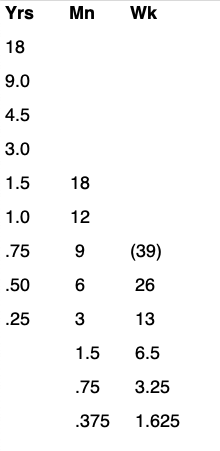
I’ve been reading a lot about Hurst cycles lately. Did you ever find a good indicator that can calculate the average cycle period? John Ehlers MESA Period or his Dominant Cycle Finder I believe will only tell you what the cycle period is right now but Hurst recommends calculating the time period between the lows on daily and weekly charts and then totalling the time up and then averaging these time spans by the number of points identified to determine when the next low. He identified stock market cycles with these time spans – pls see image. It would be great if there was s/ware that could determine those averages. Do you know of anything like this @Nicolas? Like an average cycle finder.
Cheers!
Hi Bard,
mainly I am using the following indicators for ma favorite trading system
Trend: Aroon, Ravi, Momentum: RMI, Trend following: CCI, Volume: Volume MFI
In addition I am looking for Bollinger Bands, Stochastic MADC and volume as second trading system.
The dominant cycle period indicator I am using to tune the above indicators (to the 1*period or 0.5*Period by using DC) in order to be as near as possible to the actual real cycle period.
In order to get an easy overview I have sum up the above indicators in a genesis matrix design.
Best regards
Hasardeur
This is the RAVI indicator developed by @Nicolas (thanks btw)
Range Action Verification Index (RAVI) – extended
This is the RMI indicator developed by @Gabri (thanks btw)
Relative Momentum Index (RMI)