Dear Traders,
Dear Nicolas,
the attached code made by John Ehlers calculates the dominant cycle by counting the zero crossing over of a band pass filter.
The original filter is using a fix DCPeriod of 20.
I have made the code adaptive by iterative using the result of DC instead of fix DCPeriod at the beginning of the code.
So far it is working well.
By changing the actual shown time frame for example from 100 days to 1000 days the DC of the actual bar (today) is sometimes fluctuating.
That means that for example at shown 100 days the DC of the actual bar is 14, by changing the shown timeframe 1000 days DC of the actual bar is 35.
Does someone has an idea to modify the code into a correct and stable iterative Dominant Cycle Period?
Many thanks for your reply in advance.
Hasardeur
REM ---------------------------------------------
REM Modified Dominant Cycle Measured by Zero Crossing of Band Pass filter from Cycle Analytics for Traders by John F.Ehlers 2013
REM ---------------------------------------------

//PeriodDC= 20  //   original by John Ehlers
PeriodDC= MAX(8, MIN(DC, 48))

IF barindex = 1 THEN
BP= 0.01
DC= 20

ELSIF Barindex >= 2 THEN
REM ---------------------------------------------
REM Highpass Filter and BP or SuperSmoother Filter together form a Roofing Filter
REM ---------------------------------------------
HPPrice= close
HPPeriod= PeriodDC
HPBandwidth= 0.3    // 0.7 original Dominant Cycle Measured, 0.3 (0.10-0.50) from Roofing Filter
HPalpha= (COS(0.25*HPBandwidth*360/HPPeriod) + SIN(0.25*HPBandwidth*360/HPPeriod)-1) / COS(0.25*HPBandwidth*360/HPPeriod)
HP= (1+HPalpha/2)*(HPPrice-HPPrice[1]) + (1-HPalpha)*HP[1]

BPPrice= HP
BPPeriod= PeriodDC
BPBandwidth= HPBandwidth
beta= COS(360/BPPeriod)
gamma= 1/COS(360*BPBandwidth/BPPeriod)
BPalpha= gamma - SQRT(gamma*gamma-1)
BP= 0.5*(1-BPalpha)*(BPPrice-BPPrice[2]) + beta*(1+BPalpha)*BP[1] - BPalpha*BP[2]

REM ---------------------------------------------
REM Calculation of Dominant Cycle by counting Zero crossing of BP
REM ---------------------------------------------
CountPrice= BP
DC= DC[1]
DC= MAX(6, DC)
counter= counter + 1
IF CountPrice CROSSES OVER 0 OR CountPrice CROSSES UNDER 0 THEN
DC= 2*counter
ThrashH= 1.11   // original 1.25
IF 2*counter > ThrashH*DC[1] THEN
DC= ThrashH*DC[1]
ENDIF
ThrashL= 0.90   // original 0.8
IF 2*counter < ThrashL*DC[1] THEN
DC= ThrashL*DC[1]
ENDIF
counter= 0
ENDIF

ENDIF

DC= MAX(8, MIN(DC, 48))

RETURN DC coloured(0,0,255) as "DomCyclePeriod"
Thanks for the code, very instructive.
Since you are looking at different data series (100 days or 1000 days), seems obvious that the results are different? Or am I missing something? 😯
Dear Nicolas,
first lets make clear that we are talking about the same.
For example: I am using the iterative code with a daily timeframe and a observation period is 100 or 1000 days.
At the original code the band pass filter (BP) is tuned to a fixed BP period of 20, so the crossing is linked up to the base of 20. If you are using the Ehlers original code (by activating line 5 and voiding line 6) with a BP period of 10 or 40 you will get totally different Dominant Cycle (DC) results. According to my opinion after swing in of the BP the result of DC has to be a stable value and not to fluctuate as described/seen in the original code. The real period is depending by the chart prices and can even be counted manual (DC= full sine wave swing) by viewing the chart!
My idea is to get a more exactly result by using a iteration “self adjusting” by inserting the result of the DC period into the BP filter period (by voiding line 5 and activating line 6).
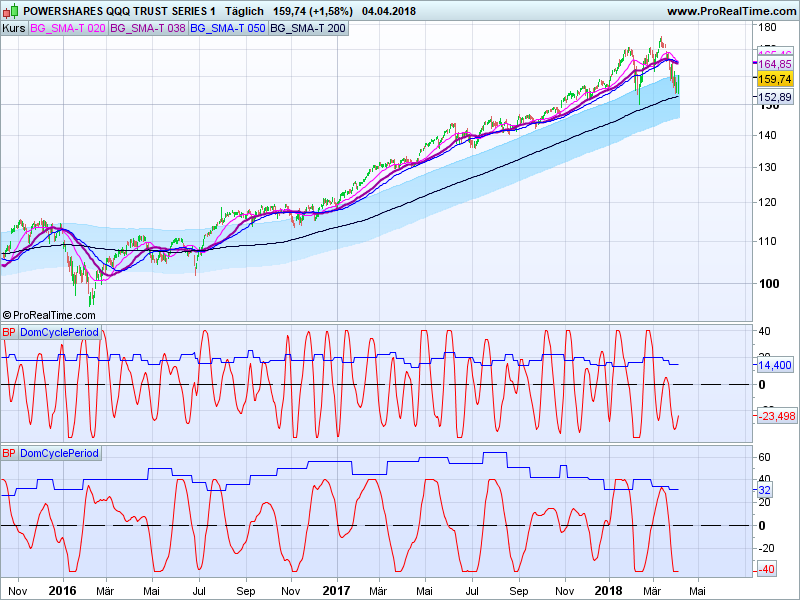
S&P500 DC100 = 52, DC1000 = 52 same
NDX DC100 = 42, DC1000 = 42 same
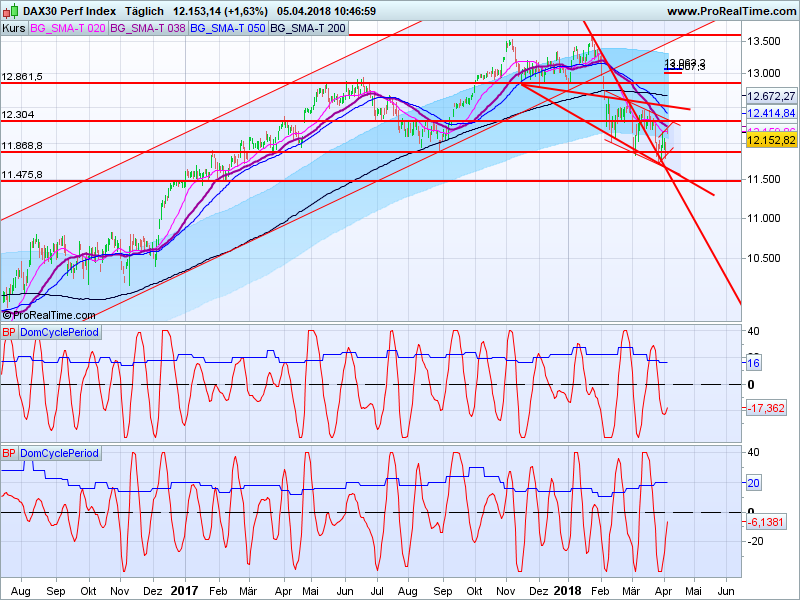
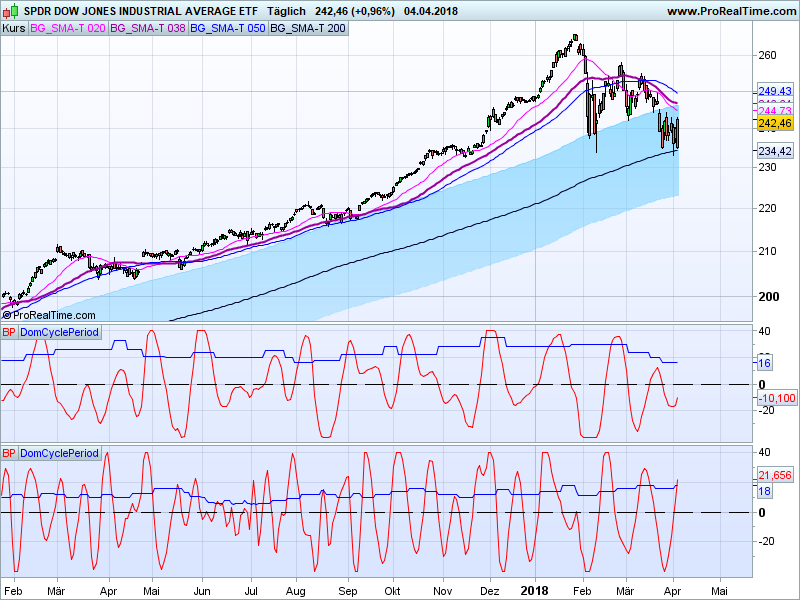
DIA DC100 = 30, DC1000 = 58 not same
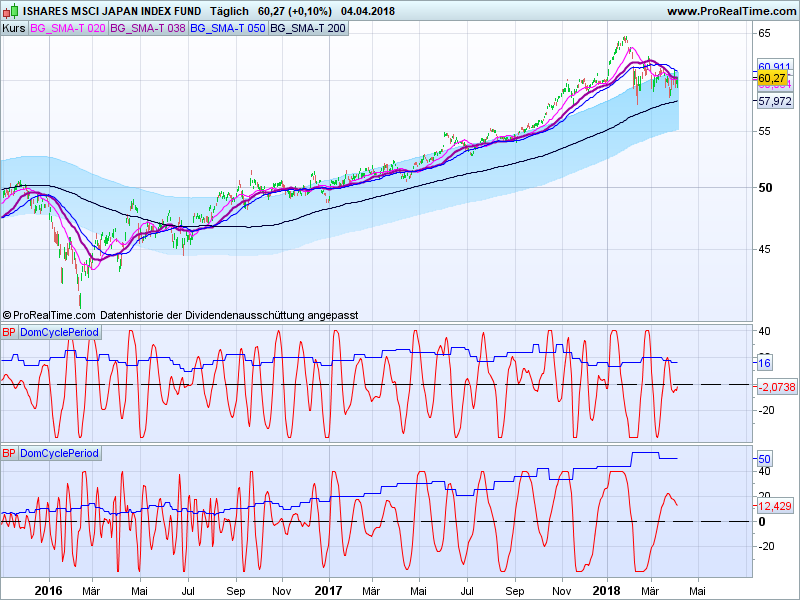
NK225 DC100 = 30, DC1000 = 52 not same
DAX DC100 = 22, DC1000 = 54 not same
According to my opinion the result of the iterative code at the last bar (todays bar) should be the same, independently the used observation period of 100 or 1000 days. Do I have an error in reasoning?
Anyway according to my opinion the original code as well as the modified iterative code are not optimal.
Do you have any idea to optimize one of the codes in order to get an well working DC indicator?
Many thanks for your efforts and return in advance.
Best regards
Hasardeur
The result of the DC period is not the same if you start looking at 0 crossing 100 bars or 1000 bars ago. If you started learning Karate 100 days ago or 1000 days ago, your belt’s color could probably not be the same today.. 🙂 Your code is analog to this example, because it is learning from its previous result with your iterative “loop”.
Dear Nicolas,
for using the indicator it seams to get better results by using the original factor 1.25 and 0.8 of line 39 and 43.
Attached you will find a comparison of the original indicator (middle) and modified iterative indicator (lowest).
As we can see, most of the time the modified indicator is showing a BP more exact indicating the highs and lows.
Also in long trend phases the rising of the period is more intensive by using the modified indicator.
Dear Nicolas,
your example is very good and understandable, so far it is clear.
The benefit of the iteration should also be clear by viewing the results.
Many thanks for your attention and taking care.
Best regards
Hasardeur
Last question:
Is there any possibility to code the start of the period calculation for example 1000 units before observation period starts, in order to be sure that the pre learning phase is sufficient long.
Starting calculation (barindex) = pre calculation phase 1000 units + observation period 100 units.
Many thanks.
Best regards
Hasardeur
You can try to limit the calculation on the exact same bars quantity with CalculateOnLastBars
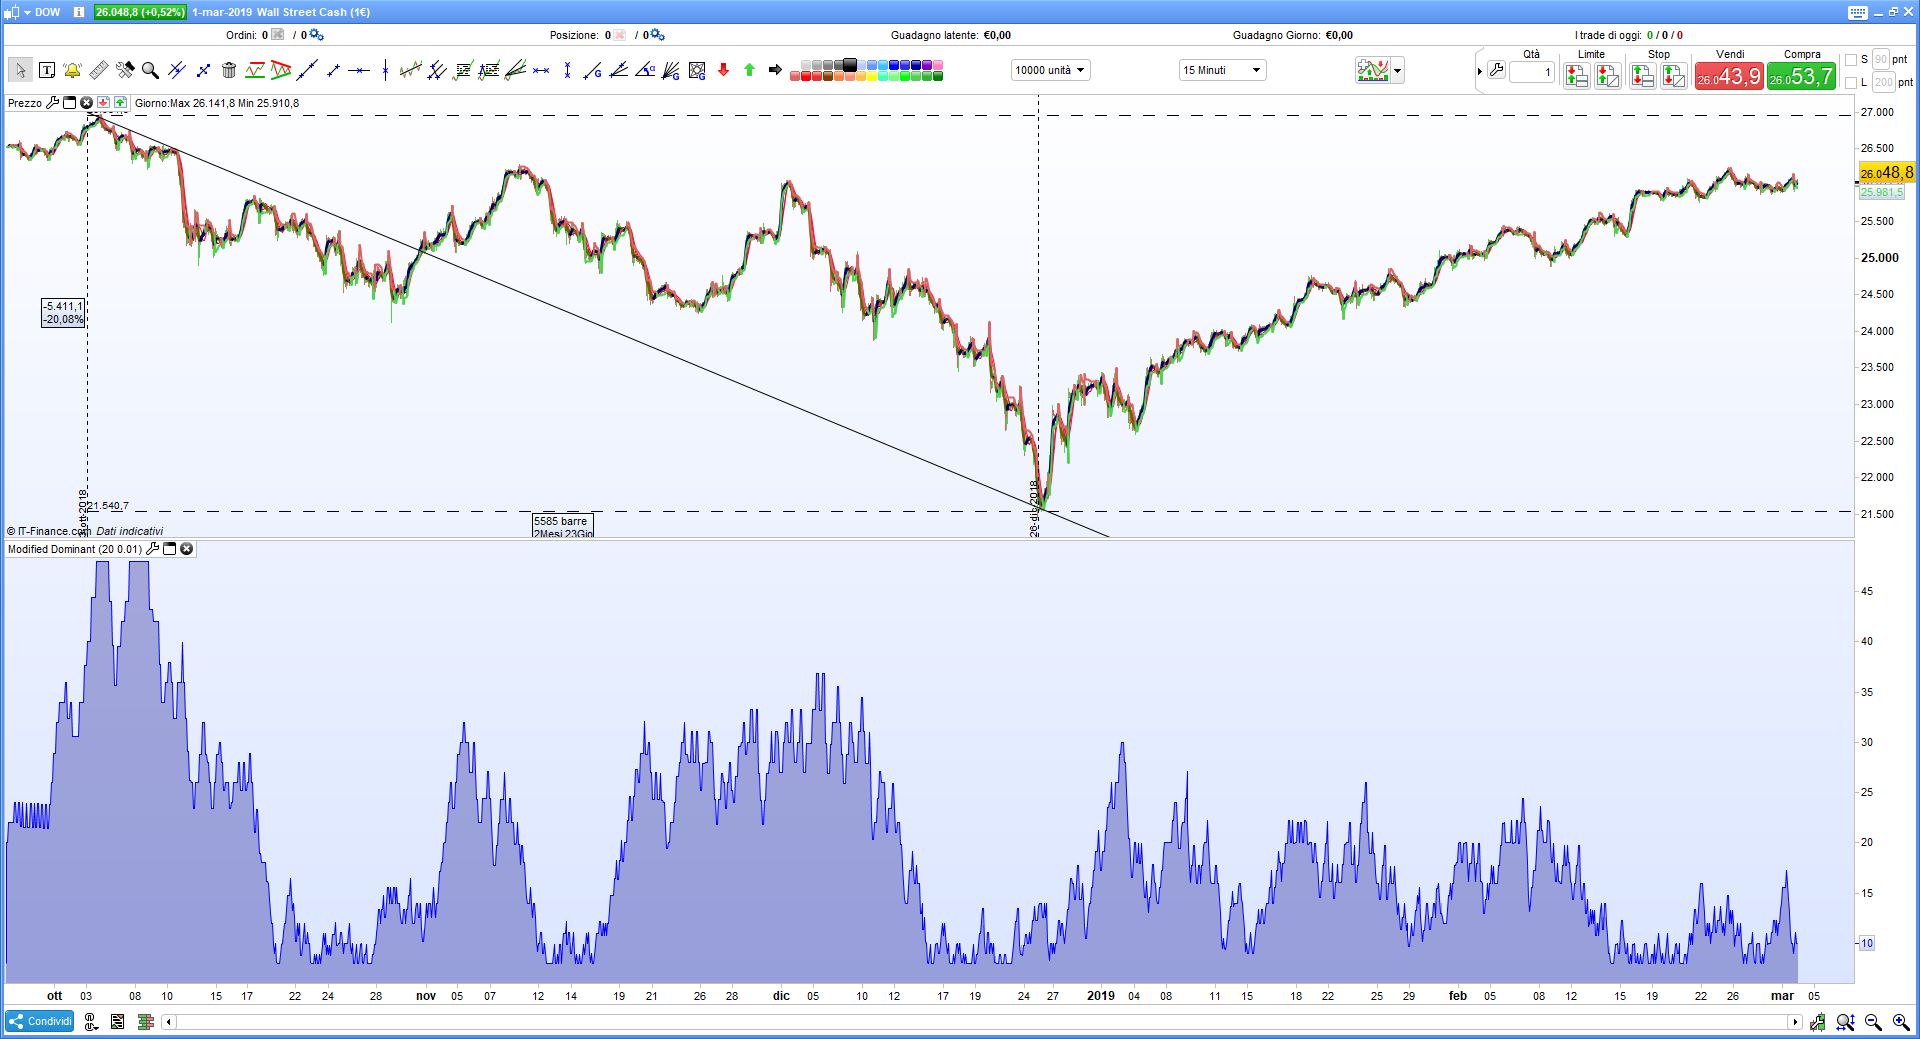
Hello, thank you for your sharing. Sorry but i see the indicator in this way, there is something wrong?
 Bard
BardParticipant
Master
Wondering why the code above does not produce anything like the 4 screenshots which have smooth lines for the DC whereas the code above produces a lock-step rectangle style graph?
Hallo Gianluca,
Hallo Bard,
I expect it is not wrong.
The screenshots above are showing the dominant cycle as step graph (blue).
In order to compare the results by using the different dominant cycle, in addition the bandpass filter is also shown (red).
Bandpass filter is shown in line 28 of the code.
If you would like to have booth please change the return line to:
RETURN DC coloured(0,0,255) as "DomCyclePeriod", BP coloured(255,0,0) as “BandPass”
Best regards
Hasardeur
BardParticipant
Master
Hi Hasardeur
Thanks for the additional code! Have you found a way to automate a strategy using this indicator? It can be wrong when the market is trending strongly.
What do you prefer to use as a trend confirmation, the Mesa Trendline and Kalman filter perhaps?
Cheers
Bard
Hallo Bard,
for example in RSI indicator I use the call function in order to get the variable value of “DomCyclePeriod”.
This value I am inserting in the RSI indicator instead of the fix RSI Period of 13.
Therefor the RSI indicator is made adaptive to the actual period length.
(Please note that you have to choose a period of 1000 units in the chart view)
In result the indicators are made adaptive are more closer to the event as by using the fix time period.
I hope this is helpful for you.
Best regards
Hasardeur
BardParticipant
Master
Hi Hasardeur,
Interesting idea! What would the code look like for that adaptive RSI and have you seen the John Ehlers adaptive oscillators on prorealcode? Nicolas did a great job coding my numerous requests.
Cheers
Bard
Hallo Bard,
i have programmed all the Ehlers staff for myself to test.
In my general opinion the above shown method is the easiest, most practicable and easy to understand.
In addition, the code is self-adjusting by using an iteration of DC.
A code could be as follows:
DC= CALL "DominantCyclePeriod"
myRSI= RSI[DC]
Return myRSI coloured(0,0,255) as "RSIdc"
Best regards
Hasardeur
Moderators edit: Code inserted using ‘Insert PRT Code’ tool. Please use it in future posts.