Bard
BardParticipant
Master
You lost me at arrays! But thanks for taking the time to explain what is obviously a mammoth job (and probably one you may have regretted starting 😳). Will PRT ever cater to arrays (whatever they are)?
I asked Philipp Kahler for the code but I guess it might not help… Kahler does post very interesting work including this post on DOR with the Vix Index:
https://www.quanttrader.com/index.php/statistics-of-vix/KahlerPhilipp2018
Spoiler alert: Short volatility above 25, buy volatility below 15!
An array is a variable with a grid of values that you can fill in. So a simple example is that you can have a variable that has a grid of 20 x 20 values or x and y values. myvariable[1,1] is the top left value and myvariable[20,20] is the bottom right value in the grid Any value can be changed or retrieved just by referring to its location. Then imagine the same idea but with more than just x,y We can have a value stored at location myvariable[v,w,x,y]. At the moment without arrays we are limited to just storing and retrieving values from mayvariable or myvariable2 or myvariable3 and then using IF THEN questions to decide which one variable we want change or access the value for.
As far as I am aware (from conversations with Nicolas) arrays and PRT are not likely in the near future even though there is very high demand for them from those trying to write more complex code. It will be a game changer when they do arrive especially given the current extreme limitations of using loops in PRT – but I wouldn’t hold my breath!
BardParticipant
Master
Cheers for the explanation, I couldn’t get my head around arrays when I looked them up before but this explains it perfectly. Seems strange PRT wouldn’t incorporate something so powerful but I guess that would involve a huge amount of time and programming.
BardParticipant
Master
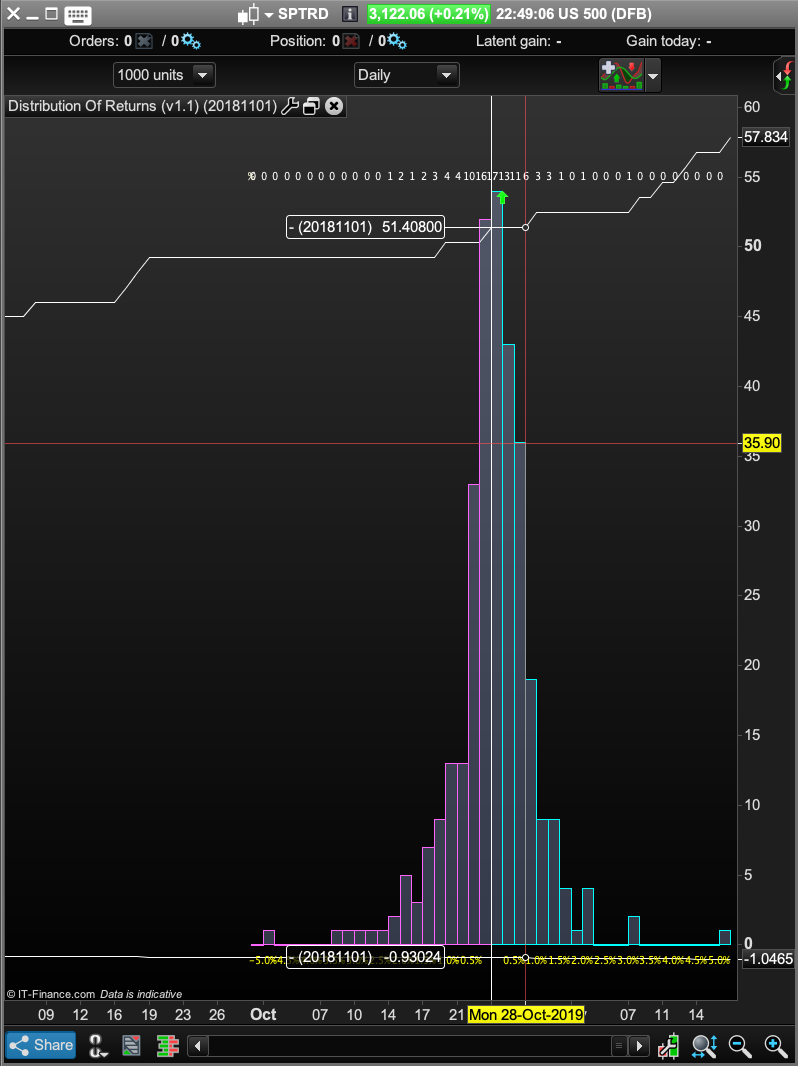
Hi Vonasi, I’m using you’re distribution plot which is really very good at instantly showing the “skew of market returns” and the percentage of days that the market hit specific rates of return. I currently have it set on the S&P 500’s.
Could you please explain from the screenshot posted below what the values of 0.93 at the bottoms represents? I thought it was set hard with 0.25% buckets so I wasn’t sure how a return of 0.93 shows up. Also the line at the top with 51.40? Is that the number of days that had returns of 0.75%? (where my crosshair is set).
I wondered is there anyway to overlay/show the 1, 2 and 3 std deviations like you see on probability density function charts?
I also wondered if Kahler’s code for a cumulative distribution curve could be added/overlaid? https://www.quanttrader.com/index.php/tradesignal-returns-distribution-indikator
Cheers!
	35	for j=1 to 200 begin // draw probability curve and cum%
	36	N[j]=N[j]/s; // norm probability curve
	37	drawline[-j](100*N[j],"% probability");
	38	s1=s1+N[j]; // sum probability from low to top
	39	if showcumprob then drawline[-j](scaleSumProbFact*s1,"Cum %");
	40	if mod(j,5)=0 or j=1 then begin
	41	if j<>1 then tx=round(ll+j*(hh-ll)/200,2) else tx=round(ll,2);
	42	drawtext[-j](-0.1,"%",tx);
The two lines should be left invisible (they are drawn with a contrast of zero in the code – I use a white background and they are not visible but it seems that they are on your black background) They mean nothing they are simply scale lines drawn so that when the chart is drawn it is all displayed in the indicator window as the lines set the top of the window and the bottom of the window. You should just set them to invisible in the indicator settings window.
As for the add-ons you’d like. At the moment I’m taking a break from coding due to other (boat) commitments. Any modifications and developments by me of this indicator and any others are at the moment on hold – sorry.