Can share code if pro real-time screen can detect Cup and Handle Pattern, or others such as High tight flag and (VCP) volatility contraction patterns mentioned by Mark Minervini
thanks
Try this link https://www.prorealcode.com/topic/screener-detection-figure-tasse-et-anse/, it’s written in french but you can take advantage of google translator.
In order to help with the “High tight flag” and “volatility contraction patterns”, please add a full description of what are they and with pictures if possible.
Hello and thanks to all the coders and members. I am also interested in High Tight Flag patterns. Here is another website that explains it. http://www.thepatternsite.com/htf.html
The volatility contraction pattern, is IMO similar of what we could find with this screener: Trend Template by Mark Minervini
I will double check high tight flag pattern, but I think that we could code something relevant for this.
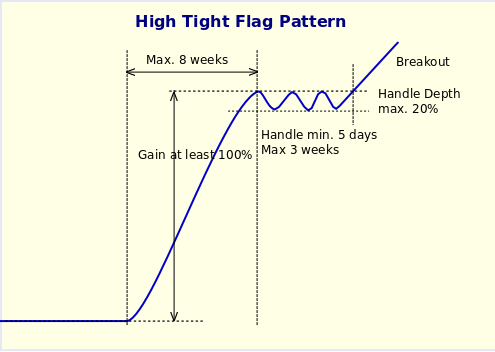
EDIT: Found this well explained HTF pattern picture on the web:
[attachment file=82634]
This is a first (rough) try for the High Tight Flag pattern screener:
timeframe(weekly)
//gain at least 100% in the last 8 weeks
if (close-close[8])/close[8]>=1 then
hh=high
endif

timeframe(default)
if hh<>hh[1] and hh>hh[1] then
start=barindex
endif
now = barindex-start
c1 = high<hh
c2 = (hh-close)/hh<0.2
c3 = now>=5 and now<=15
conditions = c1 and c2 and c3

screener [conditions] (now)
Thanks Nicolas,it looks ok I guess. I was scanning north american stocks and seen more bear flags then bull flags. that is the way the market has been lately. Did you write the code for a bull flag or bear flag ? $BTG is has broken out and might be room for more upside on Volume
The screener code I made is only intended to find bullish flags.
Thanks Nicholas for the code of high tight flag
For Volatility Contraction Pattern, the trend template do not take into account the consecutive 2 to 6 time of contraction in volatility and volume.
It is possible to code a screener based on the trend of reduction in past x weeks for ATR (average true range for volatility) and volume?
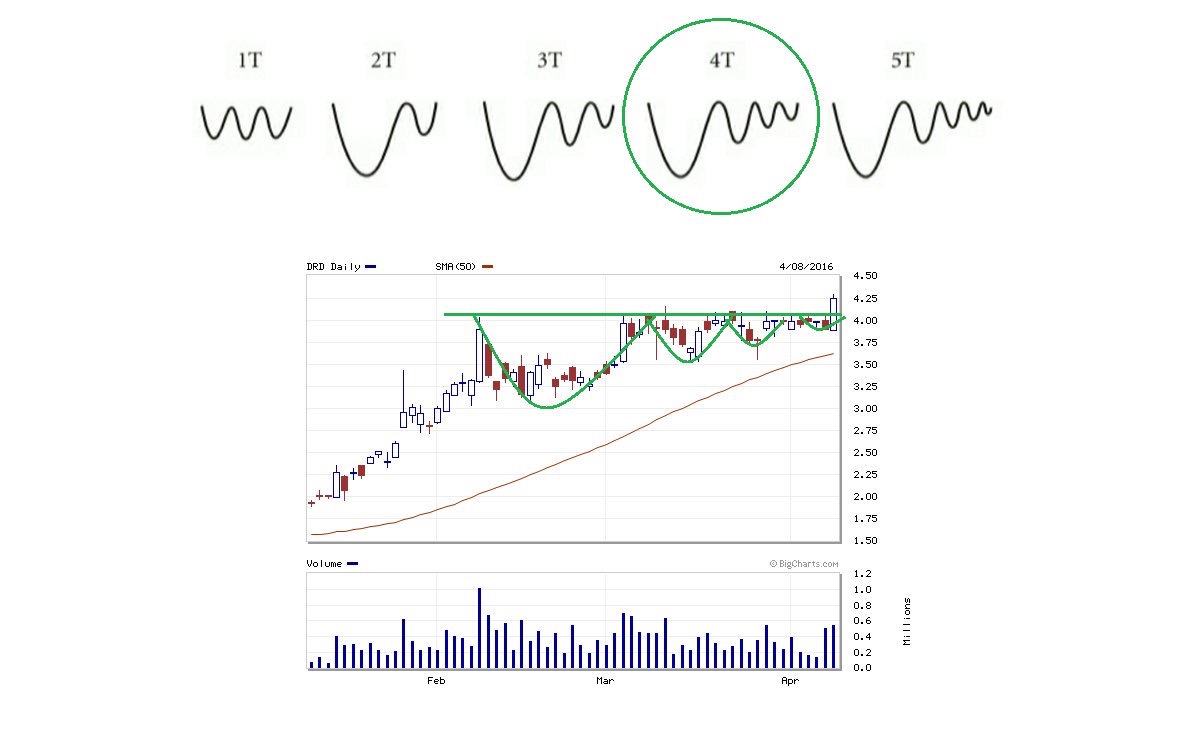
Recap VCP details as follow:
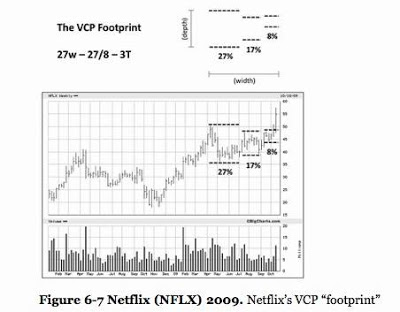
During a VCP, you will generally see a succession of anywhere from two to six contractions, with the stock coming off initially by, say, 25 percent from its absolute high to its low. Then the stock rallies a bit, and then it sells off 15 percent. Then buyers come back in, and the price goes up some more,and finally it retreats 8 percent. The progressive reduction in price volatility, which will be accompanied by a reduction in volume at particular points, eventually signifies that the base has been completed.
As a rule of thumb, I like to see each successive contraction contained to about half (plus or minus a reasonable amount) of the previous pullback or contraction. The volatility, measured from high to low, will be greatest when sellers rush to take profits. When sellers become scarcer, the price correction will not be as dramatic, and volatility will decrease. Typically, most VCP setups will be formed by two to four contractions, although sometimes there can be as many as five or six. This action will produce a pattern, which also reveals the symmetry of the contractions being formed. I call these contractions Ts.
Scanning for very precise percentage like in your example should be very restrictive and some shares could not be retrieved even if they would be good candidate for the pattern.
I’m wondering if scanning for 3 consecutive highest high / lowest low channel could not be sufficient, let me try.
Hi Nocholas,
Are there any update on below? Many thanks!
Scanning for very precise percentage like in your example should be very restrictive and some shares could not be retrieved even if they would be good candidate for the pattern.
I’m wondering if scanning for 3 consecutive highest high / lowest low channel could not be sufficient, let me try.
Hello Traders!
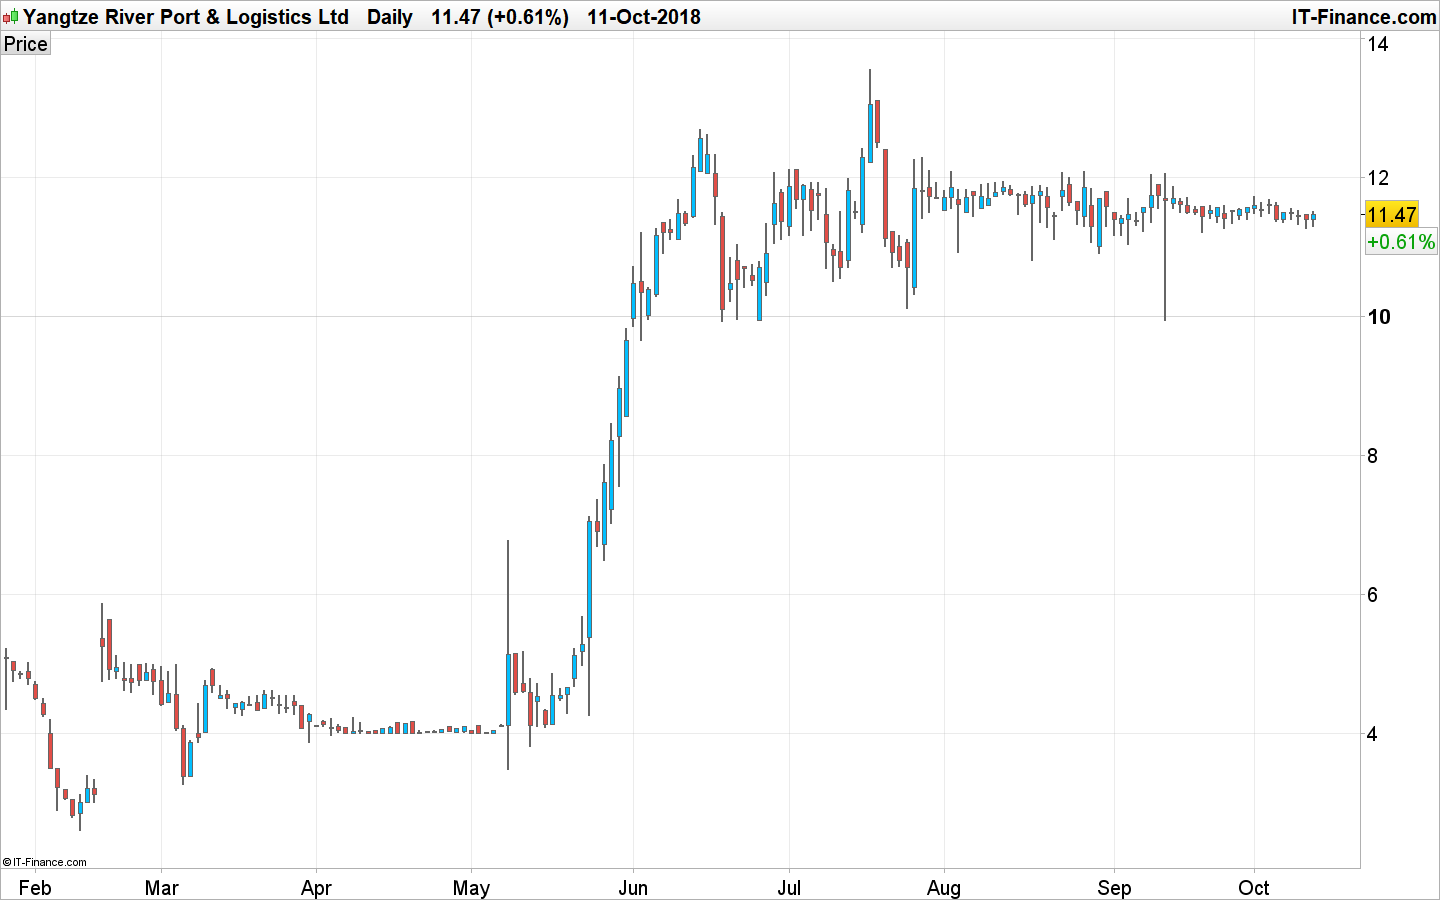
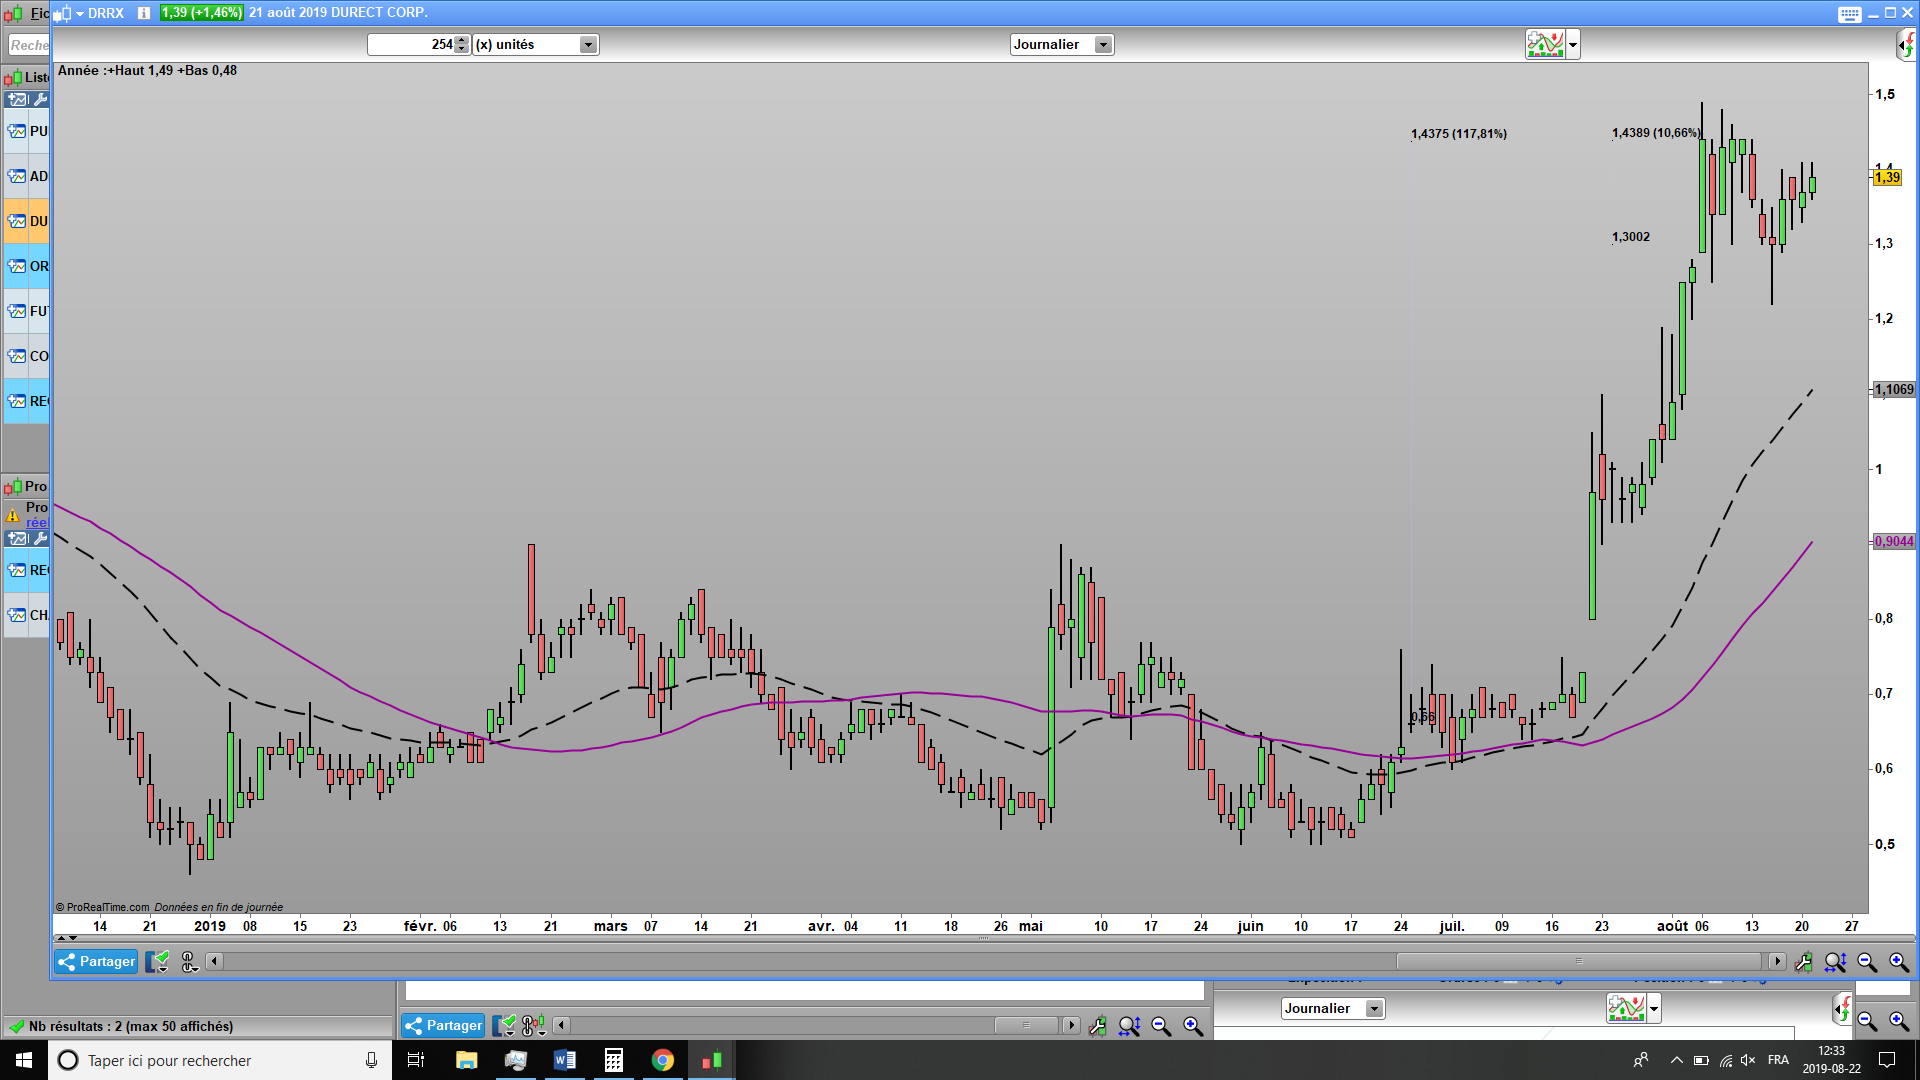
Please, have a look of another version of High Tight Flag pattern screener, after Nicolas on 10/12/2018.
Look at a result on 21/08/2019 and see what’s happen next days…
Please test it, and give me your feed back.
You can also answer me in French! Merci.
/ PATTERN High Tight Flag
// didouqc
// After first version of Nicolas on 10/12/2018

//gain at least 100% in the last 8 weeks
toto1 = highest[5*3](close[1])
a = close[8*5] * 2
C0 = toto1 > a

// from 5 days to 3 weeks: no more 20%
tata1 = lowest[5*3](close[1])
tata2 = lowest[5*1](close[1])

c2 = (toto1 <= tata1 * 1.20 ) OR ( toto1 <= tata2 * 1.20 )

c1 = close < toto1

conditions = c0 and C1 and c2

screener [conditions] (Volume as "Vol")