Cumulative Delta Volume from Tradingview

Viewing 2 posts - 1 through 2 (of 2 total)
  • Author
    Posts
  • #178103 quote
    julien1978julien1978
    Participant
    Average

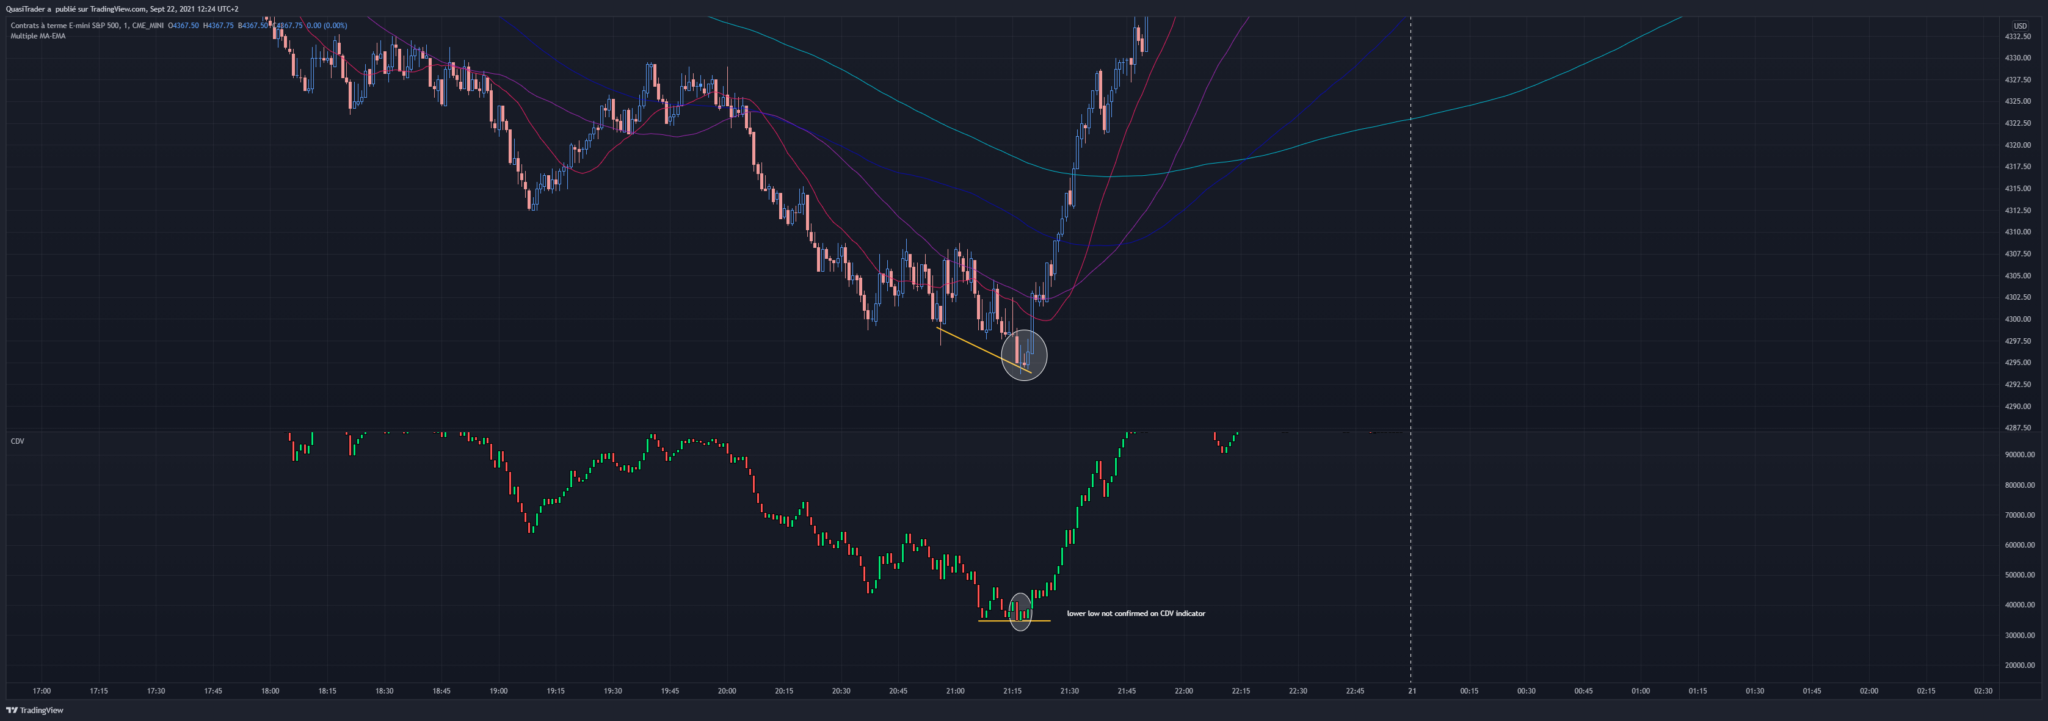
    Would it be possible to adapt the following code from Tradingview into Prorealtime?

    study(“Cumulative Delta Volume”, “CDV”)
    linestyle = input(defval = ‘Candle’, title = “Style”, options = [‘Candle’, ‘Line’])
    hacandle = input(defval = true, title = “Heikin Ashi Candles?”)
    showma1 = input(defval = false, title = “Show SMA 1”)
    ma1len = input(defval = 50, title = “SMA 1 Length”, minval = 1)
    showma2 = input(defval = false, title = “Show SMA 2”)
    ma2len = input(defval = 200, title = “SMA 2 Length”, minval = 1)
    showema1 = input(defval = false, title = “Show EMA 1”)
    ema1len = input(defval = 50, title = “EMA 1 Length”, minval = 1)
    showema2 = input(defval = false, title = “Show EMA 2”)
    ema2len = input(defval = 200, title = “EMA 1 Length”, minval = 1)

    tw = high – max(open, close)
    bw = min(open, close) – low
    body = abs(close – open)

    _rate(cond) =>
    ret = 0.5 * (tw + bw + (cond ? 2 * body : 0)) / (tw + bw + body)
    ret := nz(ret) == 0 ? 0.5 : ret
    ret

    deltaup = volume * _rate(open <= close)
    deltadown = volume * _rate(open > close)
    delta = close >= open ? deltaup : -deltadown
    cumdelta = cum(delta)
    float ctl = na
    float o = na
    float h = na
    float l = na
    float c = na
    if linestyle == ‘Candle’
    o := cumdelta[1]
    h := max(cumdelta, cumdelta[1])
    l := min(cumdelta, cumdelta[1])
    c := cumdelta
    ctl
    else
    ctl := cumdelta

    plot(ctl, title = “CDV Line”, color = color.blue, linewidth = 2)

    float haclose = na
    float haopen = na
    float hahigh = na
    float halow = na
    haclose := (o + h + l + c) / 4
    haopen := na(haopen[1]) ? (o + c) / 2 : (haopen[1] + haclose[1]) / 2
    hahigh := max(h, max(haopen, haclose))
    halow := min(l, min(haopen, haclose))

    c_ = hacandle ? haclose : c
    o_ = hacandle ? haopen : o
    h_ = hacandle ? hahigh : h
    l_ = hacandle ? halow : l

    plotcandle(o_, h_, l_, c_, title=’CDV Candles’, color = o_ <= c_ ? color.lime : color.red)

    plot(showma1 and linestyle == “Candle” ? sma(c_, ma1len) : na, title = “SMA 1”, color = color.lime)
    plot(showma2 and linestyle == “Candle” ? sma(c_, ma2len) : na, title = “SMA 2”, color = color.red)
    plot(showema1 and linestyle == “Candle” ? ema(c_, ema1len) : na, title = “EMA 1”, color = color.lime)
    plot(showema2 and linestyle == “Candle” ? ema(c_, ema2len) : na, title = “EMA 2”, color = color.red)


    See an example in the attached file.

    Thank you in advance!

    ES1_2021-09-22_12-24-14.png ES1_2021-09-22_12-24-14.png
    #196894 quote
    NicolasNicolas
    Keymaster
    Legend

    You can find a version of Cumulative Volume Delta here: https://www.prorealcode.com/topic/conversion-of-delta-volume/#post-196892

Viewing 2 posts - 1 through 2 (of 2 total)
  • You must be logged in to reply to this topic.

ProRealAI ProRealAI New

Stuck on this ProBuilder code?

Describe what this topic is trying to build, in plain English, and ProRealAI writes the ProRealTime™ indicator, screener or system for you.

Available in 7 languages
Try ProRealAI

Cumulative Delta Volume from Tradingview


ProBuilder: Indicators & Custom Tools

New Reply
Author
author-avatar
julien1978 @julien1978 Participant
Summary

This topic contains 1 reply,
has 2 voices, and was last updated by NicolasNicolas

4 years, 2 months ago.

Topic Details
Forum: ProBuilder: Indicators & Custom Tools
Language: English
Started: 09/22/2021
Status: Active
Attachments: 1 files
ProRealCode ProRealCode
Loading...