Hi Nicholas,
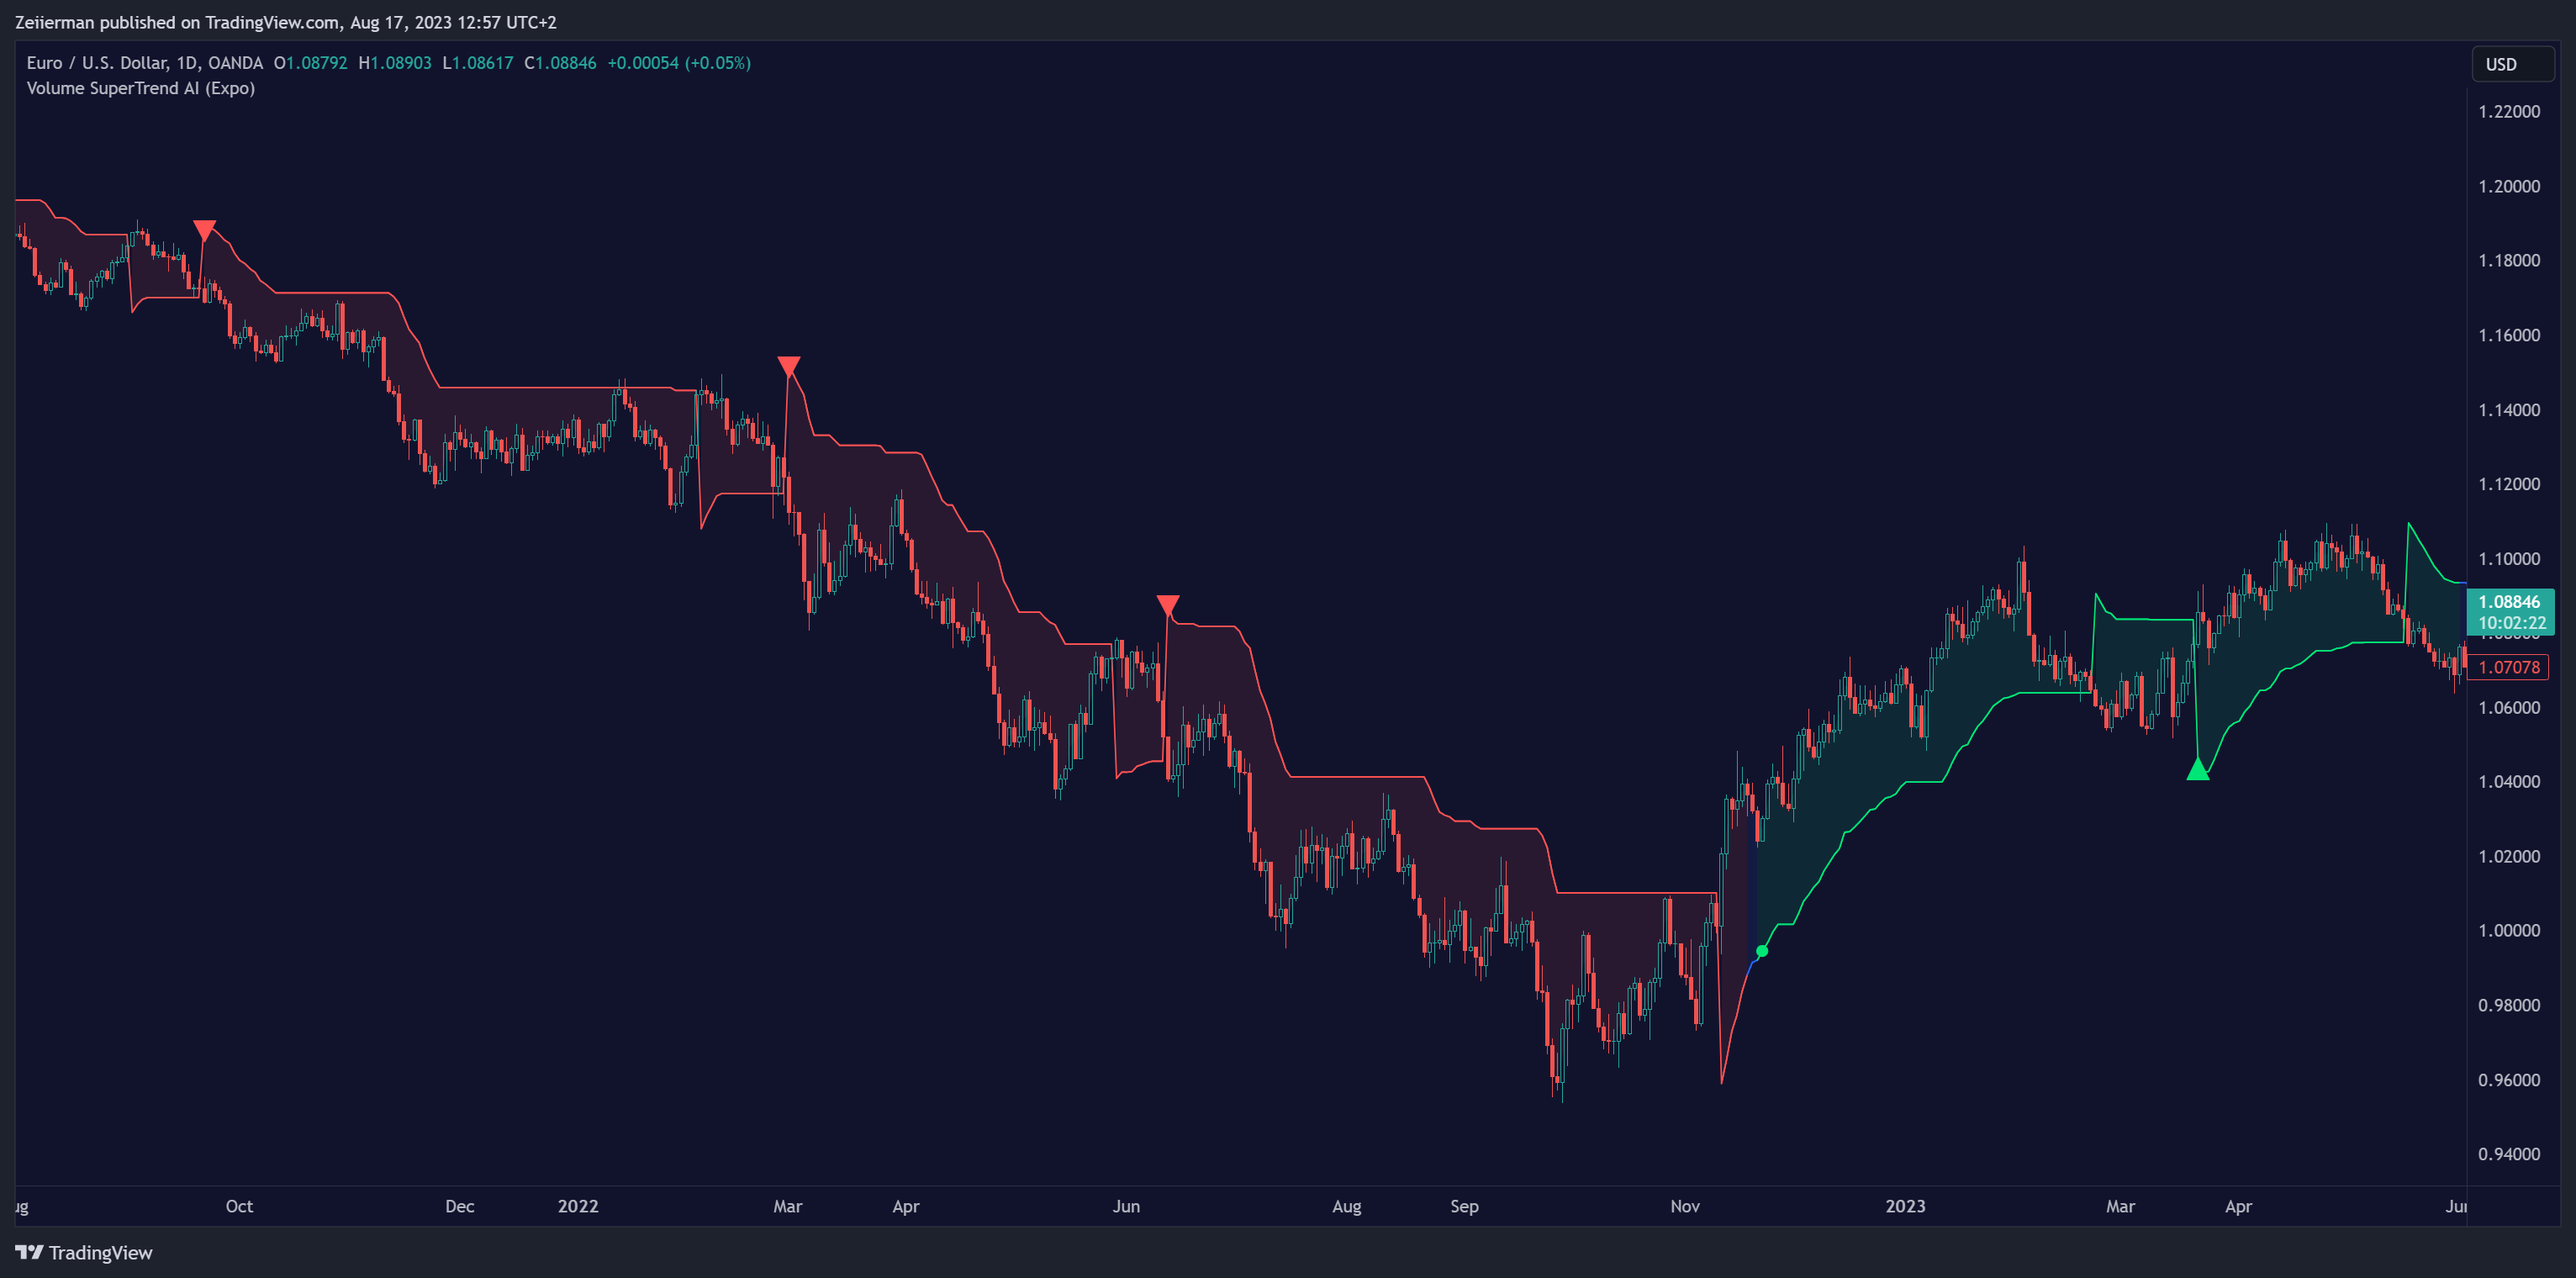
Would it be possible to convert the Volume SuperTrend AI indicator to ProRealTime code? It would be greatly appreciated.
The details of this indicator can be found at: https://www.tradingview.com/script/eTgP2ymK-Volume-SuperTrend-AI-Expo/
█ Overview
The Volume SuperTrend AI is an advanced technical indicator used to predict trends in price movements by utilizing a combination of traditional SuperTrend calculation and AI techniques, particularly the k-nearest neighbors (KNN) algorithm.
The Volume SuperTrend AI is designed to provide traders with insights into potential market trends, using both volume-weighted moving averages (VWMA) and the k-nearest neighbors (KNN) algorithm. By combining these approaches, the indicator aims to offer more precise predictions of price trends, offering bullish and bearish signals.
Many thanks.
——-TRADINGVIEW CODE BELOW—————————————————————————————–
// This work is licensed under a Attribution-NonCommercial-ShareAlike 4.0 International (CC BY-NC-SA 4.0) https://creativecommons.org/licenses/by-nc-sa/4.0/
// © Zeiierman
//@version=5
indicator(“Volume SuperTrend AI (Expo)”, overlay=true)
// ~~ ToolTips {
t1=”Number of nearest neighbors in KNN algorithm (k): Increase to consider more neighbors, providing a more balanced view but possibly smoothing out local patterns. Decrease for fewer neighbors to make the algorithm more responsive to recent changes. \n\nNumber of data points to consider (n): Increase for more historical data, providing a broader context but possibly diluting recent trends. Decrease for less historical data to focus more on recent behavior.”
t2=”Length of weighted moving average for price (KNN_PriceLen): Higher values create a smoother price line, influencing the KNN algorithm to be more stable but less sensitive to short-term price movements. Lower values enhance responsiveness in KNN predictions to recent price changes but may lead to more noise. \n\nLength of weighted moving average for SuperTrend (KNN_STLen): Higher values lead to a smoother SuperTrend line, affecting the KNN algorithm to emphasize long-term trends. Lower values make KNN predictions more sensitive to recent SuperTrend changes but may result in more volatility.”
t3=”Length of the SuperTrend (len): Increase for a smoother trend line, ideal for identifying long-term trends but possibly ignoring short-term fluctuations. Decrease for more responsiveness to recent changes but risk of more false signals. \n\nMultiplier for ATR in SuperTrend calculation (factor): Increase for wider bands, capturing larger price movements but possibly missing subtle changes. Decrease for narrower bands, more sensitive to small shifts but risk of more noise.”
t4=”Type of moving average for SuperTrend calculation (maSrc): Choose based on desired characteristics. SMA is simple and clear, EMA emphasizes recent prices, WMA gives more weight to recent data, RMA is less sensitive to recent changes, and VWMA considers volume.”
t5=”Color for bullish trend (upCol): Select to visually identify upward trends. \n\nColor for bearish trend (dnCol): Select to visually identify downward trends.\n\nColor for neutral trend (neCol): Select to visually identify neutral trends.”
//~~~~~~~~~~~~~~~~~~~~~~~~~~~~~~~~~~~~~~~~~~~~~~~~~~~~~~~~~~~~~~~~~~~~~~~~~~~~~~~~~~~~~~~~~~~~~~~~~~~~~~~~~~~~~~~~~~~~~}
// ~~ Input settings for K and N values
k = input.int(3, title = “Neighbors”, minval=1, maxval=100,inline=”AI”, group=”AI Settings”)
n_ = input.int(10, title =”Data”, minval=1, maxval=100,inline=”AI”, group=”AI Settings”, tooltip=t1)
n = math.max(k,n_)
//~~~~~~~~~~~~~~~~~~~~~~~~~~~~~~~~~~~~~~~~~~~~~~~~~~~~~~~~~~~~~~~~~~~~~~~~~~~~~~~~~~~~~~~~~~~~~~~~~~~~~~~~~~~~~~~~~~~~~}
// ~~ Input settings for prediction values
KNN_PriceLen = input.int(20, title=”Price Trend”, minval=2, maxval=500, step=10,inline=”AITrend”, group=”AI Trend”)
KNN_STLen = input.int(100, title=”Prediction Trend”, minval=2, maxval=500, step=10, inline=”AITrend”, group=”AI Trend”, tooltip=t2)
aisignals = input.bool(true,title=”AI Trend Signals”,inline=”signal”, group=”AI Trend”)
Bullish_col = input.color(color.lime,””,inline=”signal”, group=”AI Trend”)
Bearish_col = input.color(color.red,””,inline=”signal”, group=”AI Trend”)
//~~~~~~~~~~~~~~~~~~~~~~~~~~~~~~~~~~~~~~~~~~~~~~~~~~~~~~~~~~~~~~~~~~~~~~~~~~~~~~~~~~~~~~~~~~~~~~~~~~~~~~~~~~~~~~~~~~~~~}
// ~~ Define SuperTrend parameters
len = input.int(10, “Length”, minval=1,inline=”SuperTrend”, group=”Super Trend Settings”)
factor = input.float(3.0,step=.1,inline=”SuperTrend”, group=”Super Trend Settings”, tooltip=t3)
maSrc = input.string(“WMA”,”Moving Average Source”,[“SMA”,”EMA”,”WMA”,”RMA”,”VWMA”],inline=””, group=”Super Trend Settings”, tooltip=t4)
upCol = input.color(color.lime,”Bullish Color”,inline=”col”, group=”Super Trend Coloring”)
dnCol = input.color(color.red,”Bearish Color”,inline=”col”, group=”Super Trend Coloring”)
neCol = input.color(color.blue,”Neutral Color”,inline=”col”, group=”Super Trend Coloring”, tooltip=t5)
//~~~~~~~~~~~~~~~~~~~~~~~~~~~~~~~~~~~~~~~~~~~~~~~~~~~~~~~~~~~~~~~~~~~~~~~~~~~~~~~~~~~~~~~~~~~~~~~~~~~~~~~~~~~~~~~~~~~~~}
// ~~ Calculate the SuperTrend based on the user’s choice
vwma = switch maSrc
“SMA” => ta.sma(close*volume, len) / ta.sma(volume, len)
“EMA” => ta.ema(close*volume, len) / ta.ema(volume, len)
“WMA” => ta.wma(close*volume, len) / ta.wma(volume, len)
“RMA” => ta.rma(close*volume, len) / ta.rma(volume, len)
“VWMA” => ta.vwma(close*volume, len) / ta.vwma(volume, len)
atr = ta.atr(len)
upperBand = vwma + factor * atr
lowerBand = vwma – factor * atr
prevLowerBand = nz(lowerBand[1])
prevUpperBand = nz(upperBand[1])
lowerBand := lowerBand > prevLowerBand or close[1] < prevLowerBand ? lowerBand : prevLowerBand
upperBand := upperBand < prevUpperBand or close[1] > prevUpperBand ? upperBand : prevUpperBand
int direction = na
float superTrend = na
prevSuperTrend = superTrend[1]
if na(atr[1])
direction := 1
else if prevSuperTrend == prevUpperBand
direction := close > upperBand ? -1 : 1
else
direction := close < lowerBand ? 1 : -1
superTrend := direction == -1 ? lowerBand : upperBand
//~~~~~~~~~~~~~~~~~~~~~~~~~~~~~~~~~~~~~~~~~~~~~~~~~~~~~~~~~~~~~~~~~~~~~~~~~~~~~~~~~~~~~~~~~~~~~~~~~~~~~~~~~~~~~~~~~~~~~}
// ~~ Collect data points and their corresponding labels
price = ta.wma(close,KNN_PriceLen)
sT = ta.wma(superTrend,KNN_STLen)
data = array.new_float(n)
labels = array.new_int(n)
for i = 0 to n – 1
data.set(i, superTrend[i])
label_i = price[i] > sT[i] ? 1 : 0
labels.set(i, label_i)
//~~~~~~~~~~~~~~~~~~~~~~~~~~~~~~~~~~~~~~~~~~~~~~~~~~~~~~~~~~~~~~~~~~~~~~~~~~~~~~~~~~~~~~~~~~~~~~~~~~~~~~~~~~~~~~~~~~~~~}
// ~~ Define a function to compute distance between two data points
distance(x1, x2) =>
math.abs(x1 – x2)
//~~~~~~~~~~~~~~~~~~~~~~~~~~~~~~~~~~~~~~~~~~~~~~~~~~~~~~~~~~~~~~~~~~~~~~~~~~~~~~~~~~~~~~~~~~~~~~~~~~~~~~~~~~~~~~~~~~~~~}
// ~~ Define the weighted k-nearest neighbors (KNN) function
knn_weighted(data, labels, k, x) =>
n1 = data.size()
distances = array.new_float(n1)
indices = array.new_int(n1)
// Compute distances from the current point to all other points
for i = 0 to n1 – 1
x_i = data.get(i)
dist = distance(x, x_i)
distances.set(i, dist)
indices.set(i, i)
// Sort distances and corresponding indices in ascending order
// Bubble sort method
for i = 0 to n1 – 2
for j = 0 to n1 – i – 2
if distances.get(j) > distances.get(j + 1)
tempDist = distances.get(j)
distances.set(j, distances.get(j + 1))
distances.set(j + 1, tempDist)
tempIndex = indices.get(j)
indices.set(j, indices.get(j + 1))
indices.set(j + 1, tempIndex)
// Compute weighted sum of labels of the k nearest neighbors
weighted_sum = 0.
total_weight = 0.
for i = 0 to k – 1
index = indices.get(i)
label_i = labels.get(index)
weight_i = 1 / (distances.get(i) + 1e-6)
weighted_sum += weight_i * label_i
total_weight += weight_i
weighted_sum / total_weight
//~~~~~~~~~~~~~~~~~~~~~~~~~~~~~~~~~~~~~~~~~~~~~~~~~~~~~~~~~~~~~~~~~~~~~~~~~~~~~~~~~~~~~~~~~~~~~~~~~~~~~~~~~~~~~~~~~~~~~}
// ~~ Classify the current data point
current_superTrend = superTrend
label_ = knn_weighted(data, labels, k, current_superTrend)
//~~~~~~~~~~~~~~~~~~~~~~~~~~~~~~~~~~~~~~~~~~~~~~~~~~~~~~~~~~~~~~~~~~~~~~~~~~~~~~~~~~~~~~~~~~~~~~~~~~~~~~~~~~~~~~~~~~~~~}
// ~~ Plot
col = label_ == 1?upCol:label_ == 0?dnCol:neCol
plot(current_superTrend, color=col, title=”Volume Super Trend AI”)
upTrend = plot(superTrend==lowerBand?current_superTrend:na, title=”Up Volume Super Trend AI”, color=col, style=plot.style_linebr)
Middle = plot((open + close) / 2, display=display.none, editable=false)
downTrend = plot(superTrend==upperBand?current_superTrend:na, title=”Down Volume Super Trend AI”, color=col, style=plot.style_linebr)
fill_col = color.new(col,90)
fill(Middle, upTrend, fill_col, fillgaps=false,title=”Up Volume Super Trend AI”)
fill(Middle, downTrend, fill_col, fillgaps=false, title=”Down Volume Super Trend AI”)
//~~~~~~~~~~~~~~~~~~~~~~~~~~~~~~~~~~~~~~~~~~~~~~~~~~~~~~~~~~~~~~~~~~~~~~~~~~~~~~~~~~~~~~~~~~~~~~~~~~~~~~~~~~~~~~~~~~~~~}
// ~~ Ai Super Trend Signals
Start_TrendUp = col==upCol and (col[1]!=upCol or col[1]==neCol) and aisignals
Start_TrendDn = col==dnCol and (col[1]!=dnCol or col[1]==neCol) and aisignals
TrendUp = direction == -1 and direction[1] == 1 and label_ == 1 and aisignals
TrendDn = direction == 1 and direction[1] ==-1 and label_ == 0 and aisignals
plotshape(Start_TrendUp?superTrend:na, location=location.absolute, style= shape.circle, size=size.tiny, color=Bullish_col, title=”AI Bullish Trend Start”)
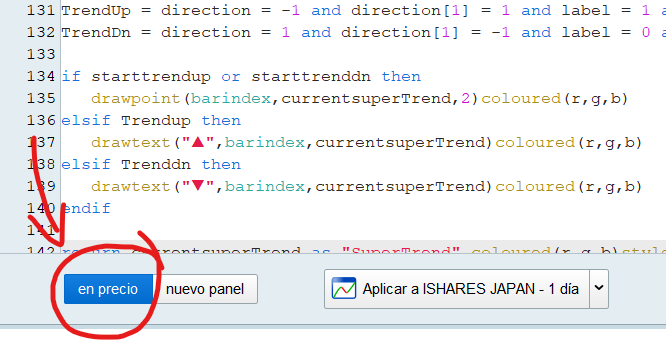
plotshape(Start_TrendDn?superTrend:na, location=location.absolute, style= shape.circle,size=size.tiny, color=Bearish_col, title=”AI Bearish Trend Start”)
plotshape(TrendUp?superTrend:na, location=location.absolute, style= shape.triangleup, size=size.small, color=Bullish_col, title=”AI Bullish Trend Signal”)
plotshape(TrendDn?superTrend:na, location=location.absolute, style= shape.triangledown,size=size.small, color=Bearish_col, title=”AI Bearish Trend Signal”)
//~~~~~~~~~~~~~~~~~~~~~~~~~~~~~~~~~~~~~~~~~~~~~~~~~~~~~~~~~~~~~~~~~~~~~~~~~~~~~~~~~~~~~~~~~~~~~~~~~~~~~~~~~~~~~~~~~~~~~}
// ~~ Alerts {
alertcondition(Start_TrendUp, title =”1 Bullish Trend Start”, message = “AI Bullish Trend Start”)
alertcondition(Start_TrendDn, title =”2 Bearish Trend Start”, message = “AI Bearish Trend Start”)
alertcondition((Start_TrendUp or Start_TrendDn), title =”3 Any Trend Start”, message=”Any AI Trend Start”)
alertcondition(TrendUp, title = “4 Bullish Trend Signal”, message = “AI Bullish Trend Signal”)
alertcondition(TrendDn, title = “5 Bearish Trend Signal”, message = “AI Bearish Trend Signal”)
alertcondition((TrendUp or TrendDn),title = “6 Any Trend Signal”, message =”Any AI Trend Signal”)
//~~~~~~~~~~~~~~~~~~~~~~~~~~~~~~~~~~~~~~~~~~~~~~~~~~~~~~~~~~~~~~~~~~~~~~~~~~~~~~~~~~~~~~~~~~~~~~~~~~~~~~~~~~~~~~~~~~~~~}