Hi all, I am fairly new to the forum. I posted this request as reply to another post but probably the wrong place.
Do you know if there is a way in PRC of reading/counting intraday ticks? The best I could do is to build the below indicator to be applied to an (x)ticks chart. This way I can see when the number of ticks in a certain amount of time have exceeded a defined threshold (say 15 mins as in the code below). However this indicator lacks a fundamental information: direction. Any way that I can read Up and DOWN ticks from the “tick by tick” list?
Ezio
tick = 0
if (time - time[1]) <= 1500 then
TICK = 1
endif
return TICK
You can store the Close value each tick received in a variable and test if the current one is above or below the last stored one. Then you could count positive and negative variation.
Thanks Nicolas for the fast reply. How do I do that? Only thing that comes to mind is to setup a 1-tick chart and do the count. Is there a more efficient way?
New Close[0] means new tick received in real time only.
Hi Nicolas,
Thanks for the advice. I have now incorporated that close[0] value in the code.
The problem I am facing is that I do not know how to store the close[0] value to be able to compare it with the the previous one. In the code below DELTA is measured between latest tick and previous bar close which is not what I am shooting for.
My final objective is to create an indicator that counts UP and DOWN ticks in a given amount of time (i.e. 5, 10, 15 minutes). Any other suggestions?
tickUP = 0
tickDOWN = 0

MyTick = Close[0]

Delta = close[0] - close[1]

if Delta > 0 then
tickUP = tickUP + 1
elsif Delta < 0 then
tickDOWN = tickDOWN - 1
endif

return Delta as "Delta", close[0] as "close[0]", close as "close", tickUP as "UP", tickDOWN as "DOWN", MyTick as "MyTick"
You can try it like this instead:
once tickUP = 0
once tickDOWN = 0
once lastsaved = close

Delta = close - lastsaved

if Delta > 0 and close<>lastsaved then
 tickUP = tickUP + 1
 lastsaved = close
elsif Delta < 0 and close<>lastsaved then
 tickDOWN = tickDOWN - 1
 lastsaved = close
endif

return tickUP as "UP", tickDOWN as "DOWN"
Market is close so I can’t test it. Next is to find a way to reset tickUP and tickDOWN on a time basis you have to define yourself .
 Paul
PaulParticipant
Master
this code is interesting and it perhaps could supplement a fast paced strategy if the reset is properly used
PaulParticipant
Master
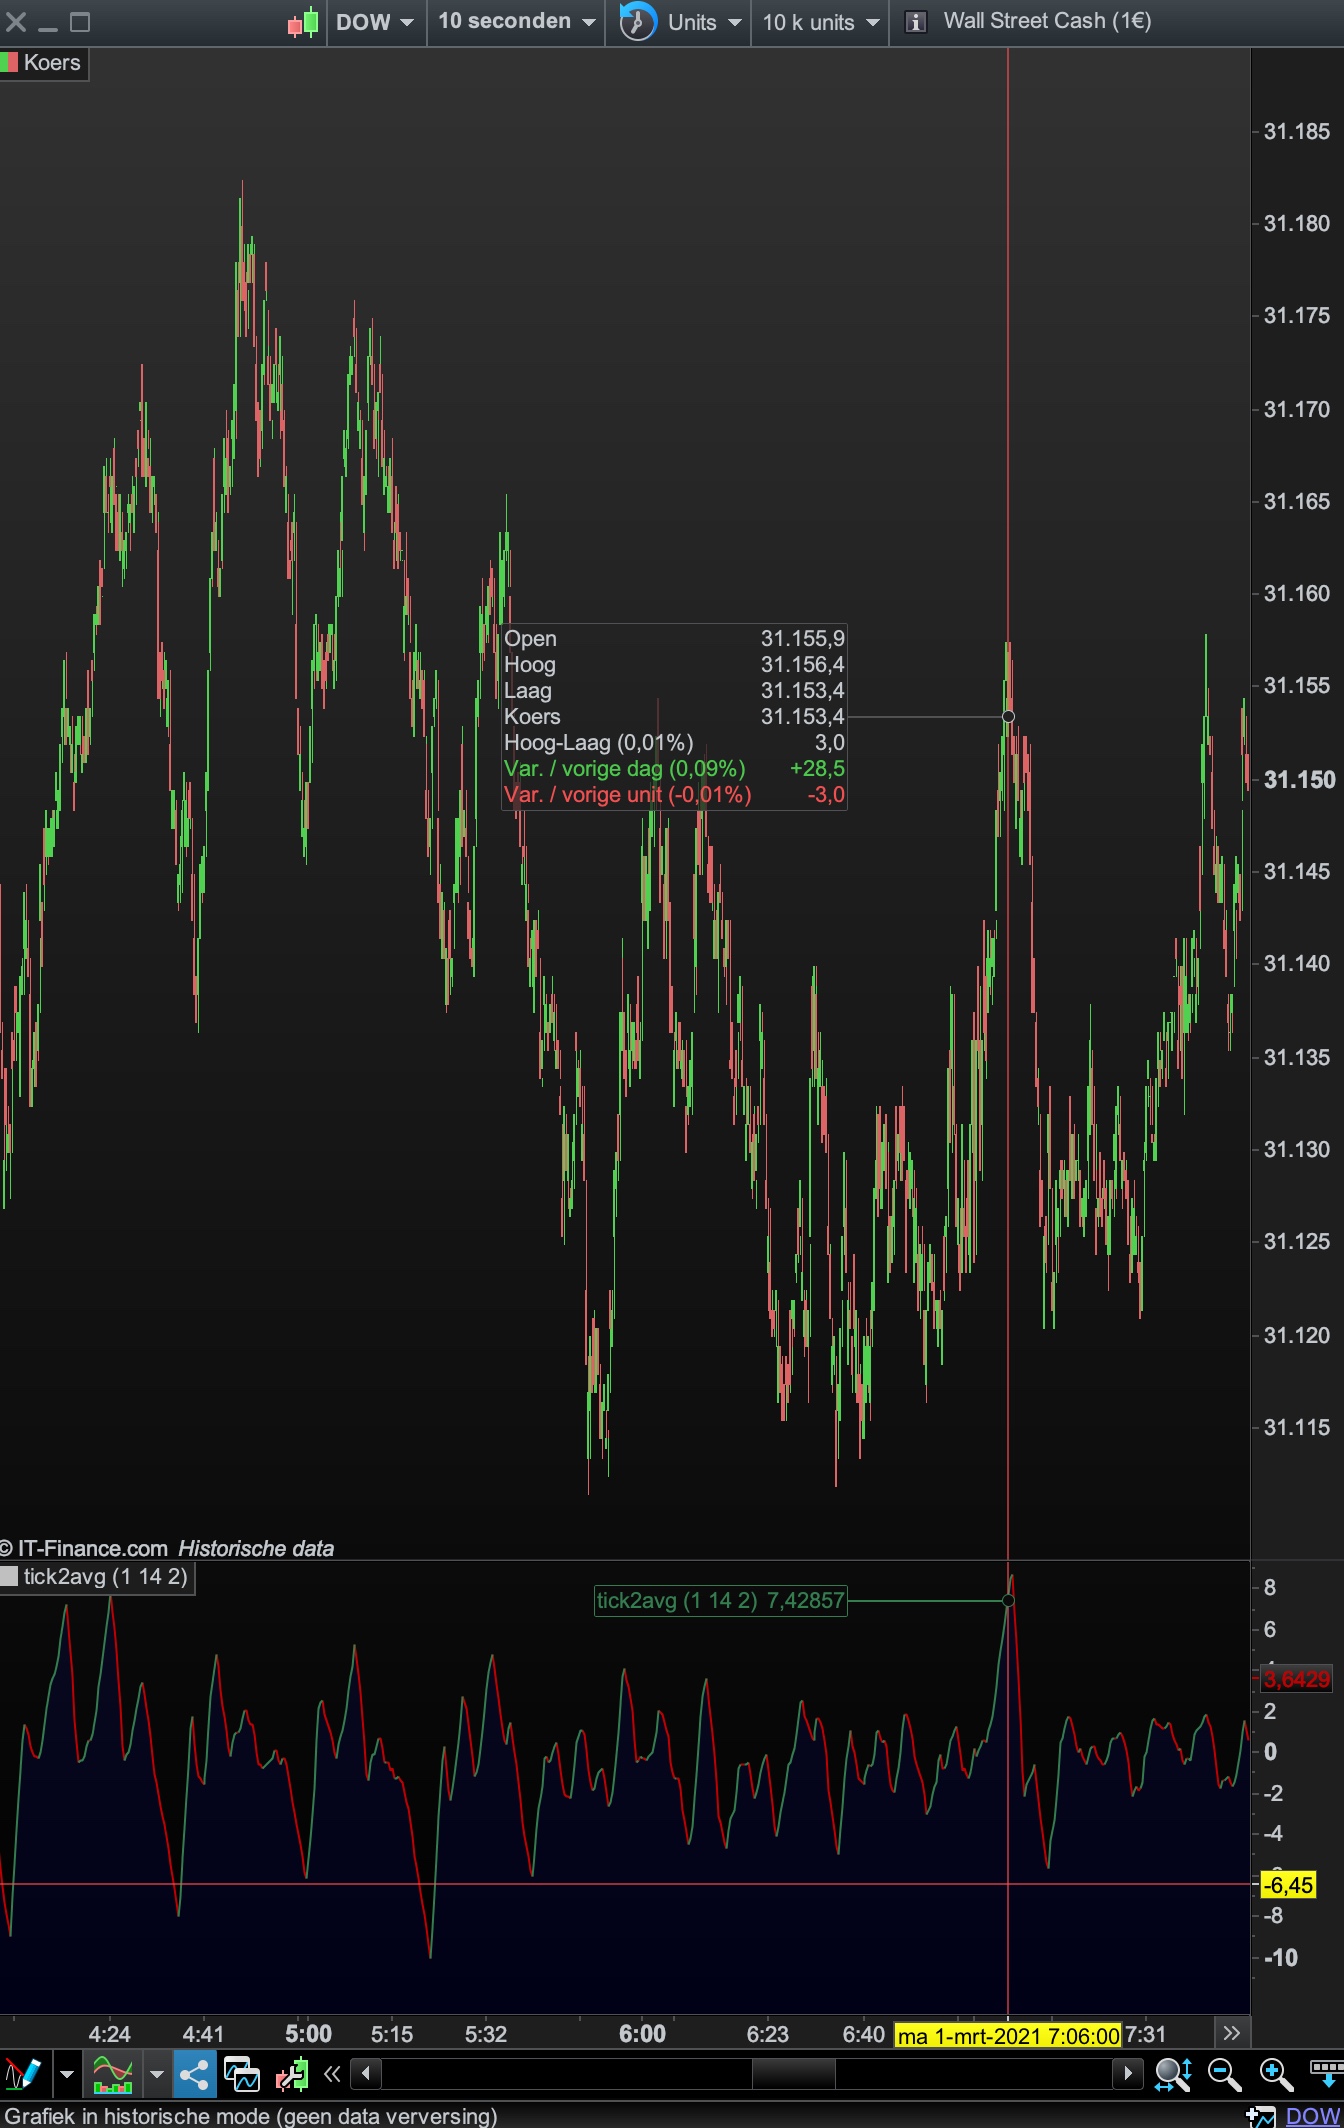
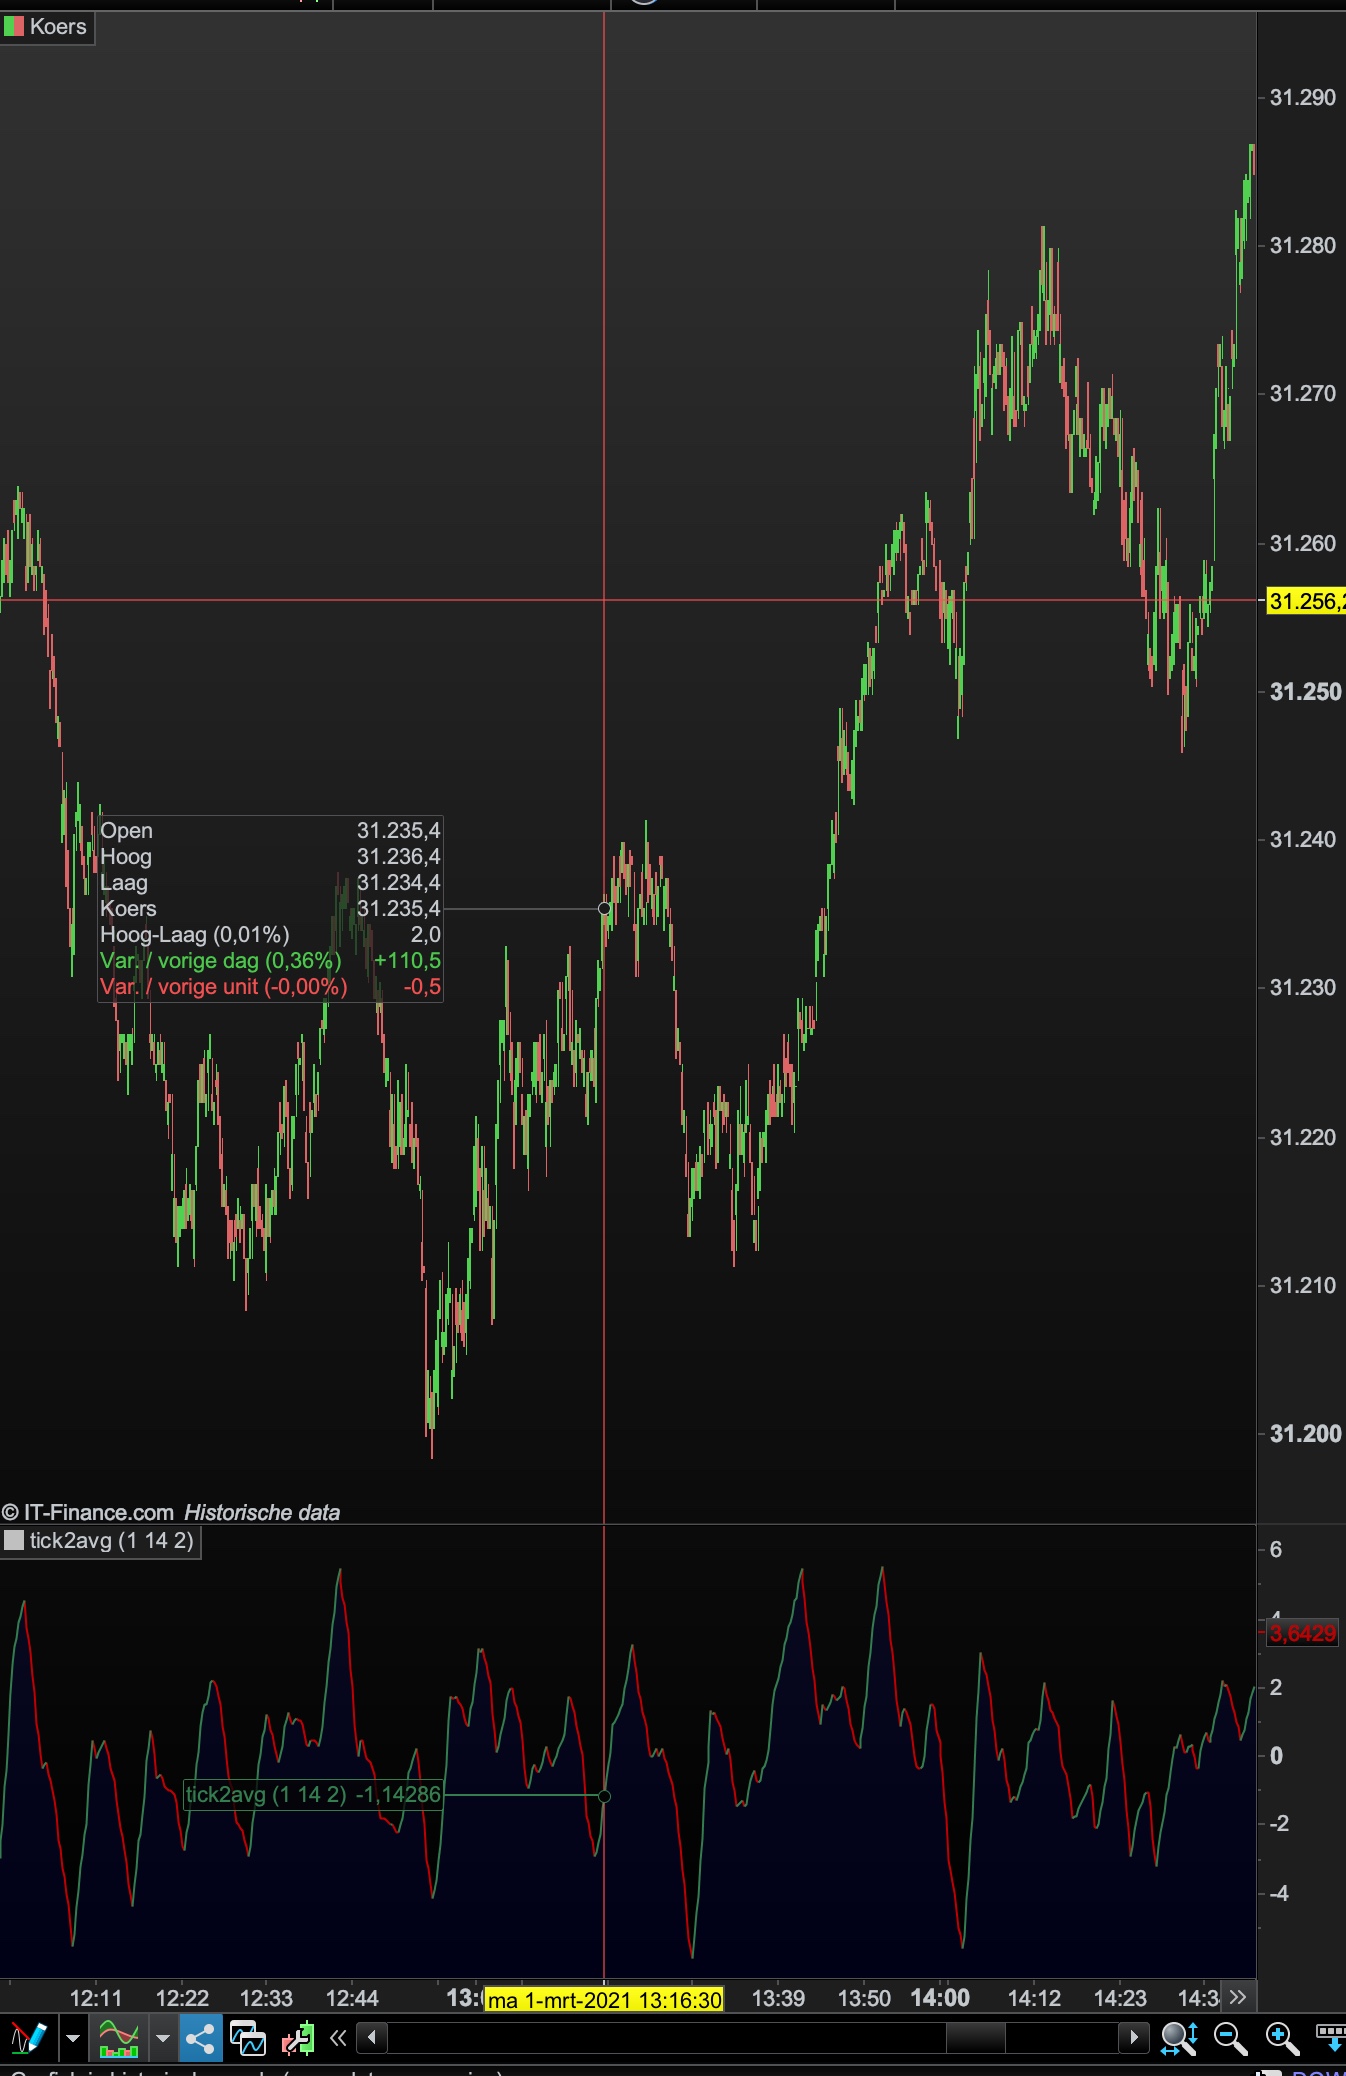
here are 2 examples of a reset based on priceaction.
Because it reset, the scale is limit from about -10 to +10 and especially the spikes are interesting points.
It’s tested on the dow 10s tf
PaulParticipant
Master
I have no experience in array’s, but the code doesn’t use array’s.
It’s based on your code from 2016, just added a reset to 0 when certain priceaction appears.
//Heikin Ashi candlestick definition according Investopedia, tested with the default values of Heiki Ashi bar values within PRT

once a1=2 //method //1-2
once a2=14 //period //2-5
once a3=2 //AVGtick

if barindex < 1 then
HOpen = open
HClose = close
HHigh = high
HLow = low
else
HOpen = 0.50 * (hOpen[1]+hClose[1])
HHigh = max(HOpen,max(high,Close))
HLow = min(HOpen,min(low,Close))
HClose = 0.25 * (Open+Close+Low+High)
endif

AvHA = average[a2]((HOpen+HHigh+HLow+Hclose)/4)

// conditions

once tickUP = 0
once tickDOWN = 0
once lastsaved = close

Delta = close - lastsaved

if method=1 then
if close>highest[a2](high)[1] then
tickdown=0
elsif close<lowest[a2](low)[1] then
tickup=0
endif
elsif method=2 then
if AvHA > AvHA[1] then
tickdown=0
elsif AvHA < AvHA[1] then
tickup=0
endif
endif

if Delta > 0 and close<>lastsaved then
tickUP = tickUP + 1
lastsaved = close
elsif Delta < 0 and close<>lastsaved then
tickDOWN = tickDOWN - 1
lastsaved = close
endif

tickavg=(tickup+tickdown)/2
tick2avg=average[a3](tickavg)

if tick2avg > tick2avg[1] then
r = 51 //51  128
g = 125 //125  128
b = 79 //79  128
else
r = 192 //192  48
g = 0 //0  84
b = 0 //0  150
endif

RETURN tick2avg coloured(r,g,b) style(line,1) as "tick2avg"