The guys at PRT have suggested I put my request in here ,as they are unable to help .
I would like to colour code the Volume by Price indicator similar to standard deviation distribution levels, and ideally make the colour bands customised eg 10% , 20% 30% …. etc …
Does anybody have the code for VBP indicator so this can be done … or know how it is calculated
Thanks
According to stockcharts.com , the Volume by price indicator is:
Volume-by-Price is an indicator that shows the amount of volume for a particular price range, which is based on closing prices. The Volume-by-Price bars are horizontal and shown on the left side of the chart to correspond with these price ranges. Chartists can view these bars as a single color or with two colors to separate up volume and down volume. By combining volume and closing prices, this indicator can be used to identify high-volume price ranges to mark support or resistance.
This indicator already exist built-in into prorealtime, but with a single color. So you want to be able to have the same indicator but with different colors according to the Volume color of each candlestick in their ranges? (if I understand correctly ..). Do you have some examples to show please?
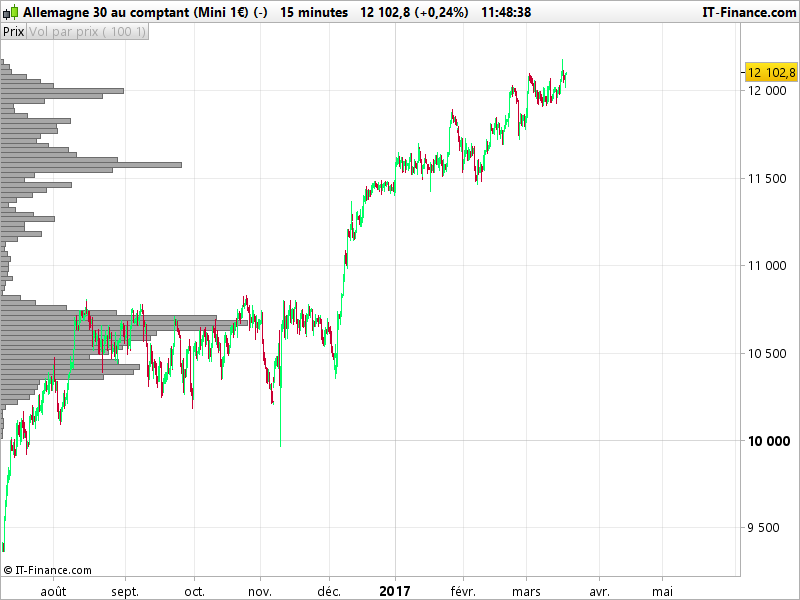
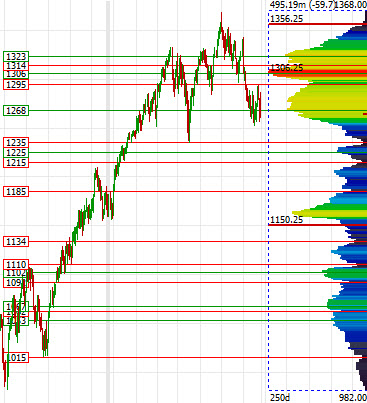
Hi Nicolas , thats correct attached is an example
Well, I put this request on hold, time for me to meditate about the correct way to code it. I must admit that I have doubt about the possibility to make it done. I see you also need dynamic coloring!
Because ProBuilder don’t have the capability to store variables in data arrays, this kind of indicator is definitely something very difficult to code.. Since we can’t dynamically create variables, we must know in advance how much boxes we’d like to be drawn on chart. It should also need nested loop I think .. and we may face the ‘infinite loop’ well known problem of the language.
Thanks Nicolas , I thought it wouldn’t be straight forward as I have been unable to find much about this indicator on the forums … I will continue to research this as well
I tried to code it this afternoon. Been on a good path to make something nice, but I get stuck with the infinite loop problem. I’ll have a deeper look next week to see if I can get through this problem by simplifying my code..
 odin
odinParticipant
Veteran
Does anyone have to code of the volume by Price indicator? In the built in Version i can not code something and modify or scan 🙁
is it possible to code the horizonatal volume bars in red and blue like this?
https://www.investopedia.com/articles/trading/06/pbvchart.asp
Sorry but this indicator is embedded in the platform and its code can’t be replicated with the ProBuilder language.
There are some indicators that “simulate” these kind of support / resistance :
Dynamic support and resistance intraday
other ones too.. but need to find their links! 😯
odinParticipant
Veteran
Hi Nicolas, can i use this on a Weekly Chart View?
My Dream is to use it:
n = 13 weeks (one quarter)
tolerance = 3 (the Magic 3 is needed for one fractal, so i wanna have a 3 for the tolerance value)
look back = 52 weeks (one happend in one trading/investing year)
is this possible for weekly Chart?
//PRC_Dynamic intraday SR | indicator
//23.08.2017
//Nicolas @ www.prorealcode.com
//Sharing ProRealTime knowledge

// --- settings
//n = 13 // highest and lowest period for support/resistance fetch
//tolerance = 3 // should be expressed in points) if there are two (or more) lines that are close to me, then you have to draw a center line
//lookback = 52 // period lookback to confirm support and resistance areas
//showSupport = 1//(0=false , 1=true)
//showResistance = 1 //(0=false , 1=true)
// --- end of settings
end second question?
is this possible to use it on Weekly Chart View, but use Daily Data, so one Tick = one Day, do have more data points
and exacter results?
//PRC_Dynamic intraday SR | indicator
//23.08.2017
//Nicolas @ www.prorealcode.com
//Sharing ProRealTime knowledge

// --- settings
//n =55 // highest and lowest period for support/resistance fetch
//tolerance = 15 // should be expressed in points) if there are two (or more) lines that are close to me, then you have to draw a center line
//lookback = 260 // period lookback to confirm support and resistance areas
//showSupport = 1//(0=false , 1=true)
//showResistance = 1 //(0=false , 1=true)
// --- end of settings
is that possible to use daily data for weekly Chart view?
thanks for answer, marcus