Bard
BardParticipant
Master
So I think I have figured out the BCI.
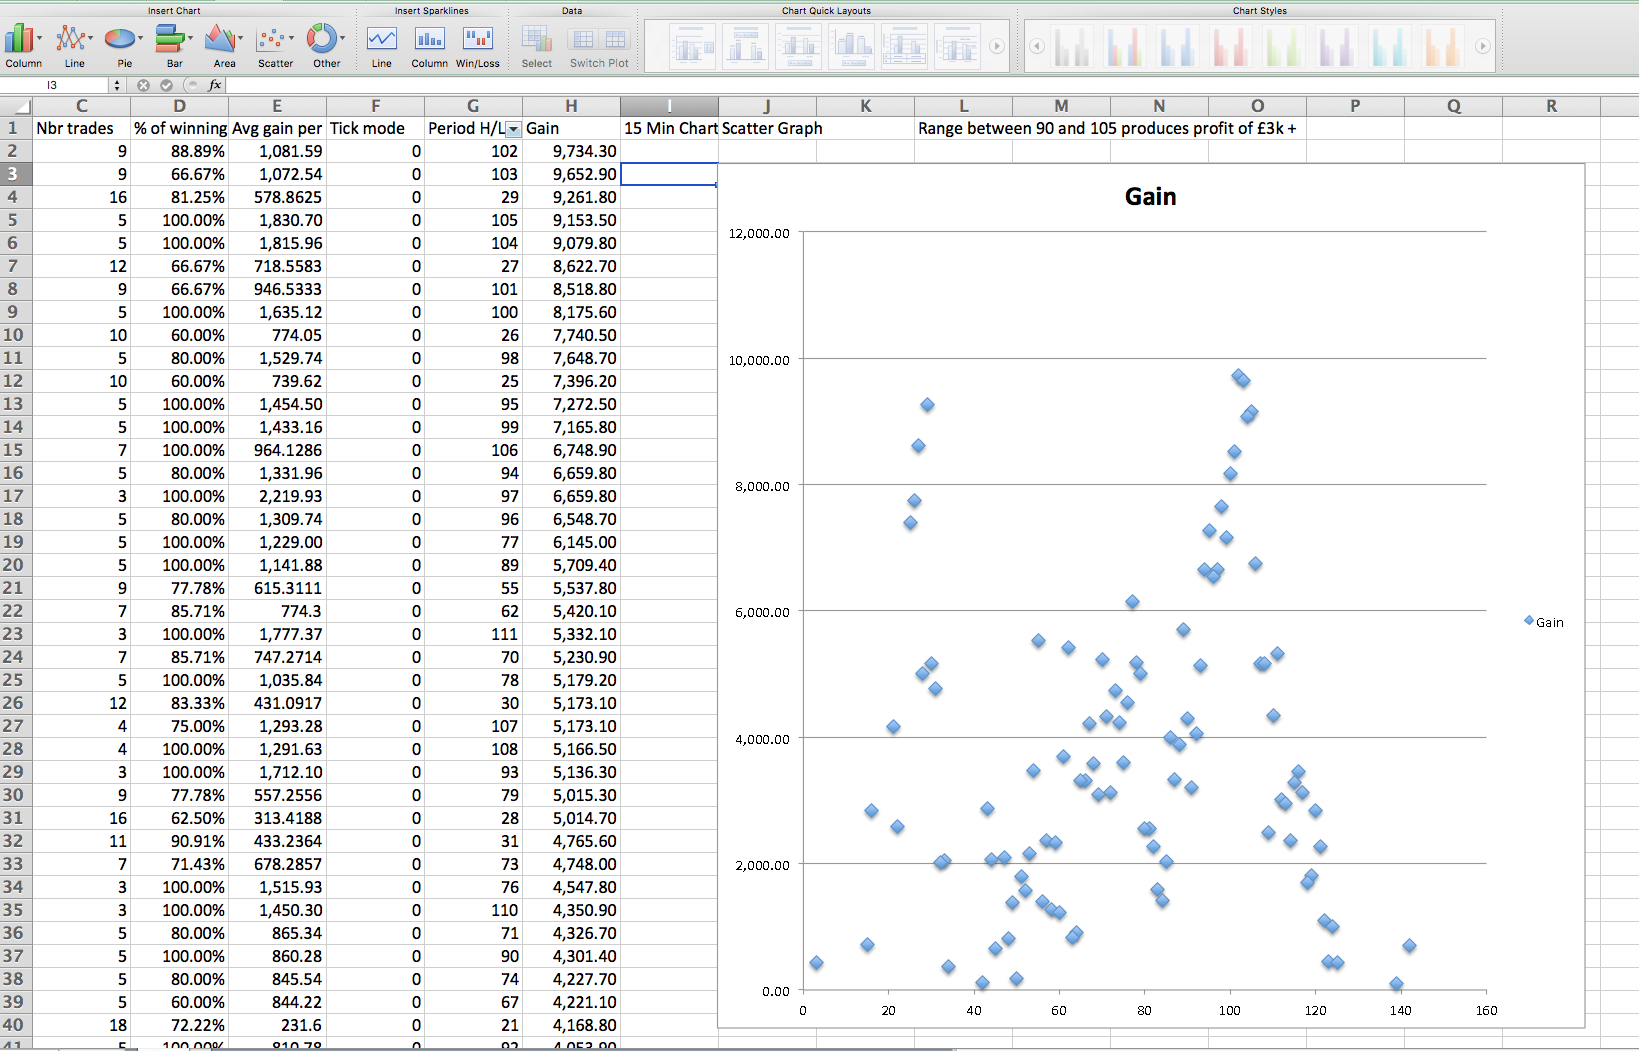
Using excel scatter graphs helped the above excel plotting issue by being able to find an optimised and stable range of look back period valuations for the SQR High / Low period BCI calculation.
Charting x versus y values caused ongoing problems when using the copy/clip sheet because I think it’s bringing that over in a text format and not numerical – which is why the x axis has been plotting the point cell row values and not the number of days for the optimised period for the high / low value. A range of 90 to 105 days can be seen to produce high profit values over £2,000 and up to the max amount in the graph attached.
Good profits and low drawdowns were achieved on a number of currency pairs listed below, once optimisation had been done on one currency pair and tests then used the same optimised period (100 days) for the high, low value:
It works well on mean reverting currencies: £/$, $/Y, £/€, £/Y, and surprisingly, on the FTSE, EU Stocks, the S&P 500, NASDAQ (just) and Nikkei’s for the 30 min charts. It also appears to work on 15 min charts. Most of the results are based on a very low sample number of trades because there’s not enough backtest data with only a years worth available. More data would definitely establish if there is any robustness in the strategy.
Thanks Bard for enlighten us about a nice way to analyse results of optimized strategies results in an Excel chart! What is the code you used to achieve those optimisations?
What this scatter graph tell us, is that the most used periods (around 20 and 100) seems to work well on this “simple” mean reversion strategy.
BardParticipant
Master
Hi Nicolas, I’ve spent the last few days attempting to reply here but then found new things to test first thanks to @Petrus adding the time frames to your code so you can test low volatility times (evenings / nights).
The time of day traded can make a positive change to the profit and/or drawdown figures by not trading 24.00hrs a day but in times when there is less volatility in the market, i.e. avoiding the open by testing
11am – 9pm or 3pm to 9am or 8pm – midnight (same profit half the drawdown e.g. FTSE and Dow).
I’m doing more research night trading as there is an edge for indices, see the work of: https://nightlypatterns.wordpress.com
A quick question, is there a way to test/optimise times of day to trade?
That it works on non mean reverting indexes gives the concept more robustness. It has good results with currencies like the £/Y.
The code is below. The spread was set at 3.8. It was optimised on the Italy 40 MIB Index 30 min bars and the Optimal period was 5. Currencies tend to work around Period = 100, those optimisations are more robust when far more green results to red appear when the period was optimised from 0 to 200 in steps of 5’s. This value (Period =5) was then tested on the: DAX, FTSE, CAC 40, S&P 500, N225’s EU Stocks and the Nasdaq with reasonable results on 7 out of 9 instruments.
DEFPARAM CumulateOrders = False

DEFPARAM Preloadbars = 2000

REM BCI MEAN REVERSION
BCI= SQRT(dhigh(5)*dlow(5))

if intradaybarindex=0 then
indi=bci
endif

//LONG

IF Time=110000 AND dopen(0)<indi THEN
BUY 10 CONTRACT AT MARKET
ENDIF

IF Time=210000 THEN
SELL  AT MARKET
ENDIF

//SHORT

IF Time=110000 AND dopen(0)>indi THEN
SELLSHORT AT MARKET
ENDIF

IF Time=210000 THEN
SELL  AT MARKET
ENDIF

//graph indi
I have got this warning a couple of times after launching the systems so I added the preloadbars code (see below), but on 15 min bars using a Period of 120 it says there is not enough available data but there should be? :
“This trading system was stopped because the historical data loaded was insufficient to calculate at least one indicator during the evaluation of the last candlestick. Please increase the number of preloaded bars with the instruction DEFPARAM in the code of your strategy (ex: DEFPARAM Preloadbars = 2000). For additional assistance, please refer to the help text of the DEFPARAM function in the trading systems programming manual.”
Cheers
Bard
Thanks Bard, but there might be a problem in your tests. At line 29 you are trying to exit a long position with the SELL keyword, while you should have used EXITSHORT instead, if I correctly understood your code. I didn’t test myself, but I think it would change a lot the results you are talking about.
BardParticipant
Master
Cheers Nicolas, I already spotted that over the weekend, but accidentally used the code from an older system above (one of about 5 BCI based systems).
I double checked on the DAX. £/Y and FTSE and the incorrect code only mades a few % points difference on the profit.
Using one optimised Period parameter for the high/low per instrument is typically how people optimise but I think optimising on one instrument and then “unleashing” it on other instruments is better. The Excel results give a good range of stable Periods to use.
All the systems have been stopped with that warning by PRT at some time or rather since launching them late last week. There looks to be enough price data to be able to set a Period to 100 (with e.g. 15 min bars) and then test?
BardParticipant
Master
p.s.
Is there a way to test/optimise time periods traded?
BardParticipant
Master
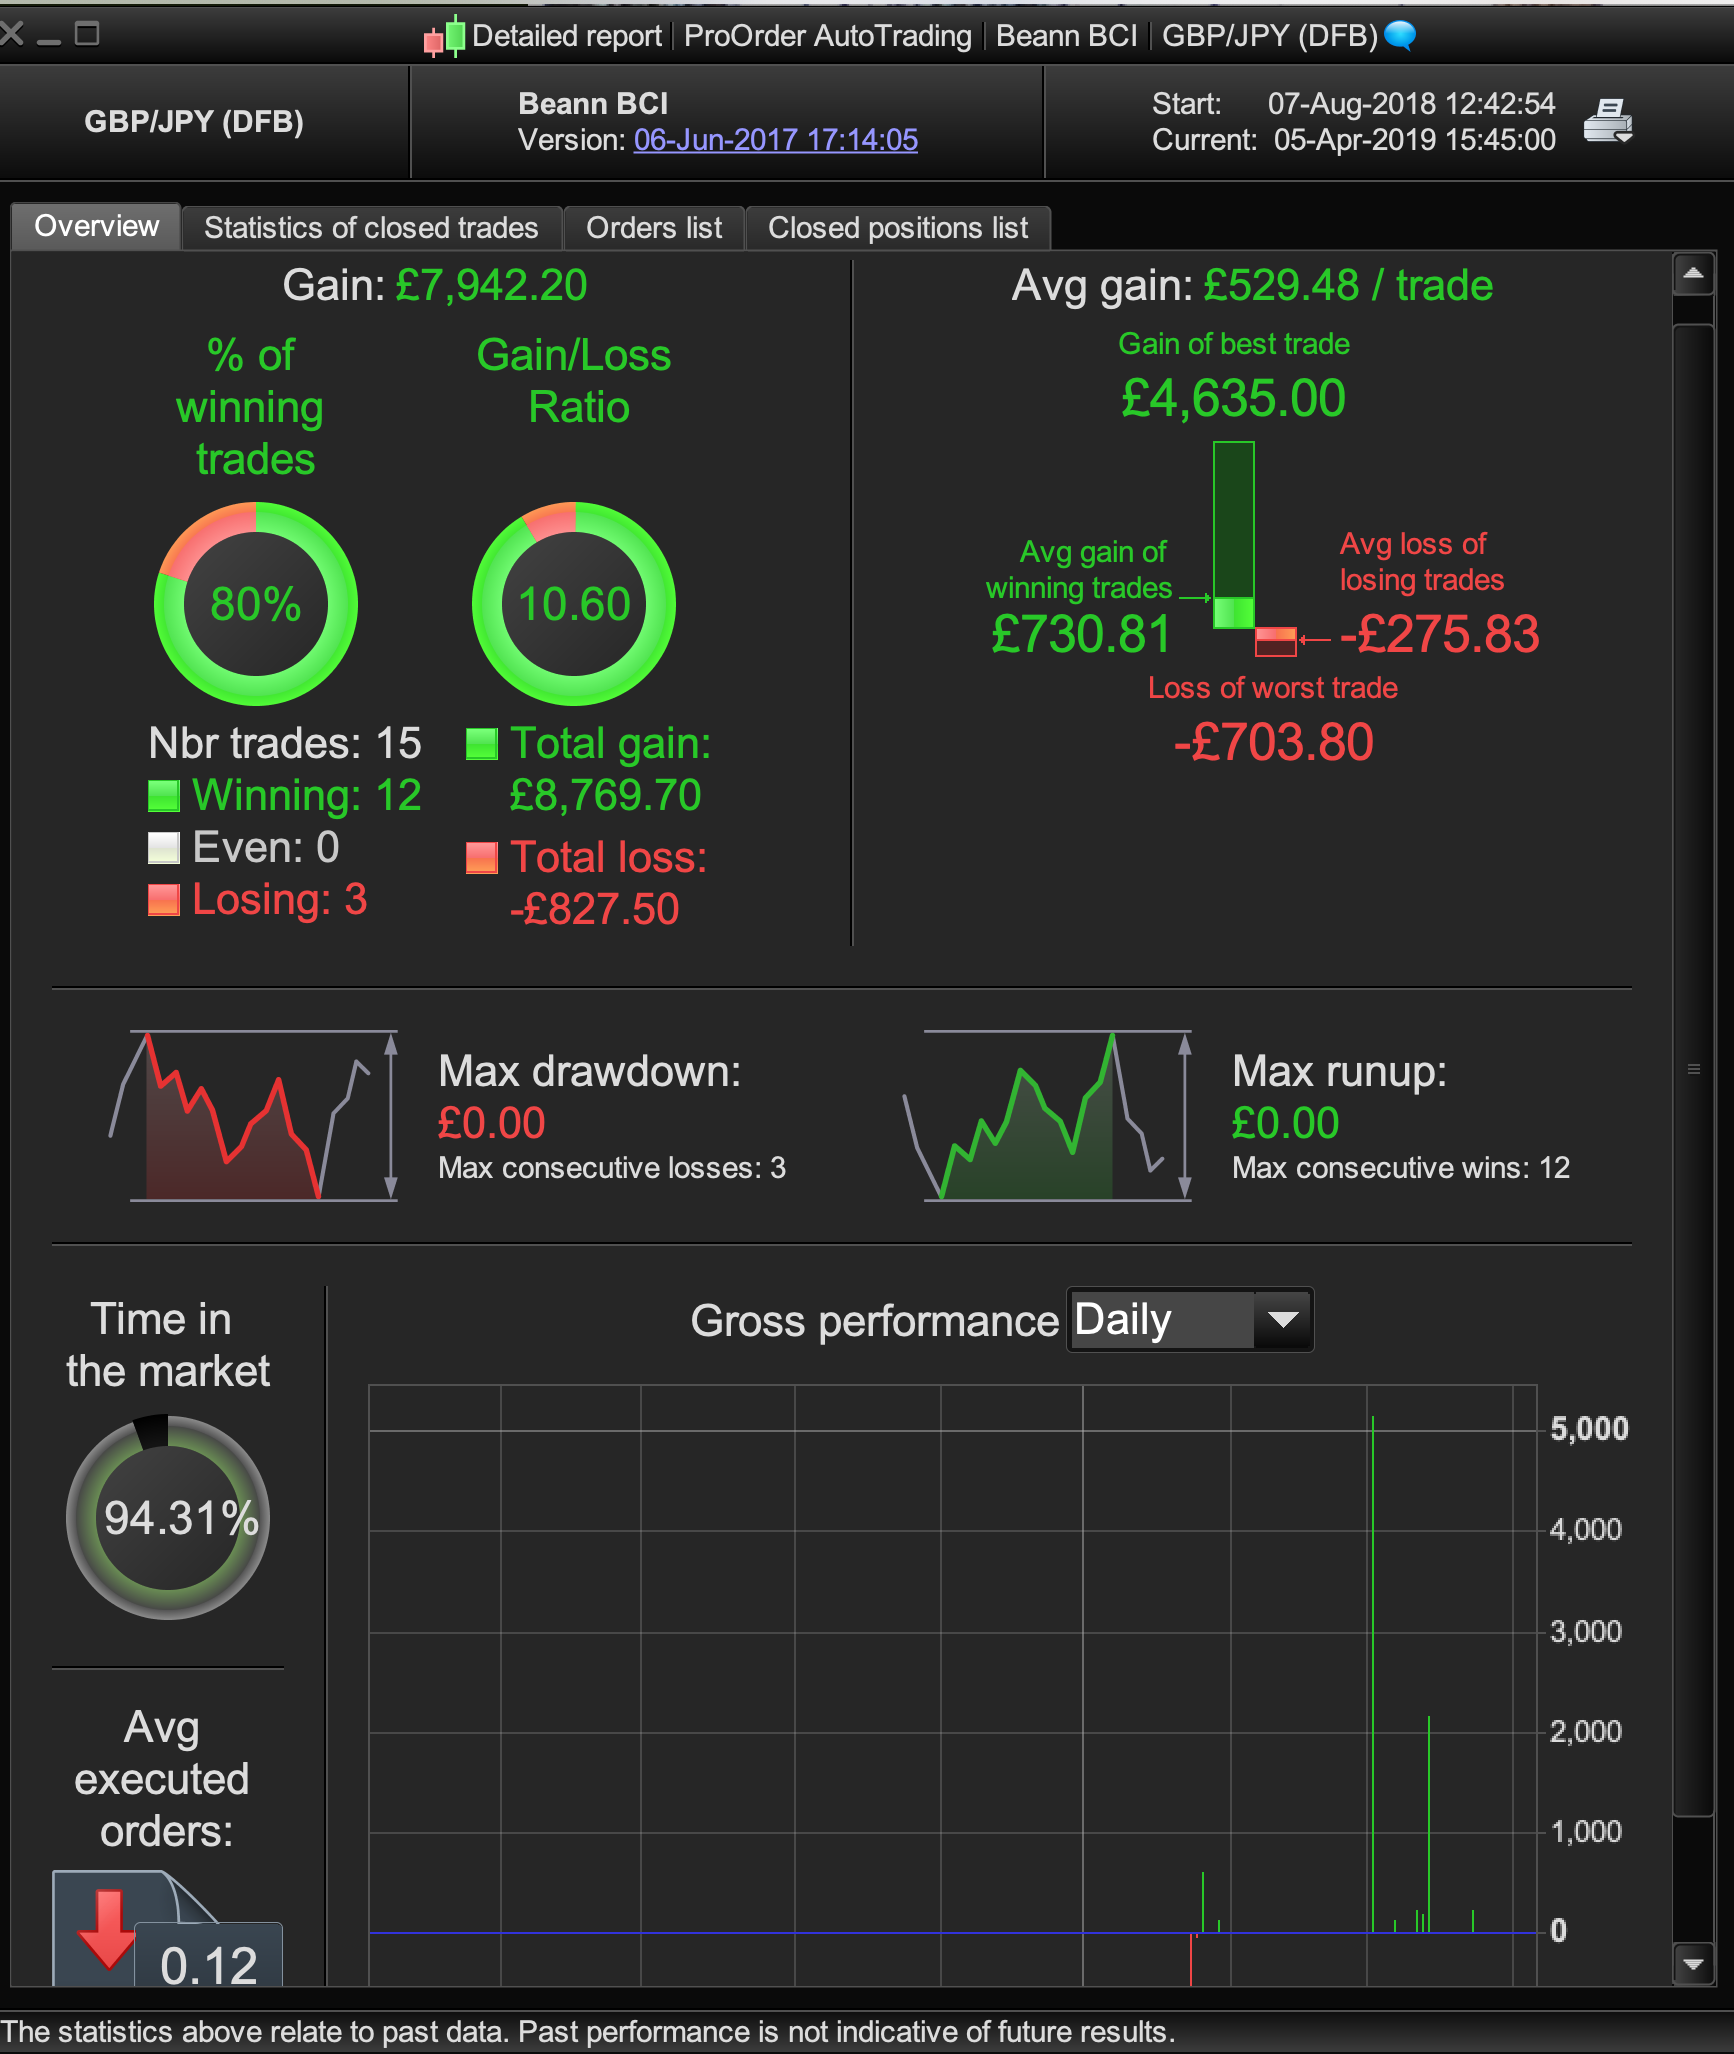
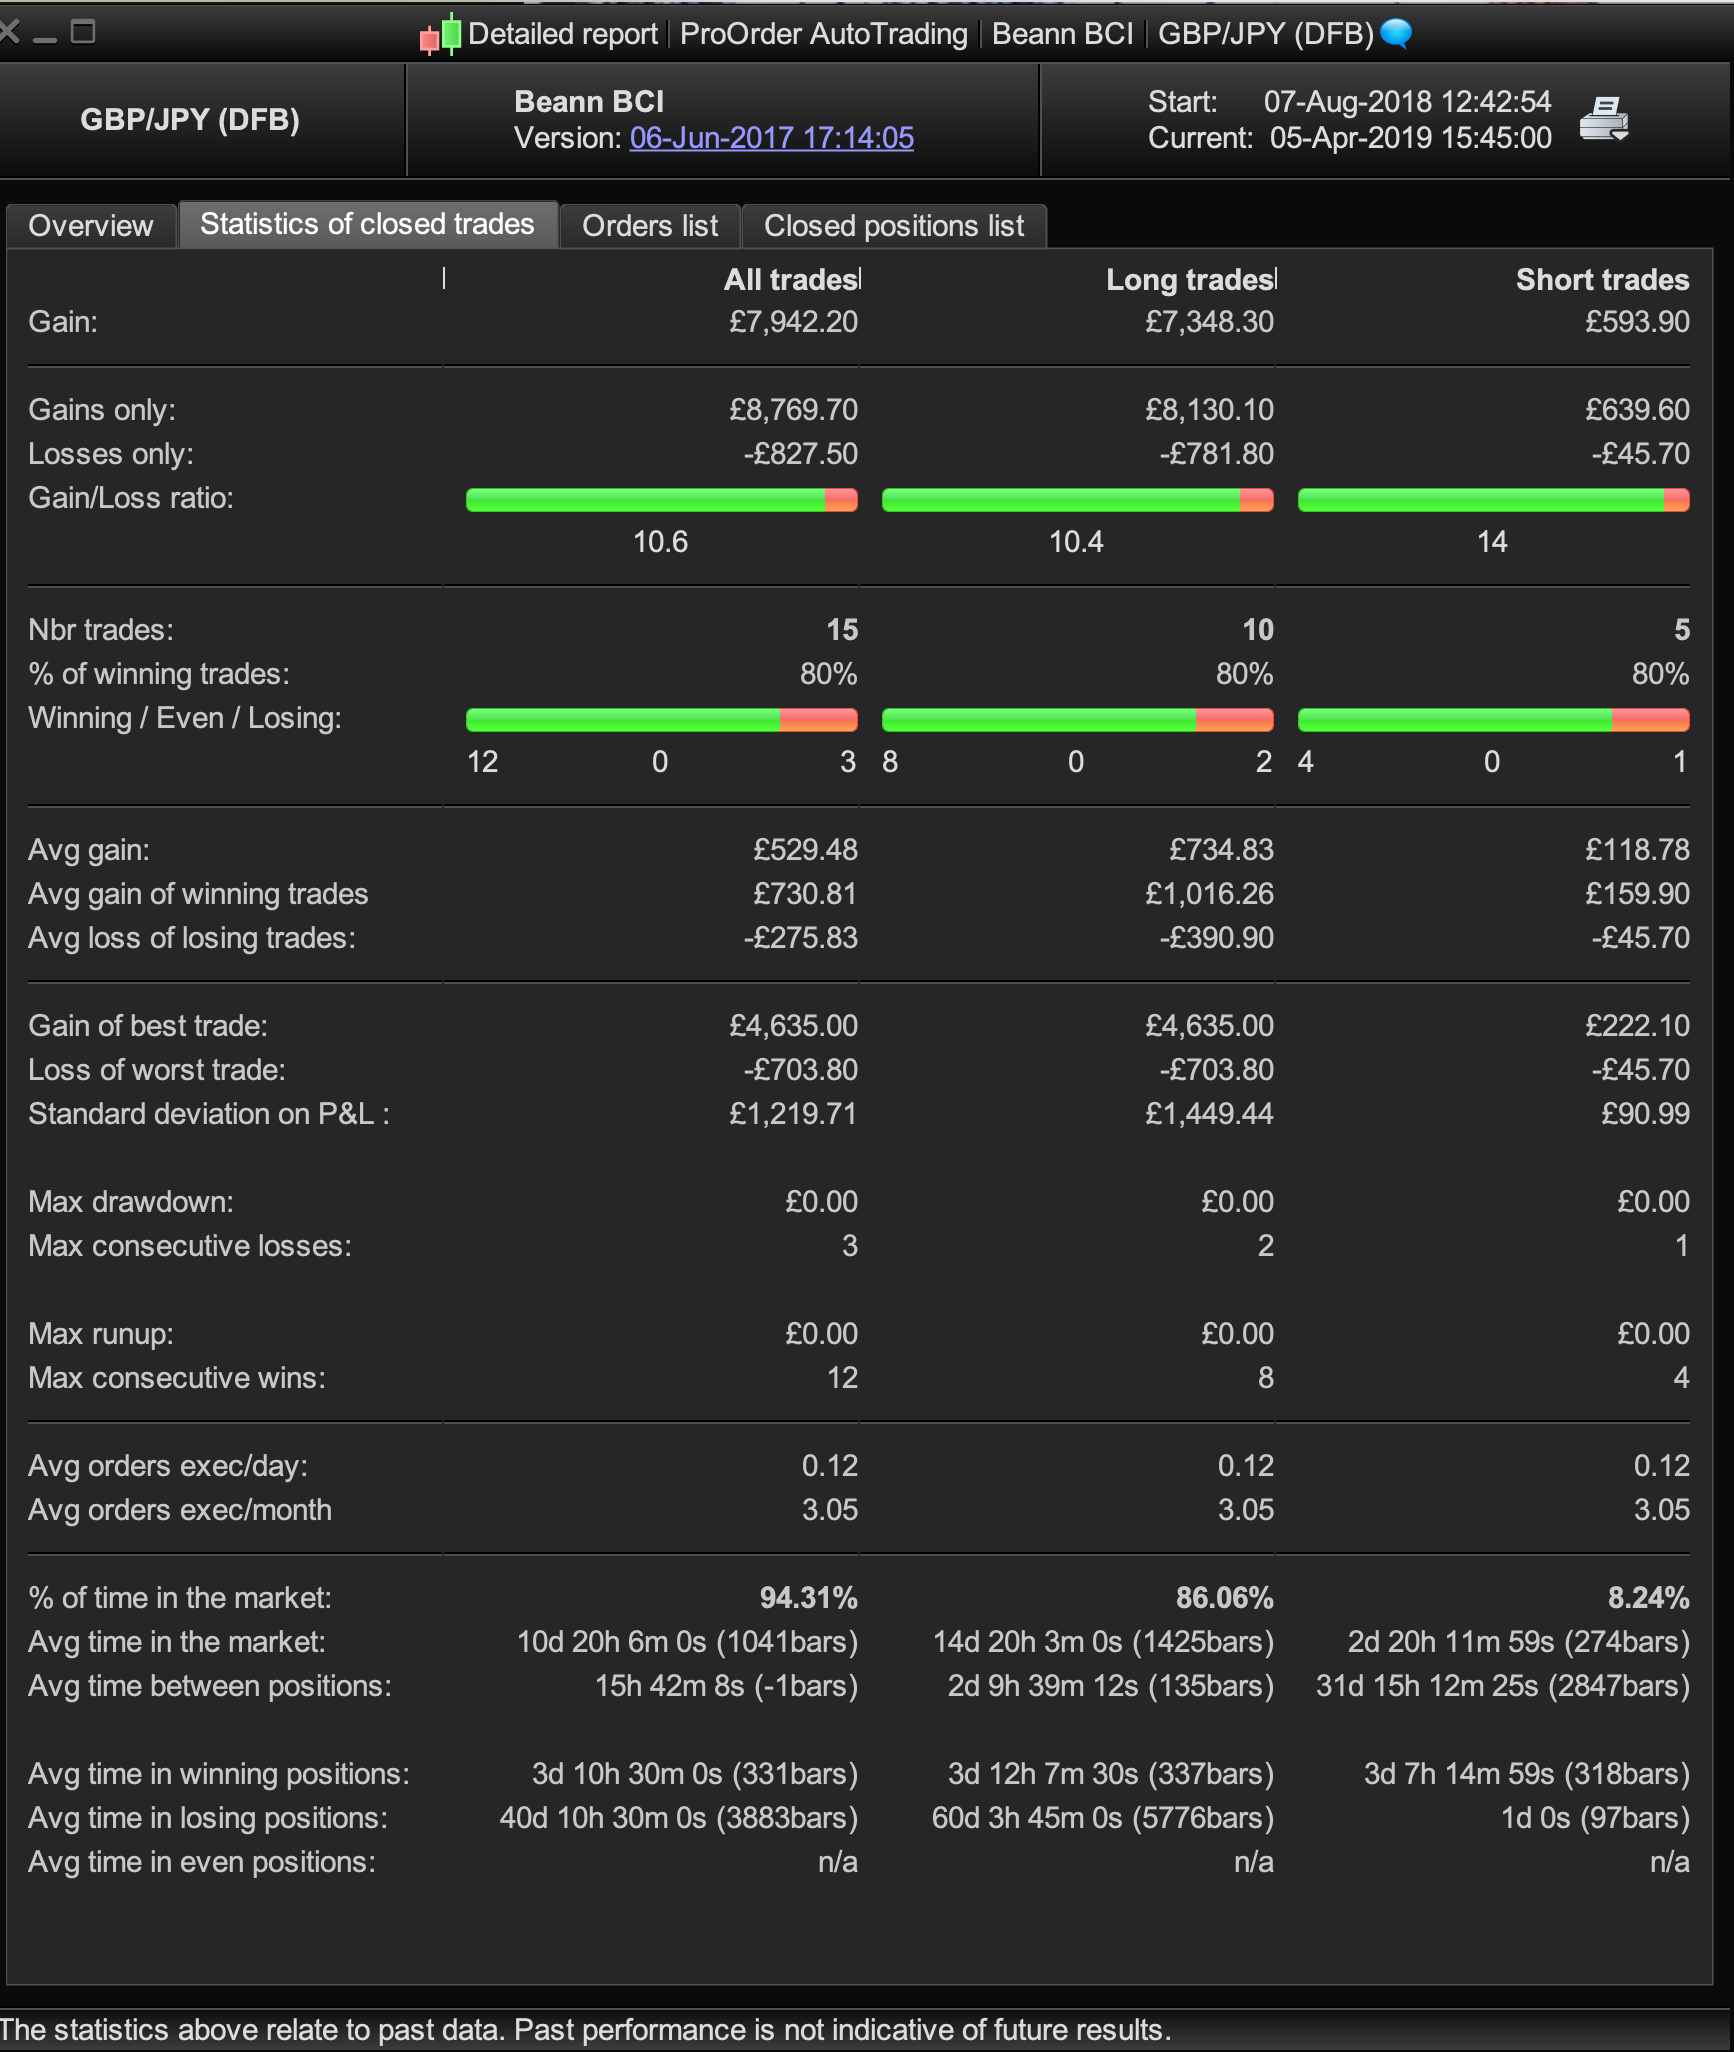
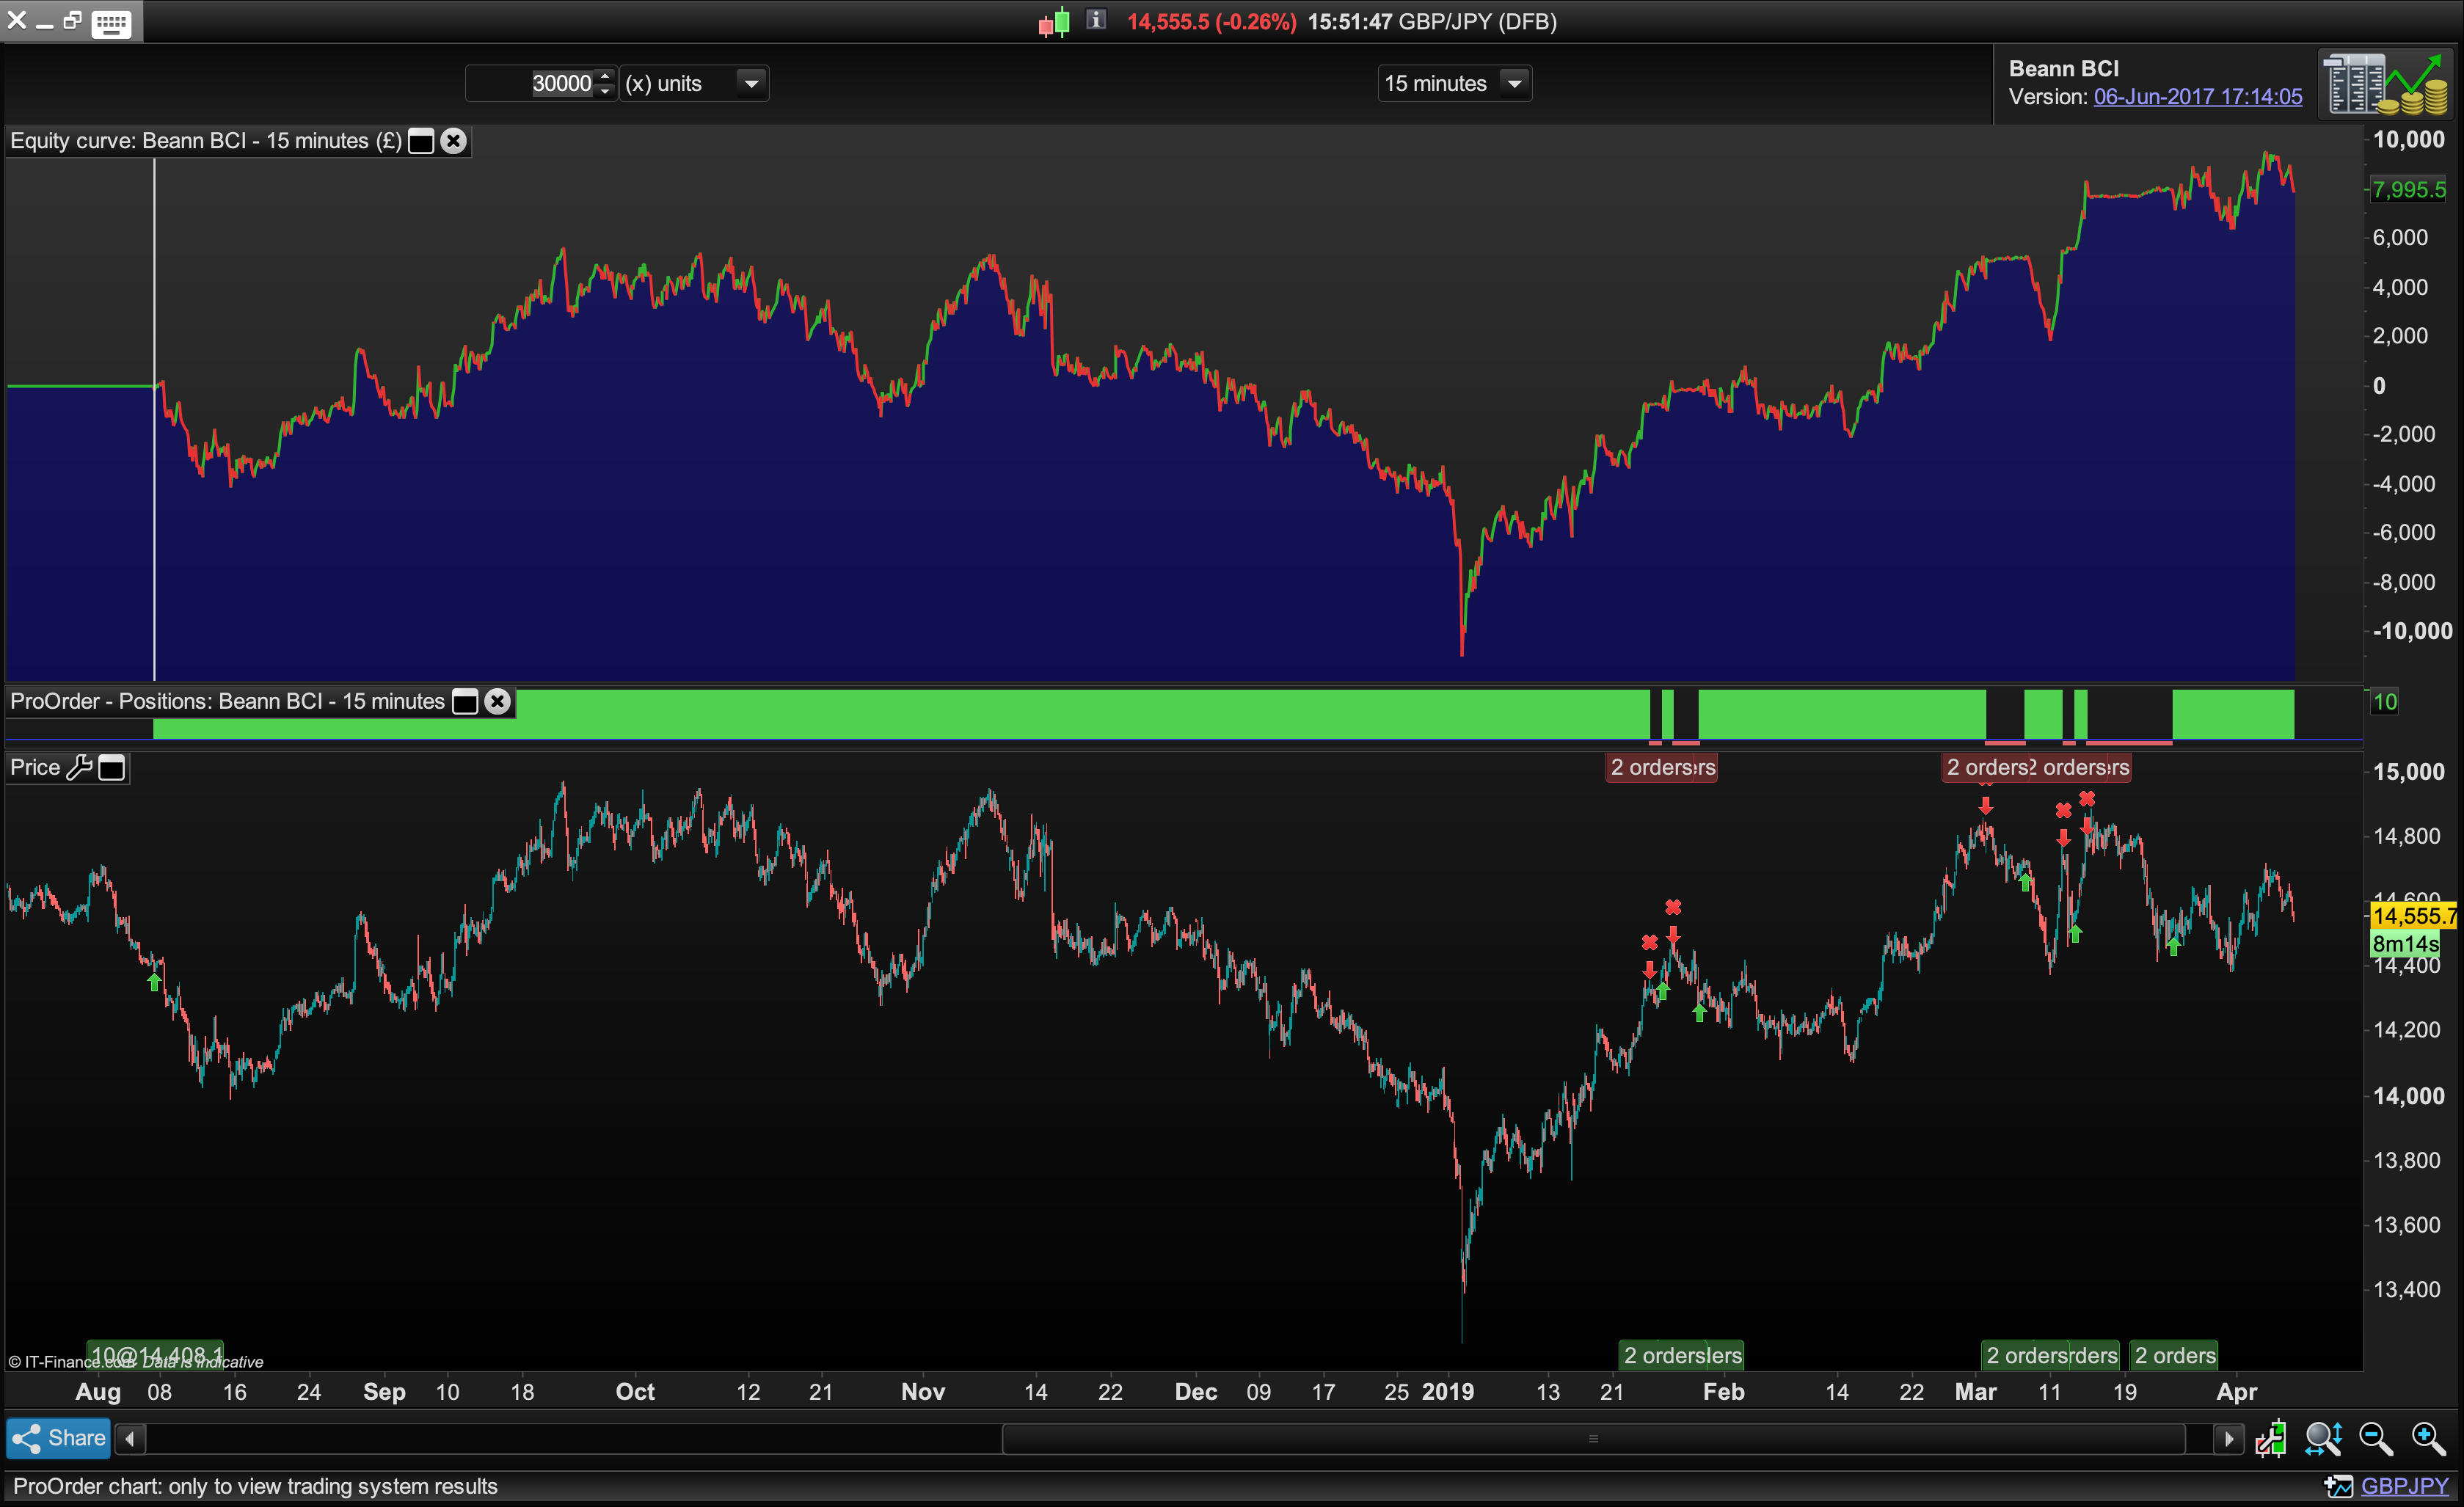
Results: Balanced Centre Line, £/Yen 15 Mins.
Considering the state of the markets this is surprising no, @zilliq, @nicolas? Still, given the trade number being too low it’s too soon to infer too much.
//-------------------------------------------------------------------------
// Main code : Beann BCI
//-------------------------------------------------------------------------
DEFPARAM CumulateOrders = False

REM BCI MEAN REVERSION
BCI= SQRT(dhigh(120)*dlow(120))

if intradaybarindex=0 then
indi=bci
endif

IF dopen(0)<indi THEN
BUY 10 CONTRACT AT MARKET
ENDIF

IF dopen(0)>indi THEN
SELLSHORT AT MARKET
ENDIF
What returns BCI calculation? You should start from there.
GRAPH BCI