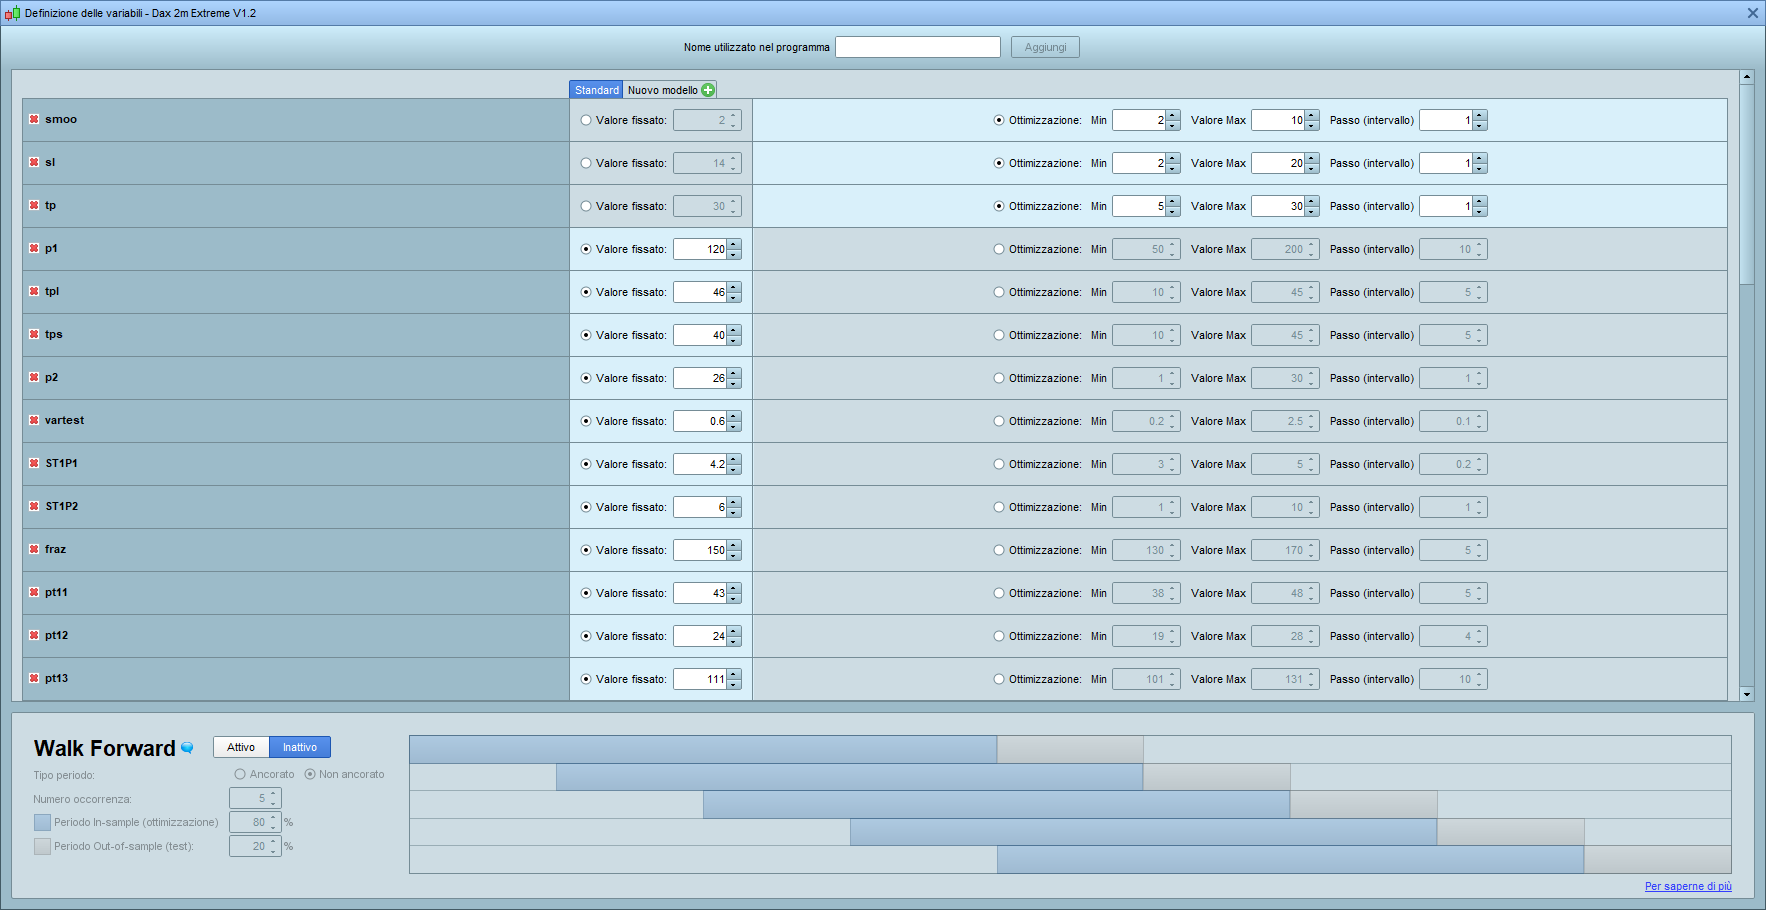
I’ve done a spot the difference check 5 times and all I can see is that in the 2nd screenshot the No. of Combinations is not shown because your have not sized the window big enough for the No of combos to be seen??
is not shown because your have not sized the window big enough for the No of combos to be seen
I’ve tried to enlarge the variable windows but doesn’t appear. Maybe I am missing a trick? Where is it???
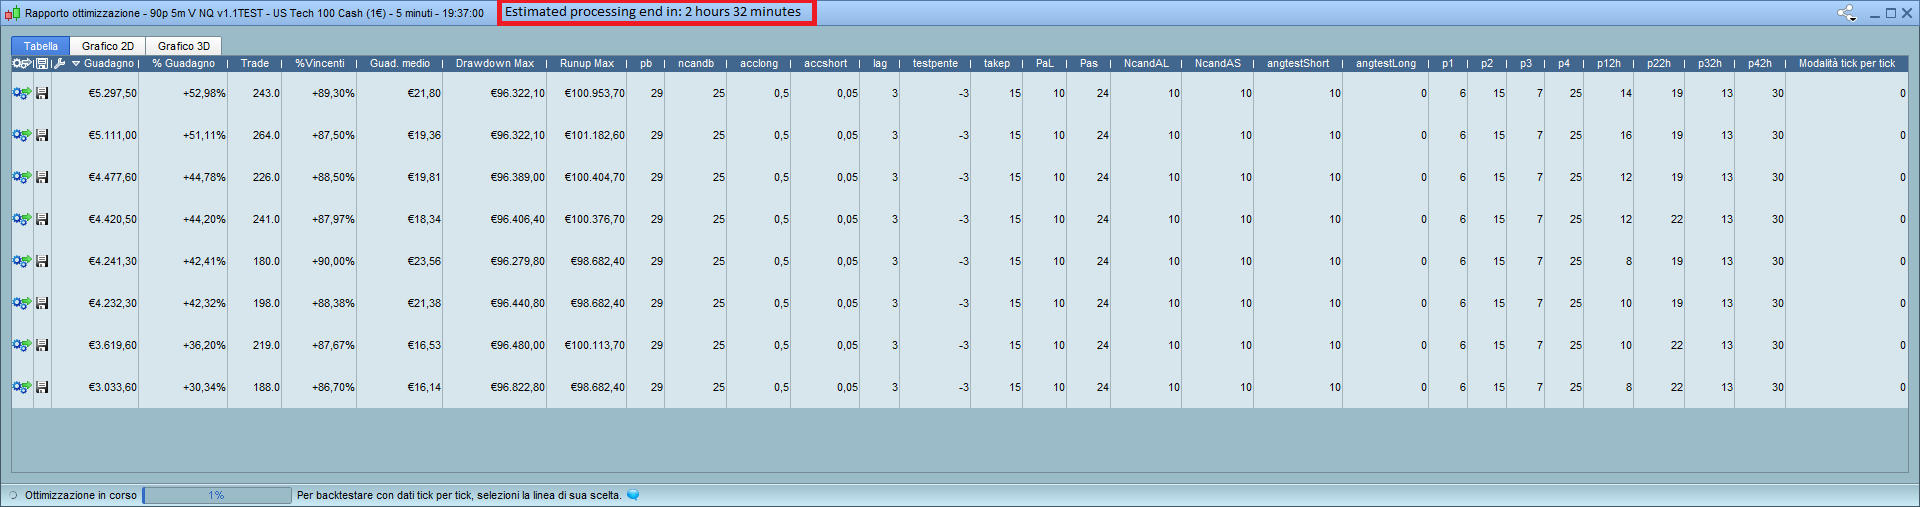
It could be useful to have a estimating time to finish the process of backtest
Too many factors affect optimisation for any general estimate of time to be given.
However, it would be good to have a –
benchmark standard Algo
with benchmark variables
and benchmark number of combinations
– that should complete a full optimisation in not greater than x minutes.
If somebody is keen enough to set up a Benchmark Algo and post the .itf then I – for one – would run it on my platform and report back how long it takes.
I think it’s quite easy to estimate time to process, except if there is at least one optimized unused variable in the backtest, then the estimate could be very wrong.
But it is useful to know how long it will take to leave the PC in processing and return at the presumed end time. Now I do a calculation in mind “… if 5% takes about 15 minutes, 100% takes 300 minutes…”
if 5% takes about 15 minutes, 100% takes 300 minutes…”
I find they get about 50% through and then slow down almost to a standstill.
except if there is at least one optimized unused variable in the backtest,
What is an optimized unused variable??
Why would we have a variable in the optimiser if we are not using it in the Algo / strategy??
Why would we have a variable in the optimiser if we are not using it in the Algo / strategy??
That’s a good question!! Sometimes, when I haven’t made coffee yet, happens that I put “a” variable on the optimization mask and on the code I left “a=10”. This is an example!
I left “a=10”. This is an example!
Hahah .. I’ve done similar … so you are not alone! 🙂
Please develop a way to use multiple ‘graphs’ so we can separate the code to debug easier.
E.g
graph c1

graph1 c2

graph1 c3
So that graph and graph1 are in separate boxes.
Sorry for the double post. One thing thats really bugging me is that boxes resize everytime we backtest.
Is there a way to make the equity curve box etc a fixed size?
I would like to bring something up, don’t see it mentioned here.
I have seen it mentioned on the forum however.
When you pull up a new chart your saved indicator(s)/indicator(s) settings will be automatically applied.
Let me illustrate with an example.
If I open let’s say EUR/USD 4 Hour time frame, and I have previously saved settings on it. For example let’s say that a 50SMA and a RSI 7 Periods have been saved on this specific timeframe/instrument it will be pulled up on this chart automatically when opened. If I then switch to 1 hour time frame it will display a bollinger band and a 9 period RSI, or whatever one fanciy Then if switched over to a gold chart on a daily time frame it will apply 200 SMA or whatever I have saved there.
If no settings are saved it will just load your default settings.
If no settings are saved it will just load your default settings.
When you save your preferred settings … which tab are you selecting …
- Timeframe only
2. Template only
3. All Templates
I suggest you try again and take note which Tab you have selected before you save.
Let us know how you get on please?
What?
Are you suggesting that this already exist?
I am requesting a automatic function for this.
So that my saved settings will appear automatically when i click the quote from a list.
So i don’t have to load the saved settings
If this exist please tell me under what section in the settings i can find it.
I’m not sure we are supposed to discuss misunderstandings etc on this particular Topic, but I guess we will be told? 🙂
Whatever instrument I open it opens in the same Chart / same settings / same Template as I am looking at on my screen.
So I don’t understand where you are opening (for example) gold from to get different settings? The only place we can save Indicators displayed and Timeframes displayed is Templates??
If you not want to answer that is fine, but a screen shot would help loads if you do want to explore further.
Maybe somebody else can instantly see what your problem is?