I read many interesting things in many different topics everyday on forums, I think this topic should be a better place to centralised everything.
This thread is open to everyone to post any requests about features or modifications of ProRealTime.
Please feel free to post everything you’d like to be part of future update of the platform, even if you have already read or suggest it in any other topics of forums.
This is my own list, I’ll try to complete it and summarize with other people queries as possible:
If you want to talk about one of the listed query, please precise its number in your post!
- backtests results in points, not in money
- complete printable backtests results in PDF or HTML format, and not only one page at once (would prevent people posting pictures of their screens to show how a strategy is performing!)
- new probuilder instruction to define if an indicator is applied to price chart or in a separate window
- new probuilder instruction to define min and max values of an oscillator to automatically adapt the scale of the indicator window
- ProScreener: EQUITYFRAME is not operating if the 2 equities are not in the same shares list
- ProOrder: take control manually of orders generated by an automated trading strategy without interrupting it
- ProOrder: semi automated trading: a TS should take control of manual trades to take care of them (trailing, money management, breakeven, etc.)
- new probuilder instruction to know if the current barindex loaded is the last one of history. Would make possible to draw on the last bar without using lastbaronly while also drawing in the price history of the instrument
- prorealtime IDE: a “select all” button is needed, for more accurate copy/paste 🙂
- variables drawn in DRAWTEXT got too much decimals, even if the variables have only 3 ..?
- possibility to comment many lines of codes at the same time (using kind of brackets /* */ like other programming languages)
- be able to have proorder strategies to communicate with each other
- buy/sellshort capabilities, at the same time, in the same strategy
- bid/ask spread information in a new probacktest instruction
- partial close of positions
- Renko displaying correctly and not linked to Close of the chosen timeframe candlestick (renko bricks cannot be erased!)
- possibilities to get ProOrder trading with non time linked “timeframe” such as tick charts, renko, range bars, etc.
- technical indicator applied to renko charts are not possible!
- multi instruments support in ProBuilder and ProOrder (EQUITFRAME?)
- multi timeframe support in ProBuilder (will be soon available in ProOrder first)
- “second” instruction (Date&Time) is missing and sometimes needed to build indicator
- “MathPow” instruction is missing and needed! (how to code Math Pow : https://www.prorealcode.com/topic/mathematical-functions/ )
- ProOrder instruction to know in real time the minimal stop distance of brokers
- ProBacktest instructions to get balance and equity of the current trading account
- link together open/close of trades graphically on chart, to get a better and comprehensive view of the different orders
- Monte Carlo analysis for strategy optimiser and for classic backtest
- Optimisation: limiting results with different sorting (not only money gain, but DD%, average trade gains, etc..)
- Fire sound alerts with codes
- Be able to colourize background of drawn shapes (rectangle, circle, etc.) with code
- Add new instruction in probuilder to define external variables, instead of adding them by hand in the parameter window
- Set variables more than only one time to UNDEFINED, to hide them from charts
- ProOrder strategies window: capability to filter/sort them
- ProScreener: add more than 256 candlesticks lookback please
- New instructions to round floor and ceil
- Drawing on right side of price chart (in the future)
- Get X,Y coordinates in pixels from one of the chart corner, and not in barindex/price format, to have the capability to get fixed drawn objects
- GRAPH can only return 5 variables, should be great to have more for debugging purpose
- debugging console with “PRINT” instead of drawing lines with GRAPH : better debugging!
- Predefined colours keywords instead of RGB coloring (example: RETURN variable coloured(red) as “my variable”)
- MAE/MFE averaged to get a whole picture of the strategy’s orders. Can be very useful to know where to place stoploss and takeprofit!
- new keyword to know if pending orders exist, just like “on market” but for that specific kind of orders (STOP & LIMIT)
- popup window when platform start to give information about the changelog of new features or modifications of the software
- data arrays: much needed since for some programming we can’t know in advance how much variables should be set. So it results that some useful indicators cannot be translated to prorealtime.
- delete the warning message about the fact that a variable is not used in the code, very annoying and useless IMO.
- External variables for ProScreener AND ProOrder, like those for ProBuilder (indicators)
- Bring back the “Label in Properties Windows”, which disappeared in 10.3
- Ability to move up/down variables in the “Definition of Variables” window, actually if you want to sort them, you need to delete them all first..
- change the default behaviour of the color setting: possibility to plot dark shape on a dark background and vice-versa for bright background. It is not possible actually to make something really transparent (shapes, curves, etc.), even with the alpha variables from COLOURED keyword!
- TRADETYPE : new keyword to know the type of position opened on market with array offset possibility like TRADEPRICE for instance (TRADEPRICE(2) = BUY or SELLSHORT of the previous 2nd order from now).
- bolUp=BollingerUp[20,3.5](close) / need a possibility to change the standard deviation coefficient for the Bollinger Bands indicator without recoding it (in this example, we add 3.5 deviation to the middle SMA instead of the default 2.0 which cannot be modified actually with the current instruction).
It would be nice to have a separate window in PRT where you can write notes.
Use it as a To Do-list, keep reminders, list of all Active running systems etc.
Thanks Nicolas for opening this thread.
As already mentioned, I’d love for PRT to allow the placement of guaranteed stops in proorder when we code our strategies
 bard
bardParticipant
Average
What is missing are the file operations in an indicator or strategy Createfile, openfile, readfile, writefile ……
Some method / function is required to determine which is the most successful Auto-Trading Strategy (ATS)?
Currently I have to scroll up and down the 200 ATS (4 x 50) and then laboriously click on View Performance and then try and remember the figures or write / type notes then move on to the next, then move on to the next …… etc. All seems not what we are used to in 2017!?
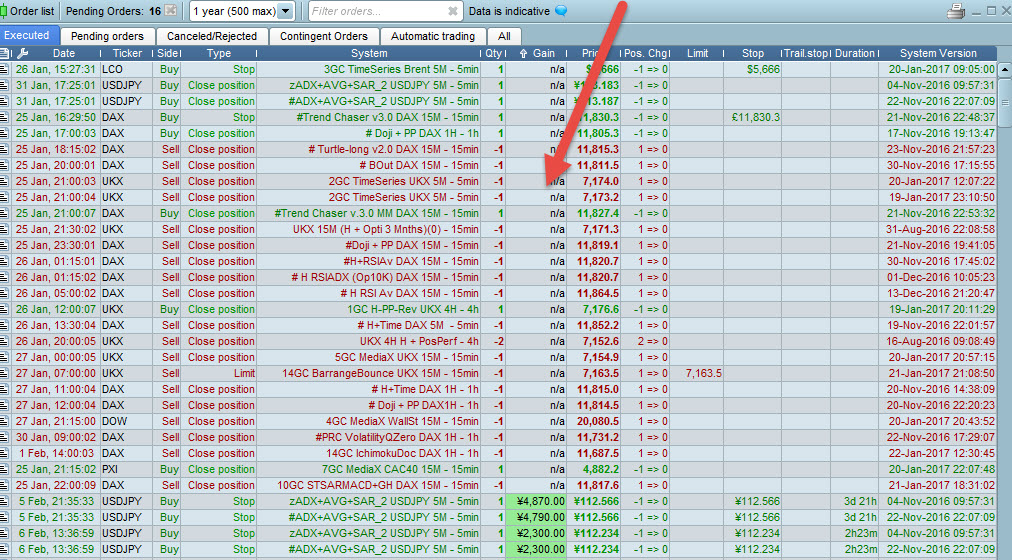
I’d be more than happy if the Orders List were to be faithfully populated with data (esp gain / loss) and if only I could drag and drop all Orders into excel then I could pivot and analyse to my hearts content … alas gain / loss entries in the Orders List are only about 50% populated (for reasons known only to PRT??) and I can only drag maximum 100 rows into excel for analysis.
Excel Pivot Tables has got to be the easiet and best as dates can be set as number of days and then all ATS factored up to the same period (inherent errors in that logic I know :)) and then soemthing appraoching a meaningful comparison between ATS can be made. Also a ‘weekly add of new data’ and it could easily be kept up to date.
So PRT please can we have …
- 100% of gains / losses populated in the Orders Lists?
- Drag and Drop of all rows into excel (if we have to, we can live with the 500 row limit in the Orders List).
If you can’t give us above (IG restrictions?) then how about ‘summary / overall ATS Analysis’ of some sort? Even ability to sort by version date of ATS, gain / loss, ATS name etc would be a start!?
Hope above makes sense, if not just say?
Hoping to make a great Product even Better!
GraHal
Apologies to PRT … my suggestion above that about 50% of the ‘Execusted Order List’ show unpopulated Gain was incorrect, but a significant number are unpopulated … see attached.
Ha It’s great making bold statements cos it challenges me! I just thought … maybe n/a means exit break even!? 🙂 I’ll check out a few entries and report back!
Yesterday, I printed (executed orders) to .pdf and then converted to excel (using Nitro Converter) but gave up due to issues but also due to the n/a skewing my results. If n/a does mean breakeven then that method could be back on again! 🙂
Re above … n/a does not mean ‘break-even’! So it’s ‘back to the drawing board’!
In the “graphic properties” window, we can already customise in % the displayed future. It would be nice to have the possibility to also customise how the price window automatically adjust itself with the amount of vertical space left in % (or a number of points) above displayed high and below displayed low.
Purpose of the suggestion: in this way, all personal indicators added in the price window above and/or below the price at a desired sufficient distance away from price could remain visible rather than just outside the window for candles in the displayed high and low areas, without needing to readjust it constantly with the mouse+left click. Will probably become useful too with increased usage of the new “drawarrowup/down” and “drawtext” functions of v10.3
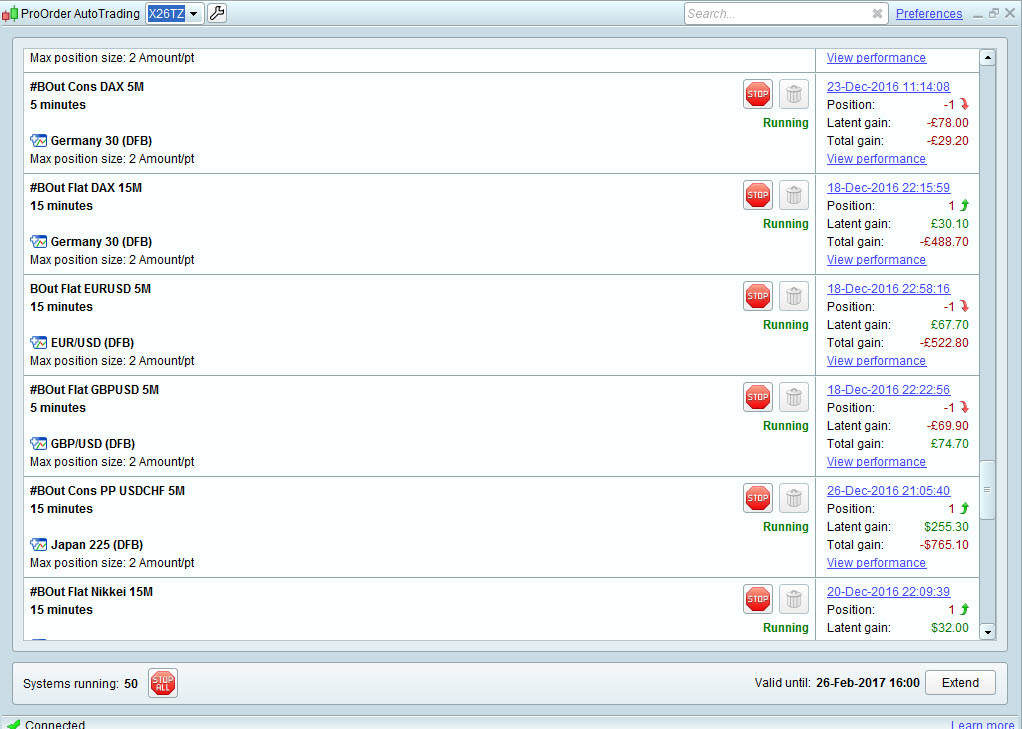
It would be soooooooo useful if the ‘ProOrder AutoTrading Window’ were split into columns and the main performance stats for respective running Strategies to be shown in columns. These columns could then be sortable by whatever stat one prefers … % of winning trades, gain / loss ratio, max drawdown etc.
To suit space across the window … all the performance stats could be available for selection by user preference (just like the Orders List).
This would save a lot of frustration clicking on the ‘View Performance’ button and then having to make notes in order to recall which is the best performer in this or that chosen area.
Looking at the ‘ProOrder AutoTrading Window’ there is so much wasted space doing nothing at all and even the information that is shown is not readily ‘scannable by eye’ (as data in columns is).
Many Thanks in Anticipation PRT
GraHal
Not sure how often PRT may look at this Thread (if at all?) so I sent below to PRT (via IG). Hope it meets with your approval guys?
Suggestion for a much needed improvement.
Re the window shown below … it is very inefficient, frustrating and time wasting to see which Auto-System (ATS) is showing the best % of winning trades, gain / loss ratio, max drawdown etc etc. I have to click on the View Performance button and then make notes! I have 100 ATS running and so this process has to be repeated 100 times and even then I am left with a whole muddle of notes to decypher. Then in a few days / 1 week this whole process has to be repeated! The ‘PRT toolset’ is generally good, but lack of an effective ‘finishing off / analysis tool’ is making me feel like giving up with Auto-Trading altogether!
The window attached below and the ‘View Performance / Overview Dashboard’ may be okay for users running 2 or 3 ATS, but it just doesn’t work for many users now running numerous ATS in Demo trying to decide which ATS to Live Trade.
It would be soooo useful if the ‘ProOrder AutoTrading Window’ were split into columns and the main ‘overview performance stats’ for each ATS were shown in columns. These columns could then be sortable by whatever stat one prefers … % of winning trades, gain / loss ratio, max drawdown etc. In 1 second / 1 click I could then see which ATS is best on whichever measure I choose.
To suit space across the window … the performance stats could be available for selection by user preference (via wrench icon like ‘Executed Orders List’).
The current ProOrder AutoTrading Window has so much wasted space doing nothing useful for the user! Even the information that is shown is not readily ‘scannable by eye’. Data in columns (of same data type) is easily scanned by eye and can be sorted and would therefore be so much more user friendly and useful for ATS analysis.
Hope above makes sense, if not just ask?
Hoping to Make a Great Trading Platform even Better
Graham
Enable PRT to pull in and work with all available data for an instrument from IG such as but not limited too;
- BUY/SELL PRICE
- SPREAD
- MINIMUM STOP DISTANCE
- MINIMUM ORDER SIZE (BONUS – ALLOW ORDER SIZE<1 !)
- ALL AND ANY OTHER AVAILABLE DATA (SLIPPAGE etc.)
Many thanks
Max
Hi
It would be great to be able to place an automated trade with an amount not being a whole number, my strategy needs to buy at £1.40 (but you can only have £1,£2,£3,£4 etc)
so therefore i am forced now to look at the MT4 platform instead of PRT.
It would be useful for me if the display of your particular systems had a “last modified day and time stamp displayed”
Hi John, do you mean Systems displayed on this site?
If you mean Systems displayed on PRT then they do have a date / time stamp when you set them running in Demo & Live.