I had a few minutes to work on Annualised Standard Variation and I came up with the following indicator that calculates it based on a rolling year. It counts how many candles were in the last year and does the calculations based on this number.
It is very slow to calculate due to the loop!
startdate = opendate - 10000 //date 1 year ago

//wait till we have 1 year of candles
if opendate[barindex] < startdate and not done then
p = barindex
done = 1
endif

//at start of day count back how many candles till this date last year.
if done and openday <> openday[1] then
for j = 1 to barindex
if opendate[j] < startdate then
p = j - 1
returnperc = ((close - close[1])/close[1])*100
standarddev = STD[p](returnperc)
variance = standarddev * standarddev
annualvariance = variance * p
annualSTD = sqrt(annualvariance)
break
endif
next
endif

return annualSTD as "Annualised Standard Deviation"
 Bard
BardParticipant
Master
Yeah, no need to sign up Vonasi! If you download it may add a mdlp extension, so just delete mdlp, so the file name ends with .xlt and Word will open okay.
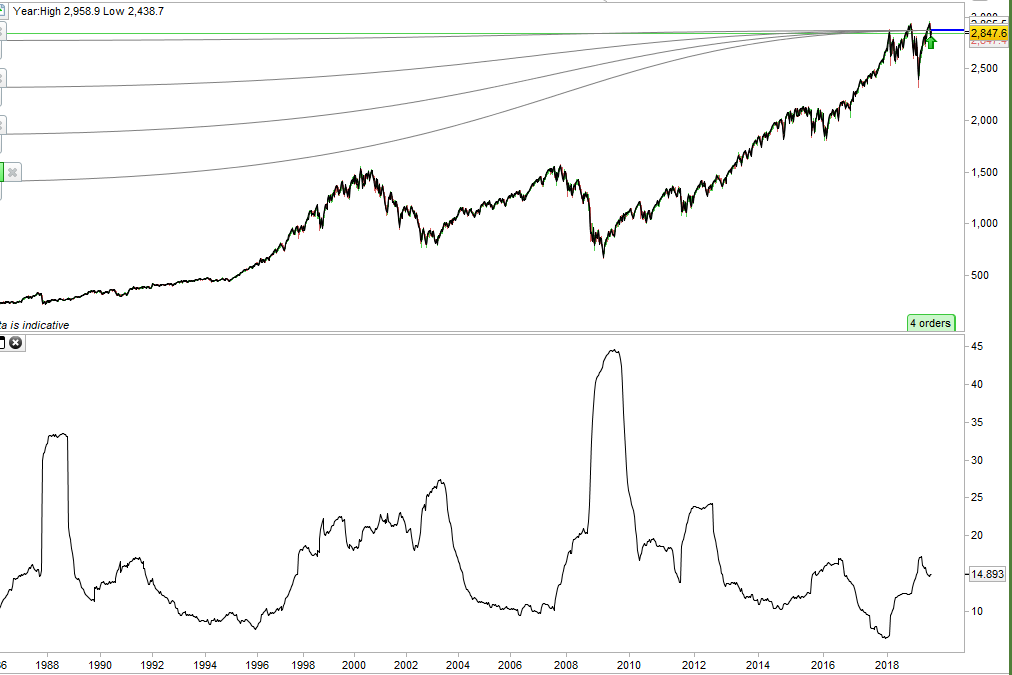
I did consider starting a new topic referencing this one, so apologies if I’ve taken it a bit off topic. Re: lagging indicators. I was thinking of just using (in the case of the Dow), the 10% as a hard Stop (if anyone can code it), i.e. close the current position if it reaches more than whatever a given markets Annualised Standard Deviation is. In the case with the Dow Jones that would be 10% from the positions opening price or 10.55% to be more precise.
I guess the point I was trying (failing) to make is that random %’s of equity stops are meaningless as they don’t take into account a markets historic deviations and therefore the probability of those Stops being hit (assuming a normal bell shaped probability distribution). Eg in that case why not then just stop a position when your capital has some random drawdown figure of 8.75% or 5.33%? It’s meaningless, until a trader has taken into account historical (statistical) deviation on which to base position size (and it would be a good idea to look at the instruments Option implied volatility too, to see how the market is pricing current volatility). How you do that — and legendary traders like Richard Dennis had quite crude approximations of volatility / number of positions / position size rules — is up to the individual and no method is perfect, but to ignore it will cost a trader wasted losses (due to under capitalisation and/or incorrect position sizing) in markets that are just “noisy” and not going through some fundamental change in trend.
Cheers
Bard
BardParticipant
Master
Wow, nice one, thanks very much, I didn’t see your post/code above until after I had posted my reply last night (to your previous comment about uploading Excel and the YouTube clip).
BardParticipant
Master
Hi Vonasi, I added your indicator and noticed the higher range of values compared to my Excel Daily Annualised Std Deviation calculations and was wondering if you know what is causing those differences in readings?
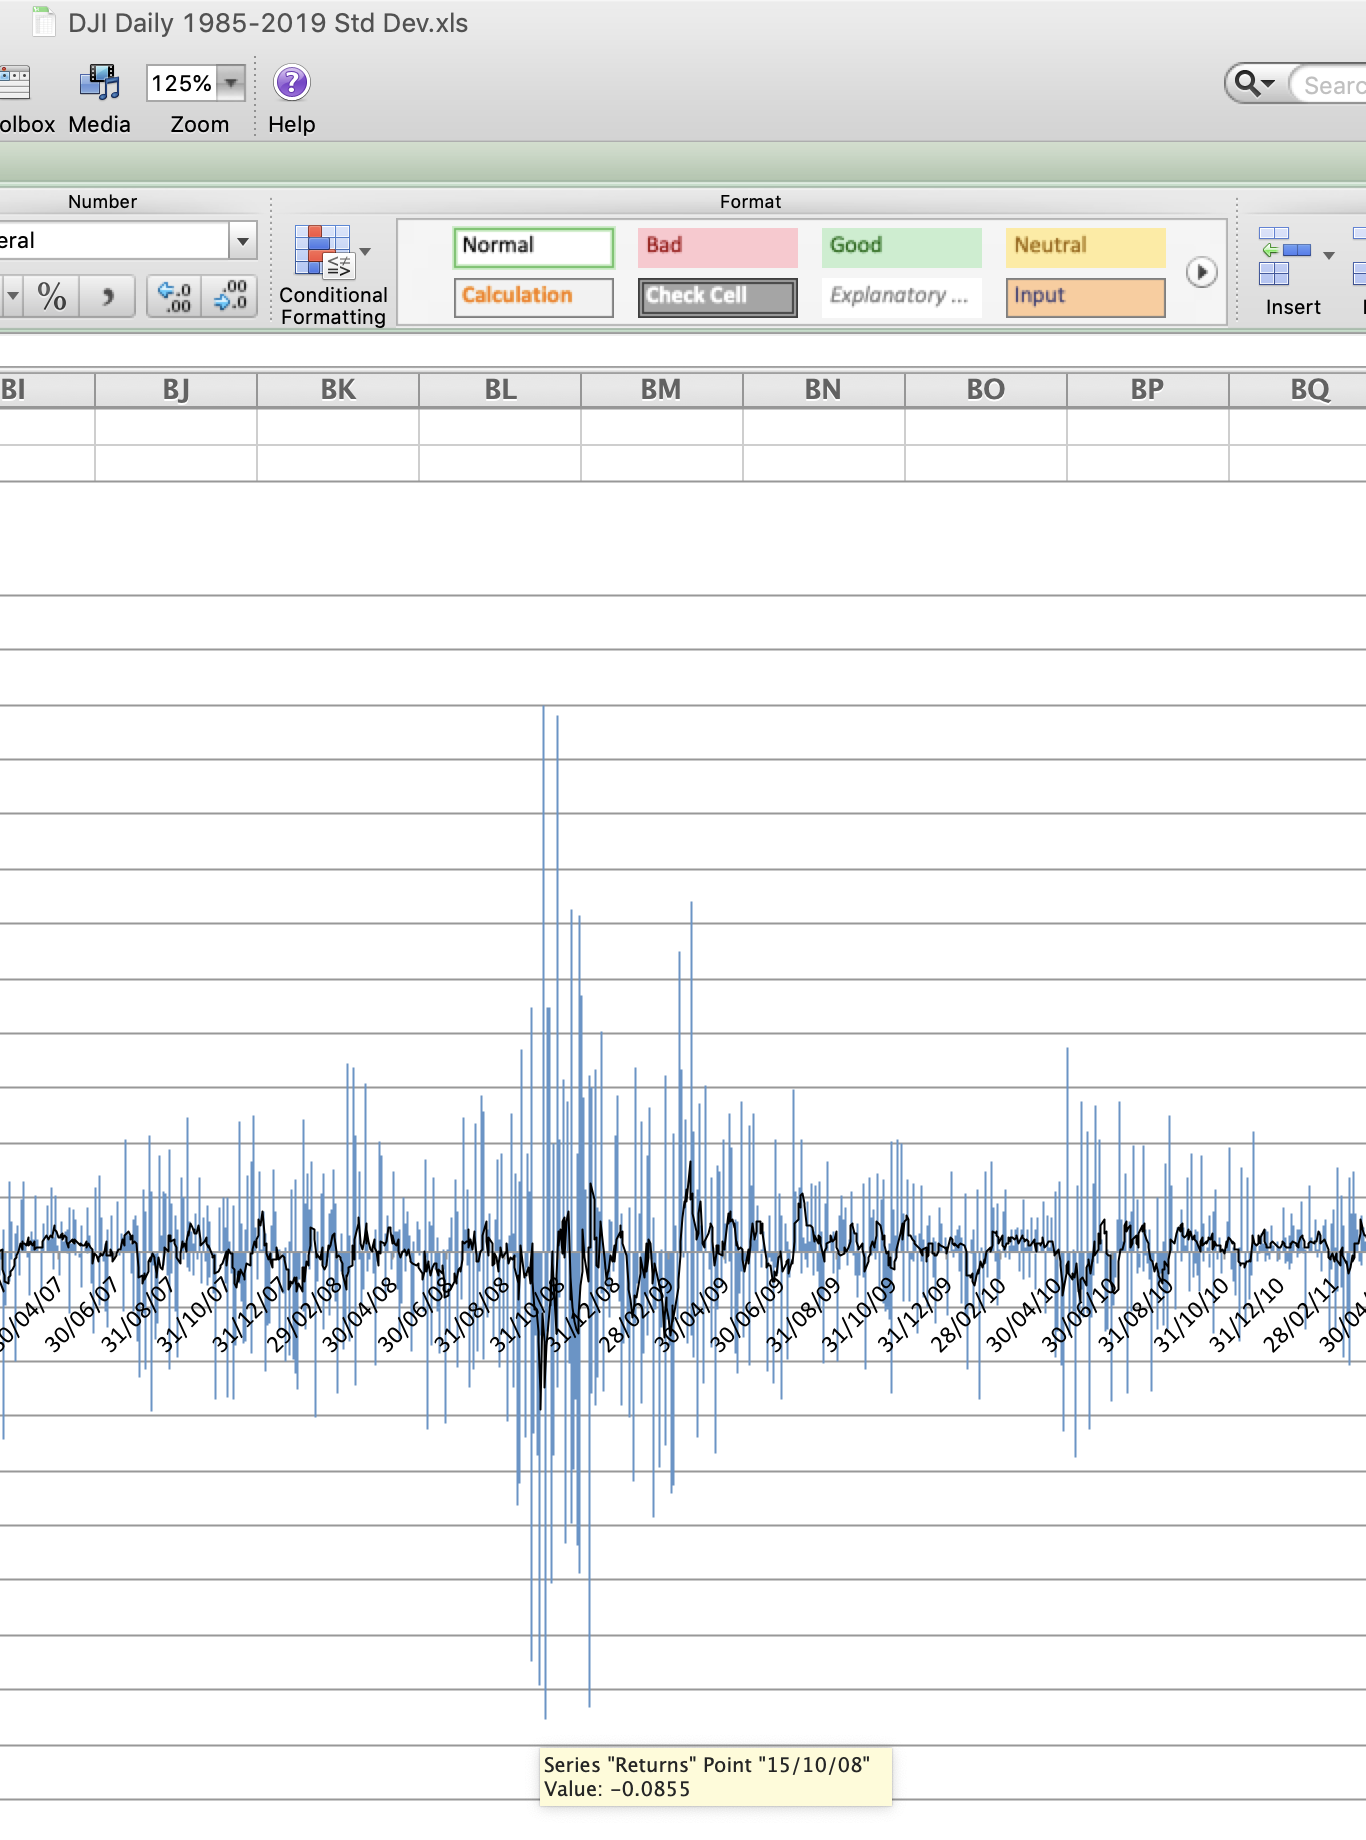
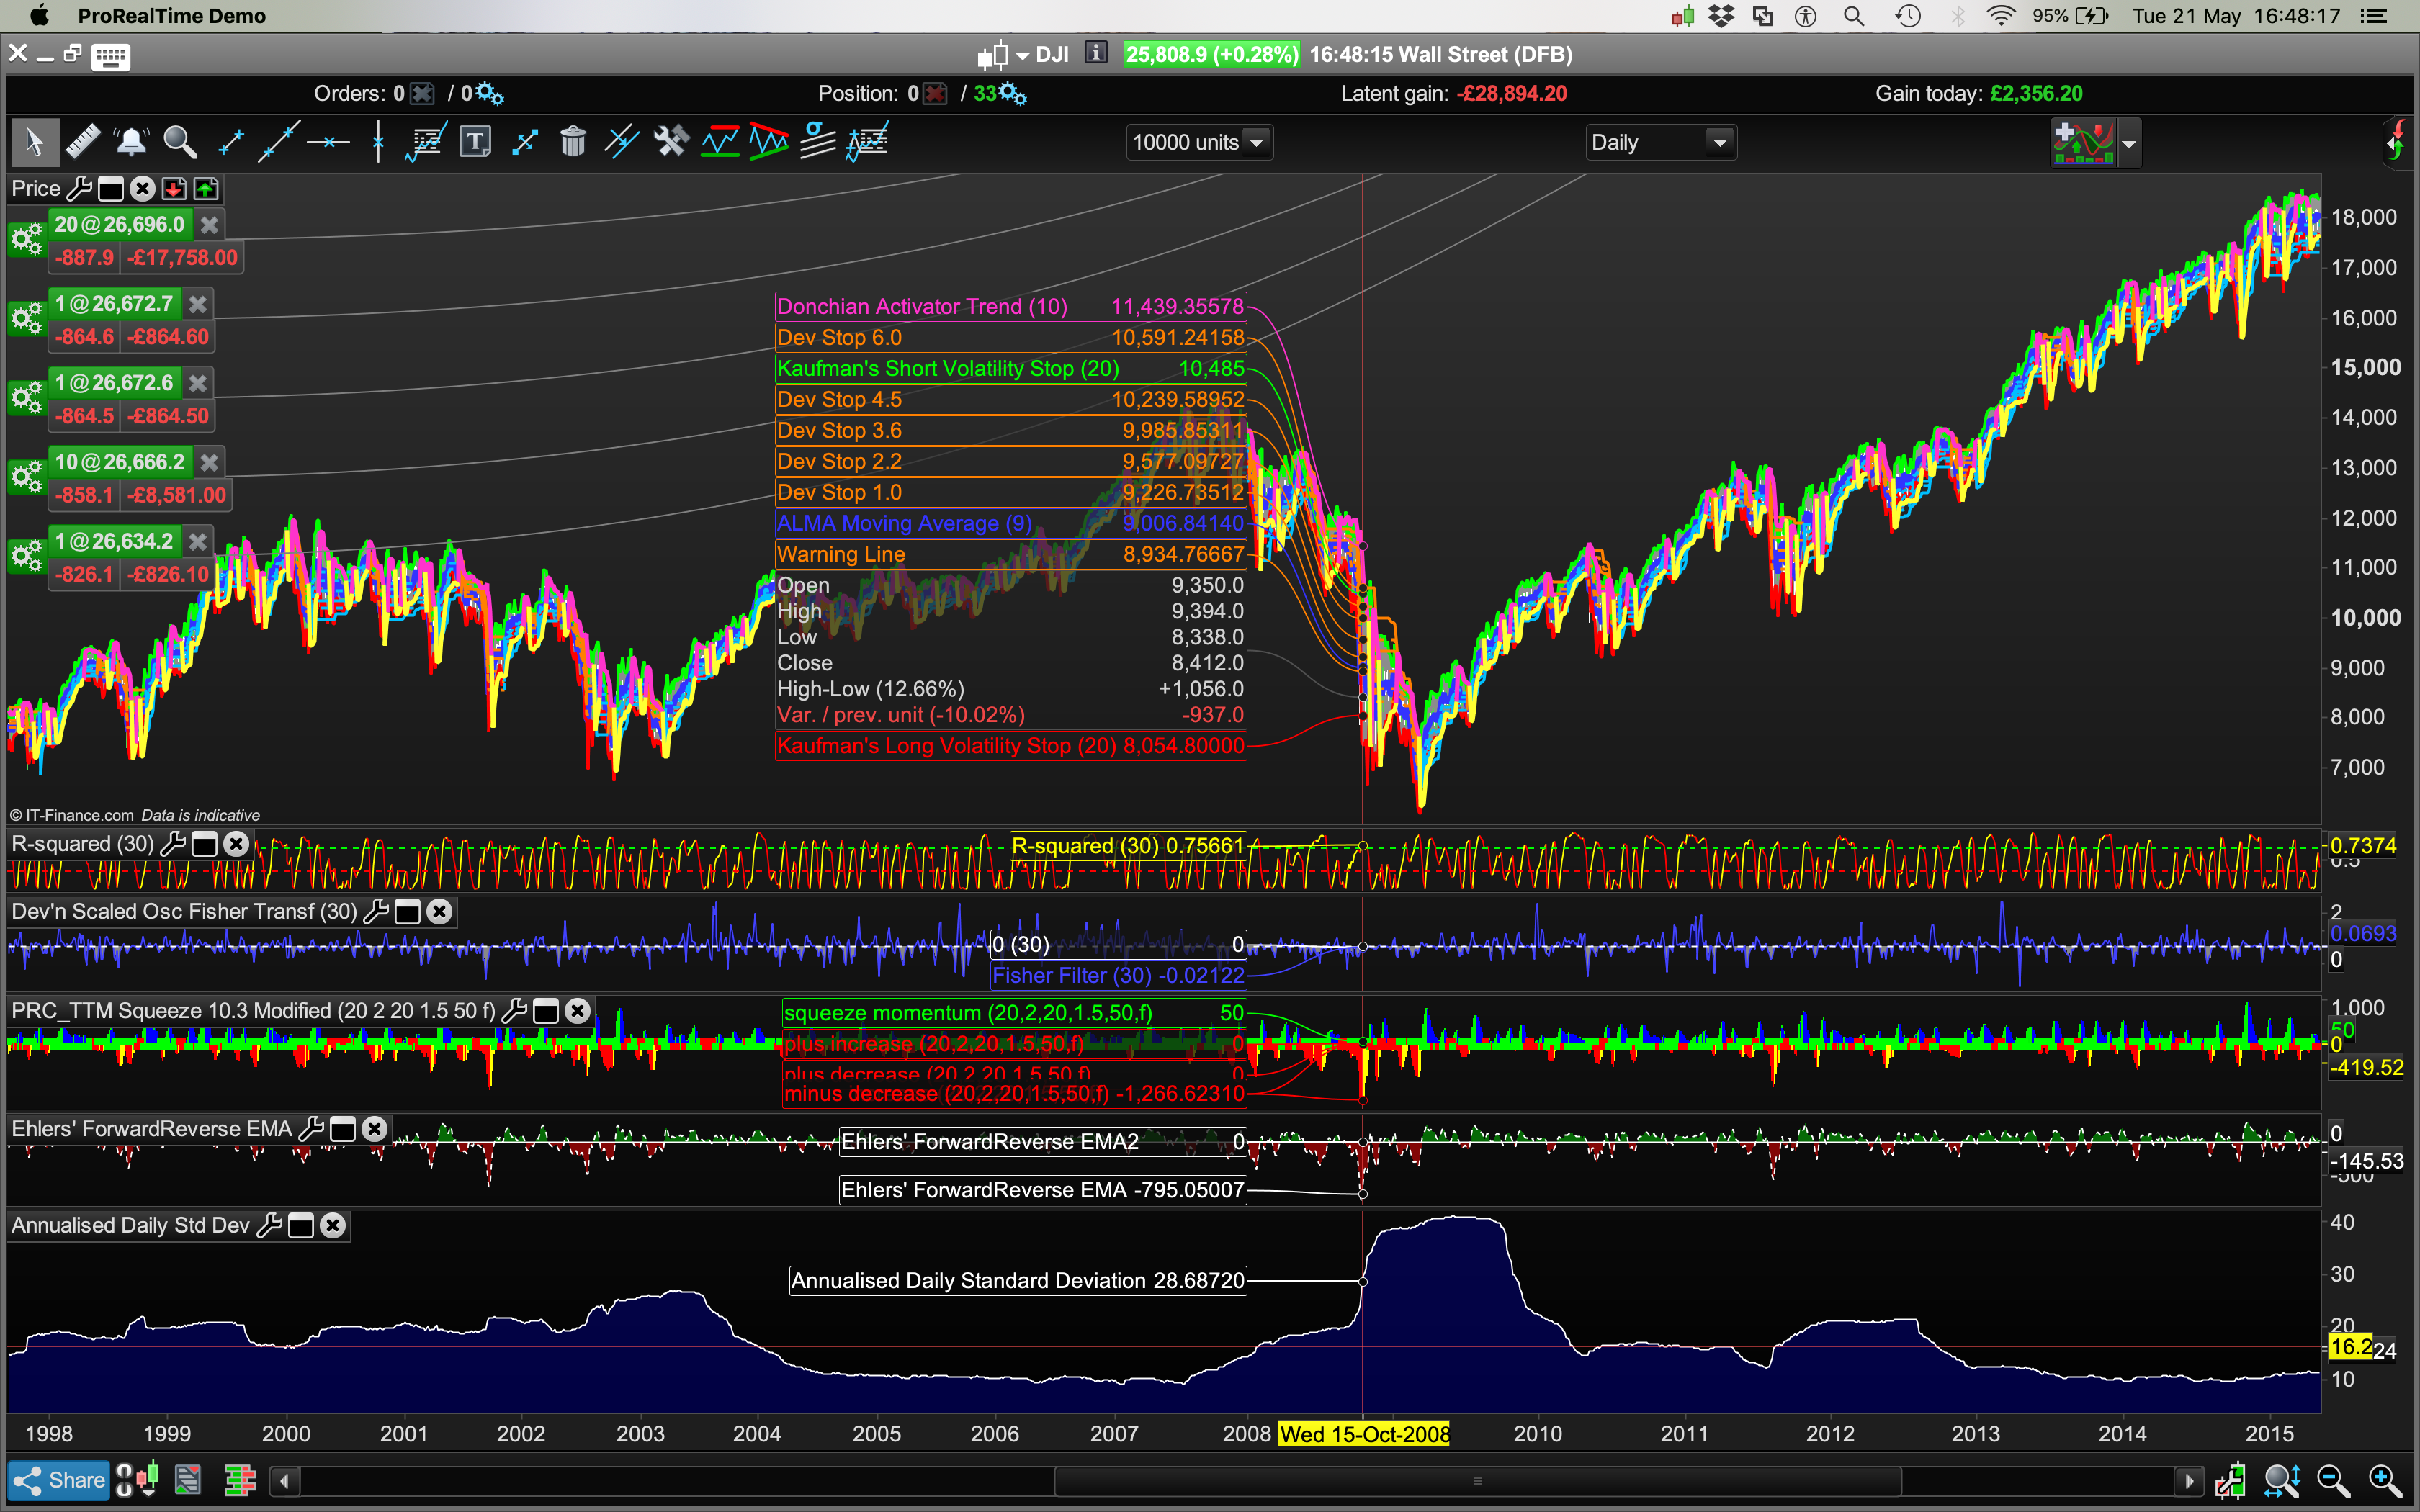
Eg: My Dow Jones, Oct 15th 2008, Daily Annualised Std Deviation equals 8.5%, whereas your indicator equals 28.6%? Pls see screenshots. Cheers.
There are only two possibilities and that is different data or different calculations. I don’t know what data you used for your calculations but I imagine it was not extracted from the PRT platform. The data I use in the indicator is based on whatever candles PRT have produced between the this date and the same date a year ago and I imagine that these candles and the quantity of them is most likely different to the data that you are using. Like all calculations what you get out is only as good as what you put in.
The other possibility is that my calculation is not correct but it should exactly match what was shown in the YouTube video. You will have to check your Excel calculation to make sure that it is exactly the same.
I very much suspect that it is a data issue.
BardParticipant
Master
Yes, I found some time to look at the Yahoo data download of the Dow Jones and the IG Index Dow charts and the first thing I see is that the Yahoo data is one day in advance of IG. However even allowing for that, the 14th Oct 2008 (IG) or 15 Oct 2008 (Yahoo) price plunge was about 7% to 8%. Your chart shows a high value of 28%? Is this to do with how the annualised std deviation was calculated? I used this calculation which matches the youtube calculation methodology – pls see screenshot. What do you think could be causing the difference? Cheers again,
I can’t see anything different in my calculation compared to the calculation in the video you provided a link to.
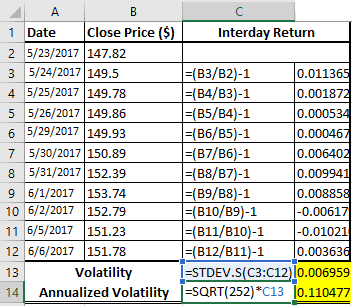
In your Excel calculation you seem to have only 10 days worth of data but you are calculating it based on 252 bits of data? You also don’t seem to have all the parts of the calculation needed.
The calculation as I recall takes the percentage change each day then calculates the standard deviation over the lookback period. It then squares that result and multiplies that by the lookback period and then finally calculates the square root of that. I don’t see all of those stages in your calculation or the required amount of data to achieve them.
BardParticipant
Master
Thanks Vonasi, I figured out why your readings are in the 30%’s over that Oct 2008 period. My Excel is giving an annualised reading of 8% in mid October 2008 because that represents the annualised value of 250 days but NOT from the specific period 16/10/07-15/10/08 as per your rolling basis!
If I calculate the rolling annual period of 16/10/07-15/10/08 in Excel, I also get 28%. Phew!
Ps/ The Excel image was just a guide to std deviation calculations. I used all the 8,579 rows of historic past data in my Excel sheet.
Your calculation code is entirely correct, as is the Youtube clip/calculation, and also this resource http://etfhq.com/blog/2011/02/07/standard-deviation/
on how to calculate the SD.
If you use the above code on a strategy with money management then it won’t work very well. Best to use a percentage of equity as your maximum allowed drawdown if that is the case
Capital = 3000
MaxDrawDownPercentage = 66

Equity = Capital + StrategyProfit
MaxDrawdown = Equity * (MaxDrawDownPercentage/100)

IF OnMarket and ((PositionPrice - low)*CountOfPosition) > MaxDrawDown THEN
Quit
ENDIF
Hello Vonasi,
In my backtesting I’m using this, is it conceptually equivalent?
StartCapital=3000
MaxLossPercentage=50
MaxLoss=-StartCapital*MaxLossPercentage/100
FloatingProfit=strategyprofit+positionperf

IF FloatingProfit<MaxLoss THEN
Quit
ENDIF
It seems to me that I’m using a fixed risk value based on starting capital, while you use a real drawdown % from the updated equity. I chose my way because I wanted to fix the real risk allocated for the trading system, but perhaps it’s more useful to use the real drawdown for testing purposes. What do you think about this?
Another question:
((PositionPrice – low)*CountOfPosition) > MaxDrawDown vs FloatingProfit<MaxLoss are equivalent expressions?
Thank you in advance
This is quite an old topic and I’ve not read through the whole thing to remind myself of the main points of discussion but equity is equity! Whether that is calculated on already won/lost equity or starting equity is up to you.
As for:
((PositionPrice – low)*CountOfPosition) > MaxDrawDown vs FloatingProfit<MaxLoss are equivalent expressions?
The answer is no. All calculations are carried out at the close of a candle and the low can be very different to the closing price which PositionPerf is calculated on.
Please always use the ‘Insert PRT Code’ button when posting code to make it easier to differentiate from other text. I have tidied up your post.