Regarding working out how close a strategy is to buy and hold the indicator shown here might be useful to someone.
https://www.prorealcode.com/blog/learning/buy-hold-comparison-automated-trading-strategies/
As my taxi driver said last time : The first million is always the hardest. Why ? From 1 to 2 millions you only need to double your capital…
…and as someone once said – The easiest way to become a millionaire trading the markets is to start with two million.
If you use the Chrome browser and right click, translate to English … any good Vonasi?
I’m reading it all now!
Thanks for the link verdi55 but unfortunately my language skills are not quite quite up to the quantity of German due to it being 100% German! Are we allowed to promote outside signal services on here? Someone may be along soon to tell you off!
Well, as long as you do the transactions via your ProRealtime premium account and become a successful trader generating more and more volume, it will make them happy, I think…
If you use the Chrome browser and right click, translate to English
I never use Chrome browser but maybe I should give it another go if it now does stuff like that now. I’ve been using Opera for so long now that anything else just feels weird.
 Bard
BardParticipant
Master
Thanks @Vonasi, this drawdown percentage code is just what I was looking for as I was using Excel scatter graphs to compare optimisations on a mean reversion system and was comparing the period with the gain but wishing the optimisation results would show the drawdown too. (Often you see a good profit figure but when you click on that particular optimisation result, it’s then that you realise it had far too high a drawdown). Do you know if PRT will be adding 3-D graphs and/or Sortino and Sharpe ratios in their results? That would be great if they did.
Do you know if PRT will be adding 3-D graphs and/or Sortino and Sharpe ratios in their results?
Yes they will. Expected in version 11.
Actually the code provided above doesn’t calculate max drawdown properly. Max dd is a cumulative value, that is you could have a sequence of losses that brings your equity below the high-water mark value minus drawdown. The code above only takes into consideration current open positions vs current equity. The following code calculates max dd correctly and can be actually used on any strategy to filter out, during backtests, results above the required max dd:
// Max cumulative open drawdown
capital = 10000 // initial capital
maxDrawDownPercentage = 20
once maxEquity = capital
floatingProfit = (((close-positionprice)*pointvalue)*countofposition)/pipsize //actual trade gains
floatingEquity = capital + StrategyProfit + floatingProfit
IF (maxEquity < floatingEquity) THEN
maxEquity = capital + StrategyProfit + floatingProfit // update high-water mark
ENDIF
maxDrawdown = maxEquity * (maxDrawDownPercentage/100)
IF floatingEquity < maxEquity - maxDrawdown THEN
Quit // abandon strategy with dd above required
ENDIF
I hope you may find it useful.
Hey good, thank you upanisad
I just added your code to here Snippet Link Library … keep em coming please! 🙂
Thank you for your version upanisad. It has been a while since I coded that drawdown quit filter and I can’t exactly recall how I wanted it to work! I think my intention was to quit any optimization runs if any one trade had a bigger draw down than I was comfortable with. I think that adding both quit filters to a strategy would be a good thing – we could then quit the test run if any one trade had a bigger draw down than we would be comfortable with or if a combination of trades resulted in a bigger overall draw down than we would be comfortable with.
There was a typo in your code (an IF THEN starting mid line) which I have edited in your post.
BardParticipant
Master
Thanks for the code posted here @upanisad and for @vonasi starting this thread off.
It occurred to me that setting arbitrary (but necessary drawdown limits) doesn’t take any account of the market price in relation to its statistical variation (say over the last year or longer) or position size.
I was wondering how could the above code be coded so that instead of taking an arbitrary 20% loss – a figure that bears no relation to what the volatility of the market is doing – the system stops when the volatility of the market has become statistically significant from an historical point of view but within or at the 20% threshold?
Only if the position goes beyond an historic volatility threshold (11.55%, pls see below) OR the trade hits the 20% loss should the system quit.
Eg. Why would I want to close a system down if the market has only moved 5% and caused a loss when the daily annualised standard deviation is 10.55% and there is still some safety margin left? This is more to do with correct position sizing. If a 5% move has hit my 20% drawdown limit then I’m overtrading and need to cut position size down by at least 50%.
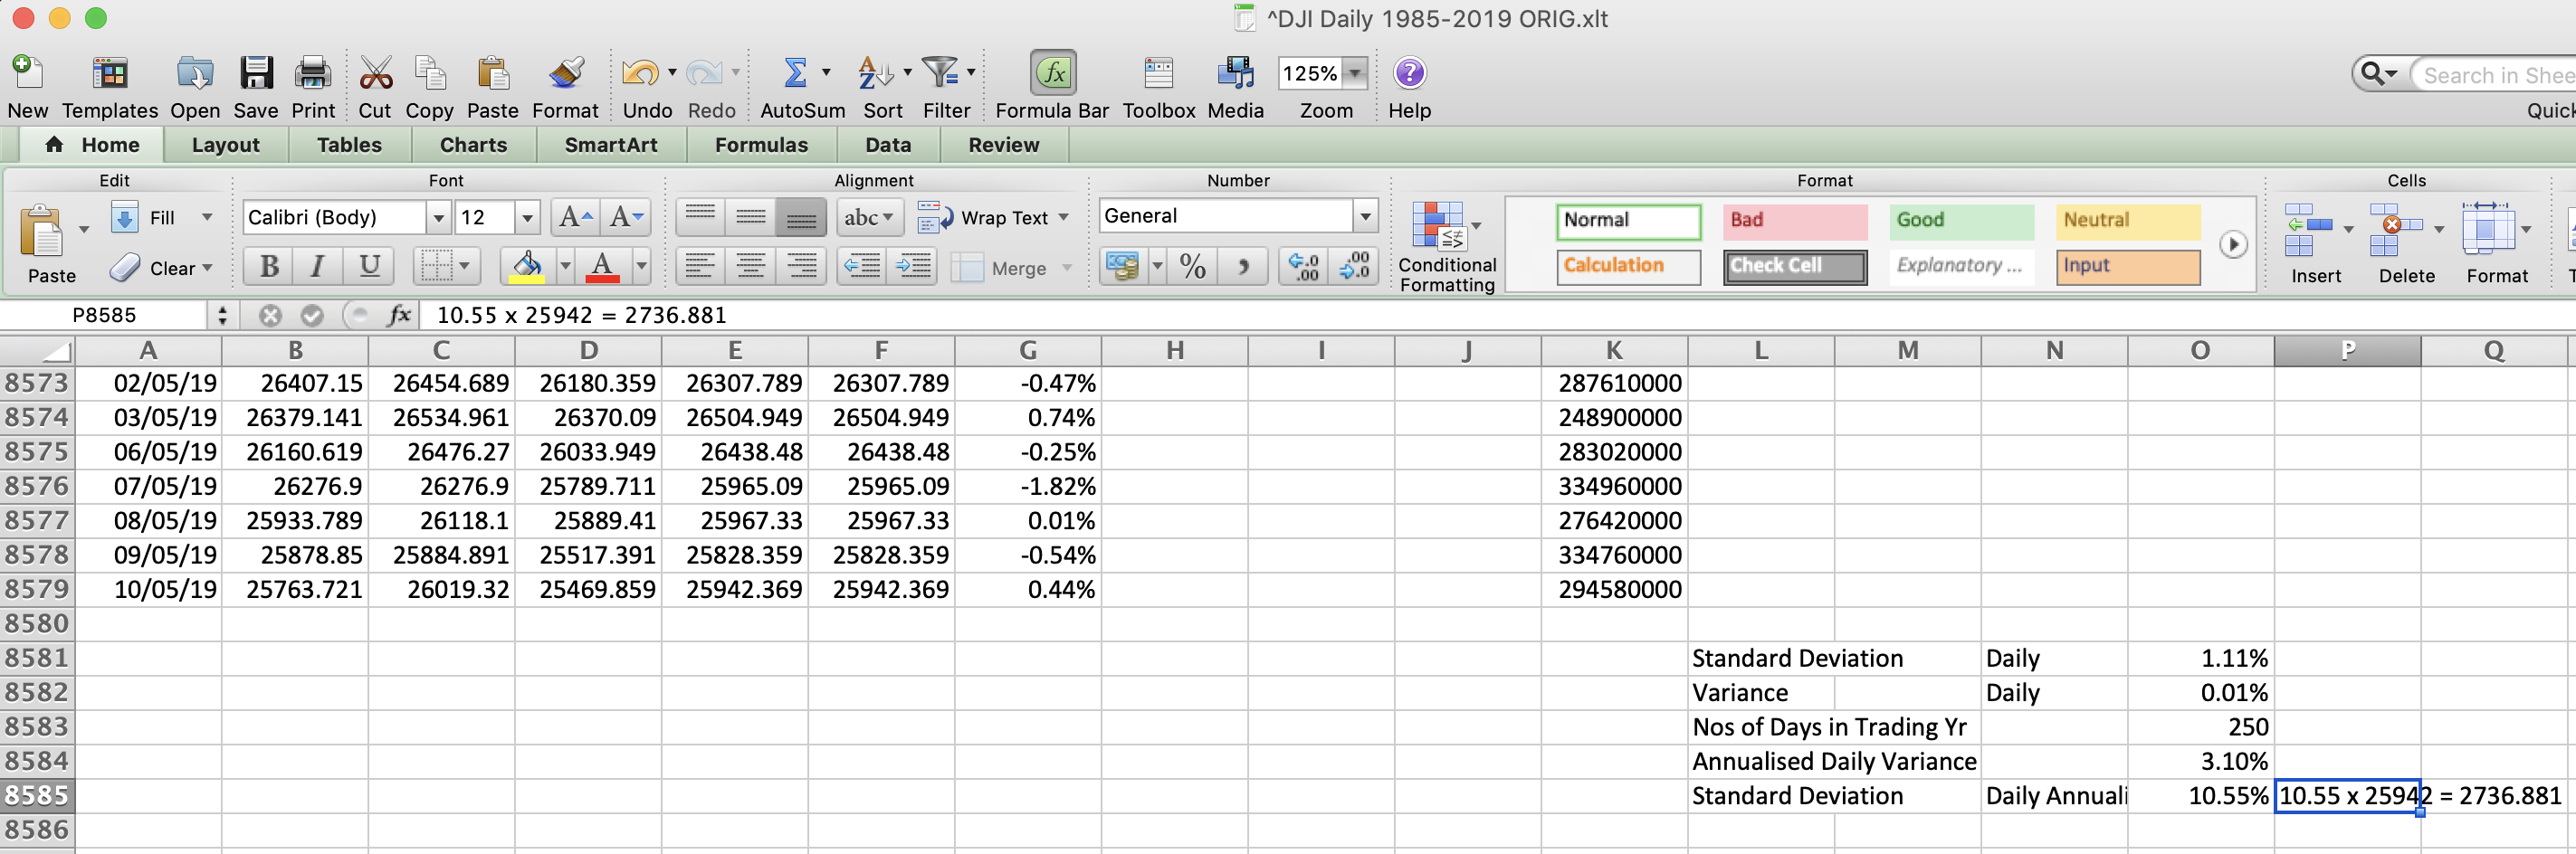
I’ve posted the Excel sheet I used to work out the daily standard deviation of the Dow Jones from 1985-2019 using Yahoo Finance data here: https://www.dropbox.com/s/tkkua5fhosxa31d/DJIDaily1985-2019StdDev.xlt?dl=0
Ps/ Here is how to Calculate Annualised Standard Deviation from Stock Prices in Excel: https://www.youtube.com/watch?v=S4Z0KJJ2UfE
I’ve also posted a screenshot showing the daily std deviation calculations at the bottom of the spread sheet below for easy reference.
Can it be coded so that a Dow Jones system quits if the volatility for the Dow Jones goes beyond the historically significant 10.55% (daily annualised std dev) level?
Assume you’re trading at £1/tick position size with a £20k account and the Dow drops 2,736 points (11.55%). You now have a 13% drawdown but THAT should be the exit point, not 20% of your capital.
Can a position sizing algo also be included?
Capital = 200000 + strategyprofit //Current profit made by the closed trades of the running strategy.
n = 1.0*Capital / close

(Buy n Perpoint at Market)
Cheers,
First off I will admit that I have not downloaded your XLT file or watched the YouTube video as I’m a little busy at the moment.
I started this thread over a year ago and I think that my original intention was to find a way to improve the way that the optimization results were presented. We only ever get to see the top 100 results based on overall gain no matter how that gain was achieved. My intention was to eliminate results with massive draw down from the top 100 as it is very easy to make a very profitable strategy with a massive draw down.
What you are suggesting is using volatility as a filter. Like all filters this is just another condition to be optimized and so we have to then decide how do we define abnormal volatility? You have suggested Annualised Standard Deviation but this just gives us at least one more variable to optimize. Like all filters lag is our big enemy and however you decide that volatility has changed lag will be involved. Indicator lag will always equal curve fitting when that filter/indicator is optimized.
My original intention was to eliminate combinations of variables that lead to large draw downs even if they are very profitable whereas your suggestion is to add a filter that can only ever increase curve fitting.
BardParticipant
Master
Cheers @vonasi,
Don’t worry about the video (it’s to help people with Excel and Std Deviation).
I get the part about massive drawdown being included in the results, which isn’t helpful for anyone trading specified limits of pain tolerance.
And to that end it’s important to understand what kind of pain tolerance/position size will be needed based on the market you are trading. I wasn’t intending the volatility to be optimised at all. There is no need. The limits have already been defined. The history of the market’s annualised volatility (however measured eg even using ATR instead of Std Devs) is the best indicator that we have. The “filter” is really not how I think of it. I think of it as being a hard stop and similar to a rally driver driving with a navigator. If you don’t know how sharp the bends are (i.e. the history of the markets statistical volatility) then expect to end up embedded in a tree at some point in the future!
I think you’ll appreciate the smaller chart below the main chart in the Excel file, it gives a very easy to see approximation of what could be “unexpected bends in the road” (i.e. spikes against your position).
If you could just add the Excel file to your post as an attached file that would save everyone having to sign up for a drop box to look at it.
Any indicator with a time period involved in it (yours is set at annual) has to be checked to see if it is optimized or can be used with any time period. Every time period will have lag dependent on how fast or how slow it is. So you are considering having your hard stop based on a lagging optimizable indicator.
I just watched the YouTube video and the first problem that springs to mind is that the calculation is based on a rolling year of close prices. Without arrays this is difficult to do (not impossible but challenging) as every year does not have the same number of daily candles. We could pick a fixed number of candles that sort of fits what we think is a year but this is not very accurate. I coded something elsewhere on these forums that counted how many candles were in a year and it varied massively. There have not always been six candles in a week and with holidays and major market closing events etc it all gets a bit messy. With a fixed period rather than a rolling year period it should be fairly simple to calculate a Standard Deviation for that period but it will not be an Annualised Standard Deviation. By choosing a fixed period we have seriously entered into the world of curve fitting by optimization when back testing especially if we consider that every year in candle quantities will not exactly match our chosen period.