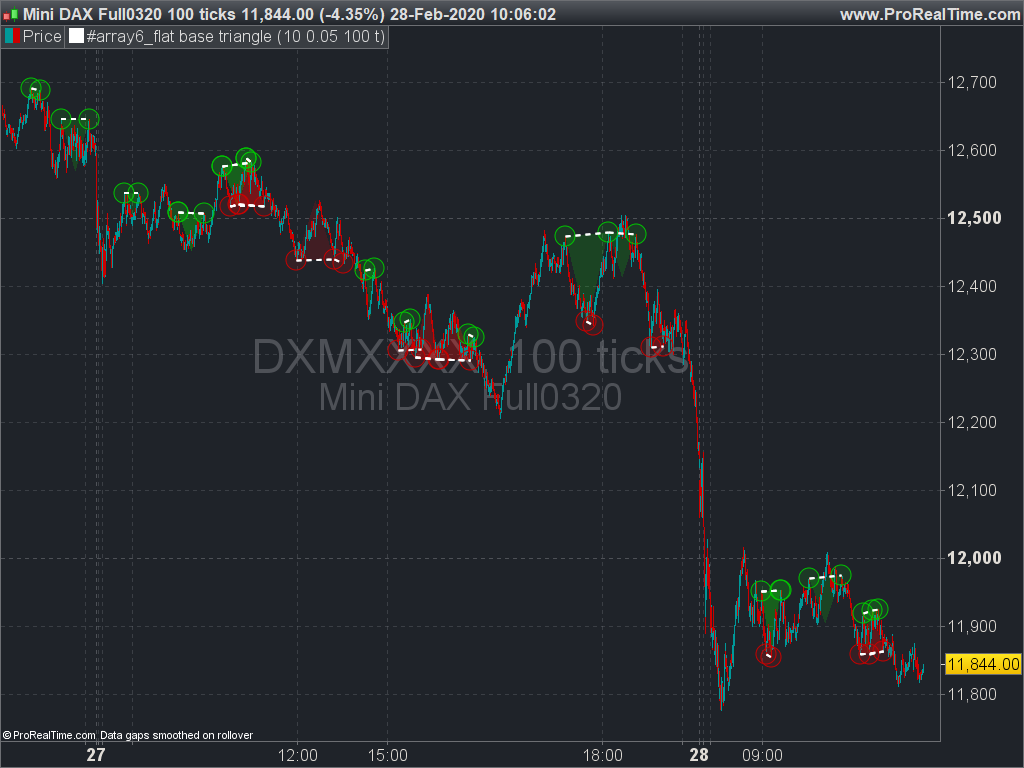
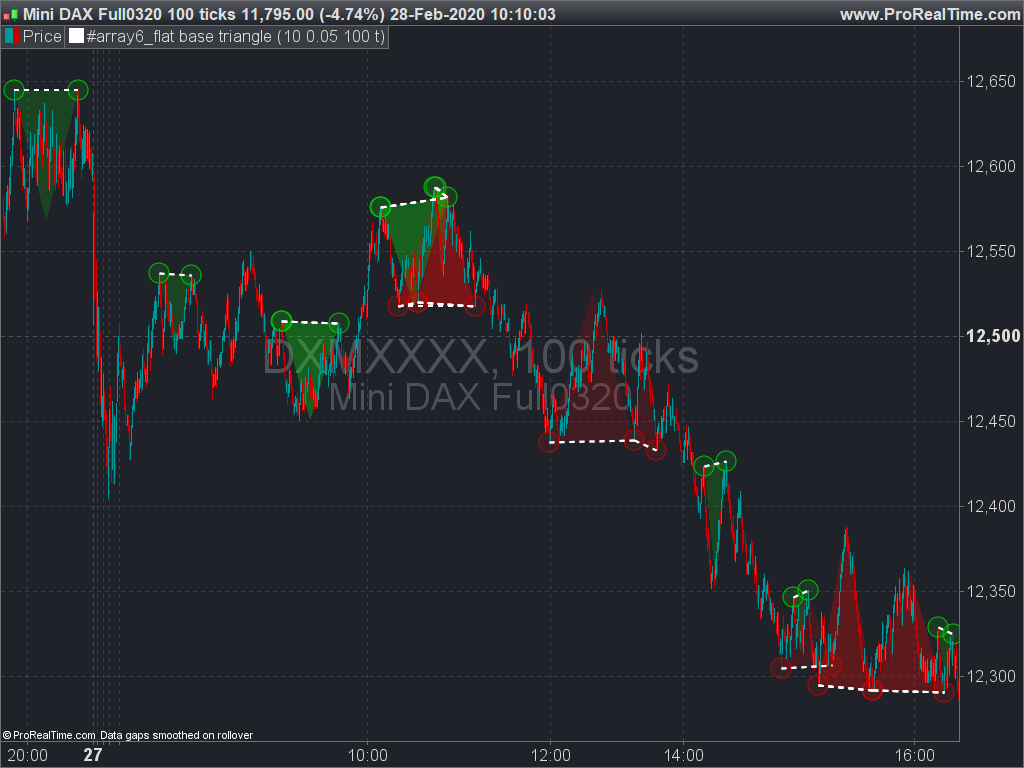
Example #6: Flat base triangle aka double top/bottom
This example is using the similar framework than in the first one, by storing the tops and bottoms fractals we can easily find some graphical patterns in the chart. The code is looking 2 recent points (tops or bottoms, peaks or valleys), check if they are almost flat (price change percent less than the percent setting), draw a segment between the 2 points. Then it finds the lowest or highest price between the twos and draw the flat base triangle. Note that the 3rd point of the triangle is plotted at mid way between the 2 points of the base and not at the exact bar that created the highest or lowest.
This snippet could be modded/extended to many more interesting things, I count on you to give back some useful codes! 🙂
// https://www.prorealcode.com/topic/array-variables-availability-in-prorealtime/
// (please do not remove the link above for future reference)
// Example #6: flat base triangle or double top/bottom
defparam drawonlastbaronly=true

// --- settings
fractalP = 10 //fractal period
percent = 0.05 //maximum percent change between the 2 points
barlimit = 100 //maximum bars between 2 points
showTriangle = 1 //show the triangle between the 2 points (1=yes,0=no)
// --- end of settings

//fractals
cp=fractalP
if high[cp] >= highest[(cp)*2+1](high) then //new fractal high found
 $TOPy[lastset($TOPy)+1] = high[cp] //store fractal value
 $TOPx[lastset($TOPx)+1] = barindex[cp] //store fractal barindex
endif

if low[cp] <= lowest[(cp)*2+1](low)  then //new fractal low found
 $BOTy[lastset($BOTy)+1] = low[cp] //store fractal value
 $BOTx[lastset($BOTx)+1] = barindex[cp] //stire fractal barindex
endif

if(islastbarupdate and isset($topy[0]) and isset($boty[0])) then
 //check points in a range of X percent
 for i = 0 to lastset($TOPy) do //loop through the tops
  for y = 0 to lastset($TOPy) do //check first top with other tops
   change=abs(($topy[y]-$topy[i])/$topy[i]) //percent range between the 2 tops
   bardiff=abs($TOPx[i]-$TOPx[y]) //how many bars between the 2 points?
   if change<=percent/100 and bardiff<barlimit and bardiff>=fractalP and $topx[i]<>$topx[y] then
    //plot points at each top
    DRAWPOINT($topx[i],$topy[i],5) COLOURED (0,255,0,25) BORDERCOLOR (0,200,0)
    DRAWPOINT($topx[y],$topy[y],5) COLOURED (0,255,0,25) BORDERCOLOR (0,200,0)
    //plot the flat base
    drawsegment($topx[i],$topy[i],$topx[y],$topy[y]) style(dottedline,2)
    if(showTriangle) then
     //find the lowest point between the 2 tops
     ll = lowest[bardiff](low)[barindex-max($topx[i],$topx[y])]
     //plot the triangle
     drawtriangle($topx[i],$topy[i],$topx[y],$topy[y],max($topx[i],$topx[y])-bardiff/2,ll) COLOURED (0,255,0,20) BORDERCOLOR (0,200,0,0)
    endif
   endif
  next
 next
 for i = 0 to lastset($BOTy) do //loop through the bottoms
  for y = 0 to lastset($BOTy) do //check first bottom with other bottoms
   change=abs(($boty[y]-$boty[i])/$boty[i]) //percent range between the 2 bottoms
   bardiff=abs($botx[i]-$botx[y]) //how many bars between the 2 points?
   if change<=percent/100 and bardiff<barlimit and bardiff>=fractalP and $BOTx[i]<>$BOTx[y] then
    //plot points at each bottom
    DRAWPOINT($botx[i],$boty[i],5) COLOURED (255,0,0,25) BORDERCOLOR (200,0,0)
    DRAWPOINT($botx[y],$boty[y],5) COLOURED (255,0,0,25) BORDERCOLOR (200,0,0)
    //plot the flat base
    drawsegment($botx[i],$boty[i],$botx[y],$boty[y]) style(dottedline,2)
    if(showTriangle) then
     //find the lowest point between the 2 tops
     hh = highest[bardiff](high)[barindex-max($botx[i],$botx[y])]
     //plot the triangle
     drawtriangle($botx[i],$boty[i],$botx[y],$boty[y],max($botx[i],$botx[y])-bardiff/2,hh) COLOURED (255,0,0,20) BORDERCOLOR (200,0,0,0)
    endif
   endif
  next
 next
endif

return