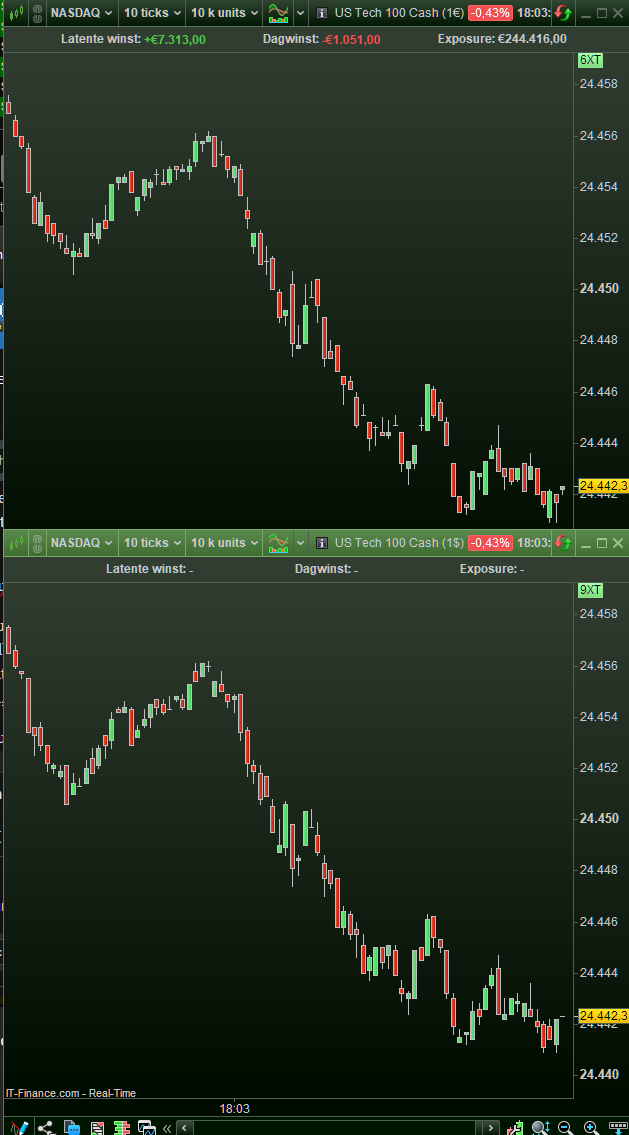
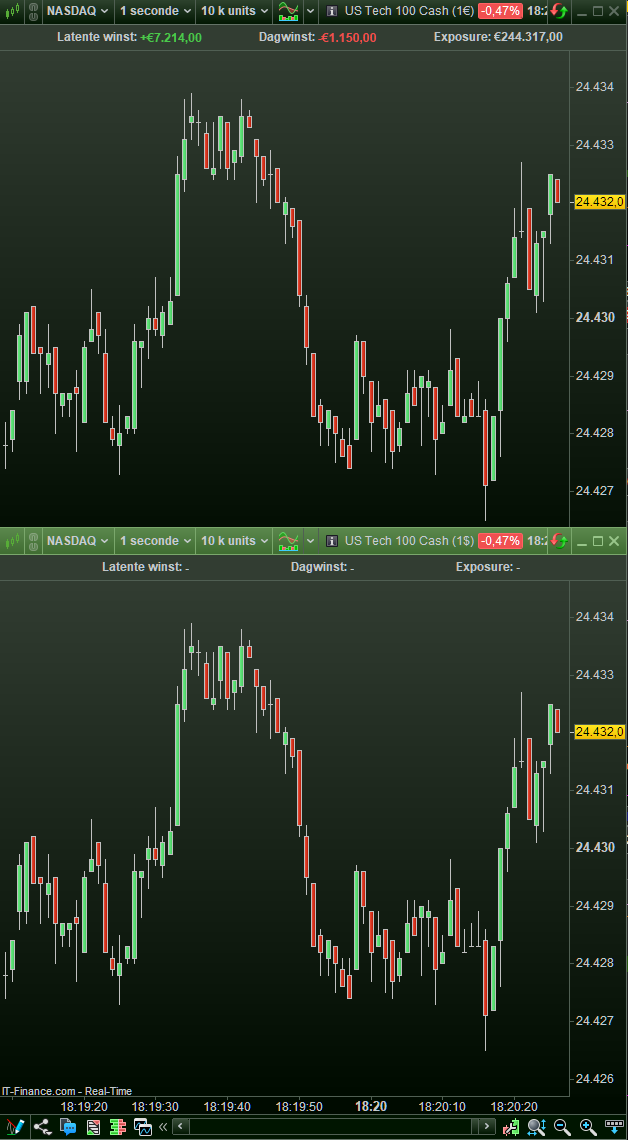
Doesn’t look the same to me… do they ever say the same?
 JS
JSParticipant
Veteran
The differences between the euro and dollar chart arise because the dollar chart reflects the original USD feed, while the euro chart is recalculated by IG tick by tick into euros…
This additional FX conversion step (EUR/USD) can change the bar structure (highs/lows, wicks, number of candles) as seen in the tick charts…
The effect may vary, it mainly depends on how much the exchange rate moves relative to the index…
The differences between the euro and dollar chart arise because the dollar chart reflects the original USD feed, while the euro chart is recalculated by IG tick by tick into euros…
Is dit nou een welles-nietes spelletje of zo ? 🙂
Can’t you just reason what is happening ? I did my part on it.
FACT is : the whole day I again have been watching these both charts, up till somewhere this afternoon. And suddenly now, when I watch again after reading your post, they are different indeed ??
Anyway, nothing is recalculated in euros because euros don’t show anywhere. Or do you see them ? then show us.
… But I think I see something else now. See in the 2nd attachment. This is a 1 tick chart and it mighty much looks the same throughout. The 10 ticks chart do not at all (any more). They show gaps at random places. So the forming of the bars does work out the same on the both charts. I have seen a case (I think on IG) that the averages don’t match up. That would count for my first screenshot too. But not at the real tick level (2nd screenshot).
The 3rd screenshot bears a TF of 1 second. I again see differences there (see towards the end).
So something is not right in the realm of counting ticks consistently for both “streams” which are not two streams at all.
It feels like aggregated data because it looks like aggregated data (like IB’s data stream does that severely). But in this case not at the 1 tick level, or at least not with an exhibited difference between the two. Bars of 2 ticks already show the difference clearly. What also clearly shows is the one chart updating after the other. With 1 tick both update exactly equal (for what I can see and at the highest speed-setting of the stream).
Stupid stuff ! (until I understand)
Je ne trouve pas le produit « Or au comptant (contrat 1 €) » en France dans la liste PRT : savez-vous pourquoi ? Il est sur IG, mais j’ai des positions manuelles dessus.
The differences between the euro and dollar chart arise because the dollar chart reflects the original USD feed, while the euro chart is recalculated by IG tick by tick into euros…
This additional FX conversion step (EUR/USD) can change the bar structure (highs/lows, wicks, number of candles) as seen in the tick charts…
The effect may vary, it mainly depends on how much the exchange rate moves relative to the index…
If any ratio between EUR and USD were applied, there would be a price difference. But there is none, both are identical. Seems very odd to me.
JSParticipant
Veteran
What I see is that the last USD tick is converted into euros (EUR = USD_last × EUR/USD) and then used in the EUR chart…
As a result, the bar structure (high/low, wicks, number of candles) may differ from the USD chart…
Thanks to this conversion, your EUR account (profit, cash, exposure) can be read in real time in euros…
The last displayed index level (in points) is the same on both charts, so the index points do not differ…
Update on the spread “problem”
Hello everyone,
We have listed the instruments affected by this spread discrepancy and shared them with IG. According to IG, this situation is intentional: different instruments have been created in order to give them more control over spreads, depending on the division or country. This is the result of their recent modifications, not a technical error.
OK, but it is strange that the spread of the DAX 1 € changed only in PRT, and not in the usual contract loaded on IG’s website. The reason is that they have introduced one additional 1 € contract with higher spread, which appeared automatically on PRT (in exchange for the old contract), but on IG’s website, the old contract remained open. This is not good business behavior, I think. They should have notified clients, not simply exchange something here on PRT, but not on their own website.
 Wim
WimParticipant
Average
In France you now have the choice between DAX €1 at 1.8 spread and DAX €5 at spread 1.4. What fun, the latter can be taken with lot size 0.2 ! No one needs the DAX €1 any more.
Do you not have this contract ?
https://deal.ig.com/web-platform/#/tearoff/market/IX.D.DAX.IDE.IP
This is DAX 1 € with spread 1.4 and minimum size 0.2. It is also on my PRT, when I search for DAX 1 €.
WimParticipant
Average
Nope, I only get this one in France, having also a spread of 1.8 on IG’s own web platform:
https://deal.ig.com/web-platform/#/tearoff/market/IX.D.DAX.IFMM.IP
And a special “Weekend” version with a huge spread of 25, no link produced there however.
When I tap your link, I get the instrument info, but no bars on the chart, so no data for me in France on your DAX version.
Update on the spread “problem”
Hello everyone,
We have listed the instruments affected by this spread discrepancy and shared them with IG. According to IG, this situation is intentional: different instruments have been created in order to give them more control over spreads, depending on the division or country. This is the result of their recent modifications, not a technical error.
thanks Nicolas for the clarification …. finally we know what the whole IG mess was about ! BTW why does the NASDAQ (€1) and NASDAQ ($1) , and the other US indices as well, show the same quote? Shouldn’t it differ based on EURUSD price ?
BTW why does the NASDAQ (€1) and NASDAQ ($1) , and the other US indices as well, show the same quote? Shouldn’t it differ based on EURUSD price ?
Might not be an issue — NAS100 ($1) and NAS100 (€1) print the same ticks. Only diff is PnL: instead of 1€/pip it’s 1/1.16 (or whatever EURUSD’s trading at). I’ll check it later.
JSParticipant
Veteran
Note on Spread:
When you use the “spread” setting in the backtest module, the spread is split between the entry and the exit of a trade…
Half of the spread is applied at the opening of a position and the other half at the closing…
In live trading, however, the full spread is charged immediately at the entry…
This difference in calculation can have a significant impact, especially on scalping systems and intraday systems on lower (faster) timeframes, where the spread is relatively large compared to the target or stop…
No, no. In live trading, the ask price is charged at the opening of a long position, which is the average price shown in the chart + spread/2. When you sell this position, you get the bid price, which is average price – spread/2.