Just try any code.
// Conditions to enter long positions
YourConditions = time = 160000
YourConditions2 = time = 190000
IF NOT LongOnMarket AND YourConditions THEN
BUY 1 CONTRACTS AT MARKET
ENDIF
if YourConditions2 then
sell at market
endif
And check 1€ vs 1$
Look here. same system, same timeframe, same market except 1€ vs 1$. Two different results.
Should be very normal, because $ is not the same as €, and their ratio changes over time…
I made comparison test between demo and live too, and the results are not identical. The number of trades varies and the entry days are completely different. Therefor I don´t start the systems on Nasdaq in live.
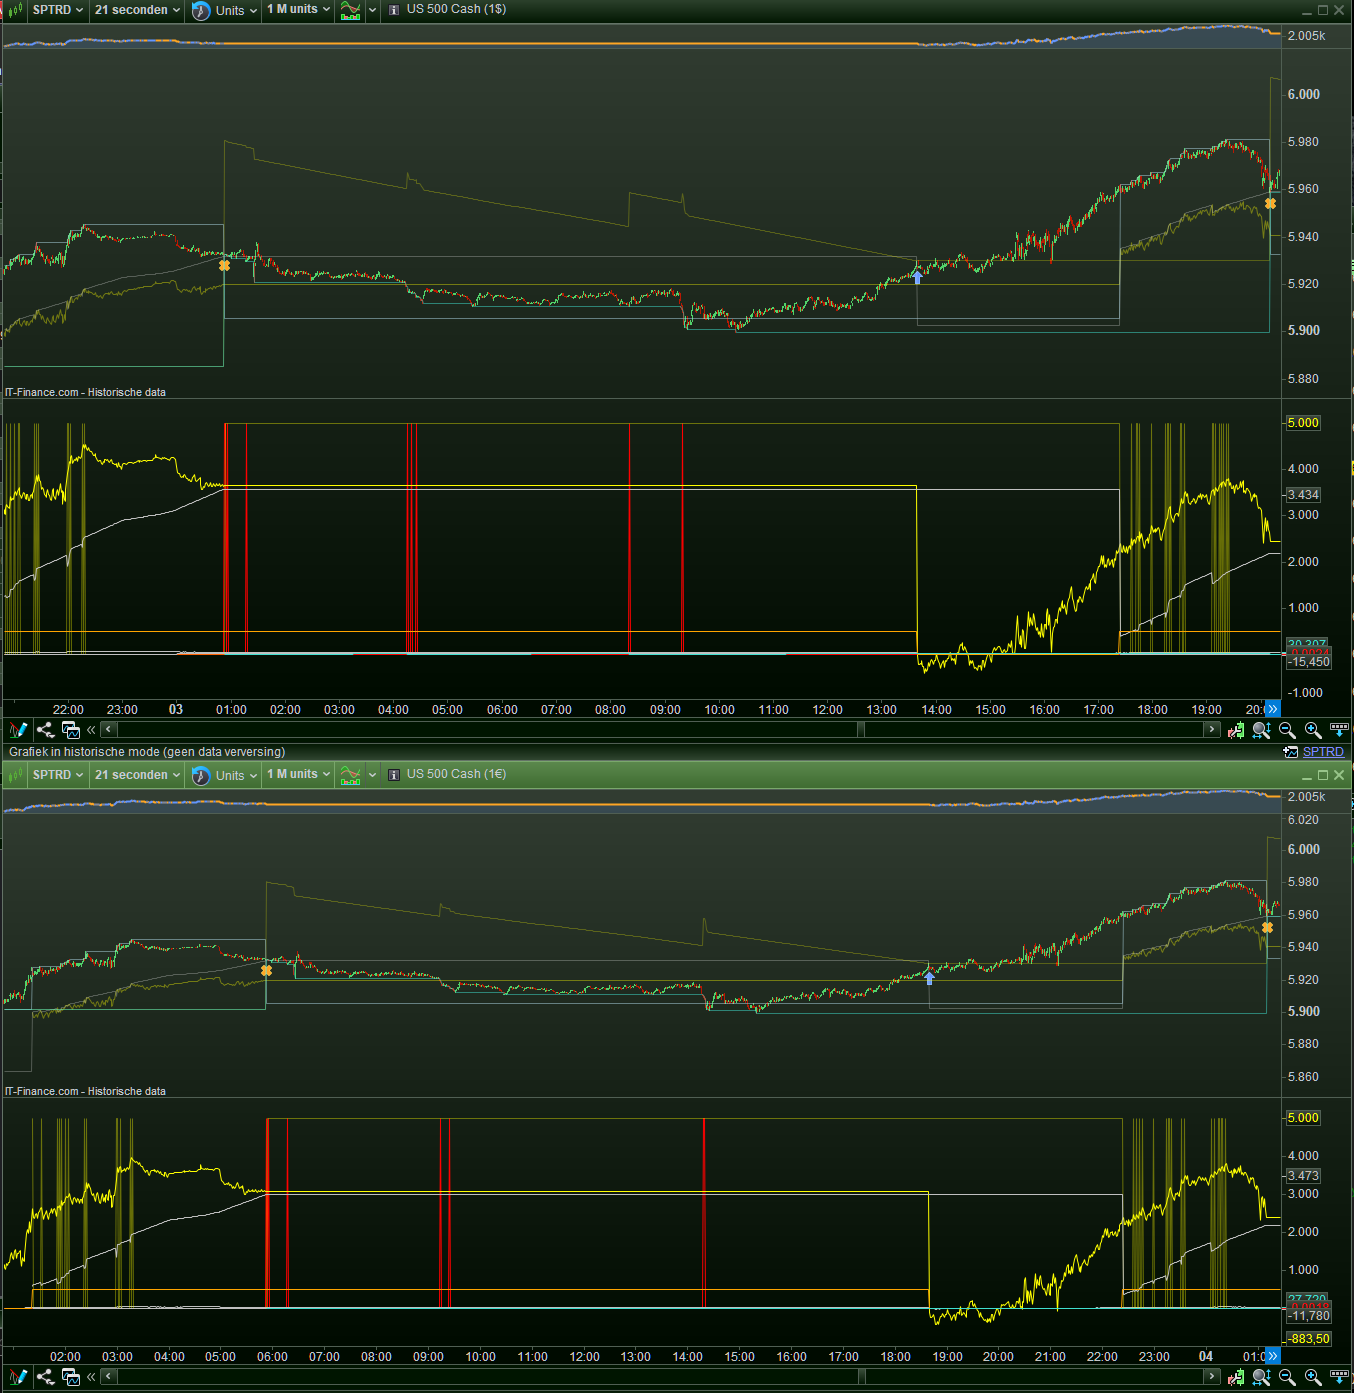
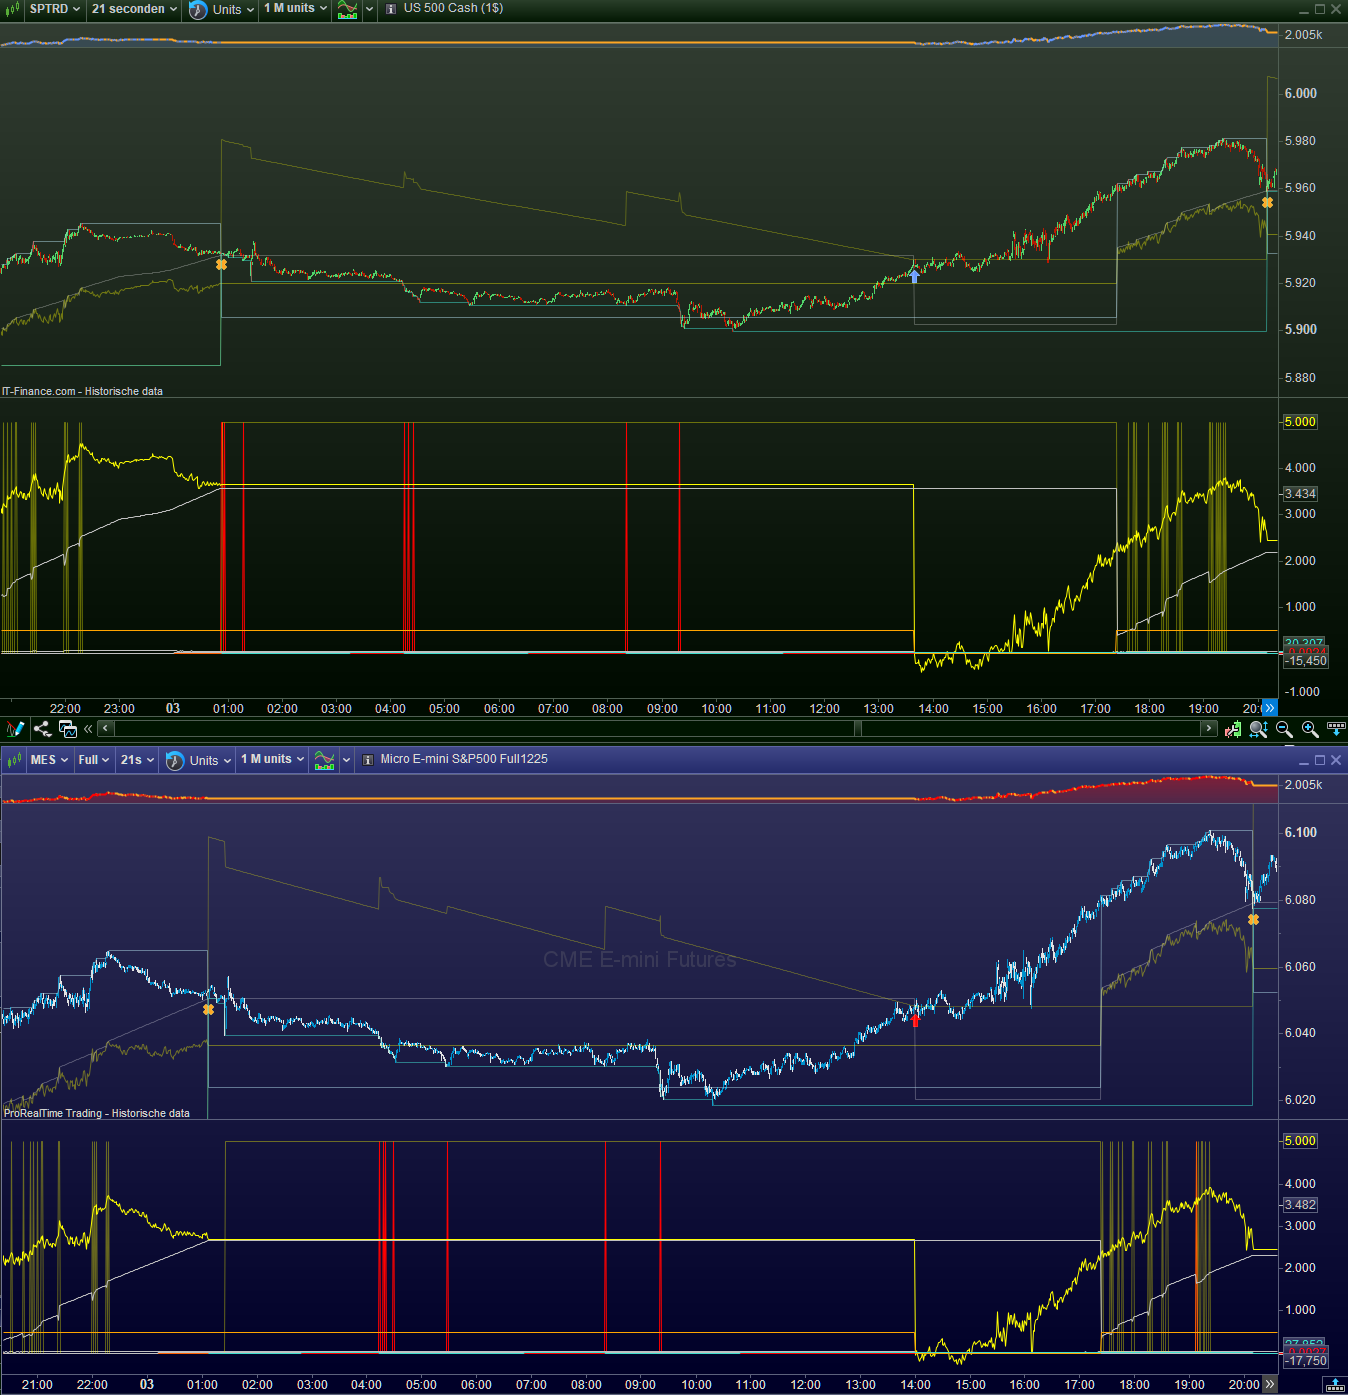
You are correct. And the cause is : the time has been shifted 4 hours between the two. Apologies for all the graphing in there, but it was necessary to find “anchors” for the both and what’s happening. In first attachment, top chart is the 1$, bottom is 1€.
This will be the same 4 hours shift that occurred 2 weeks ago (I think on Monday – I posted about it).
I can’t tell which is the correct one, with btw the notice that both are from formal history in PRT (1M bars).
Oh wait, I think I can see that the 1$ has to be wrong, because it produces normal (?) prices from 22:00 till 01:00 (and further). … … But no, that conclusion is wrong because
- During each of the subsequent hours normal prices seem to be presented;
- which occurs in both charts for $ and €.
OK, so we drag in an other too : PRT-IB. See the blue chart in the 2nd attachment.
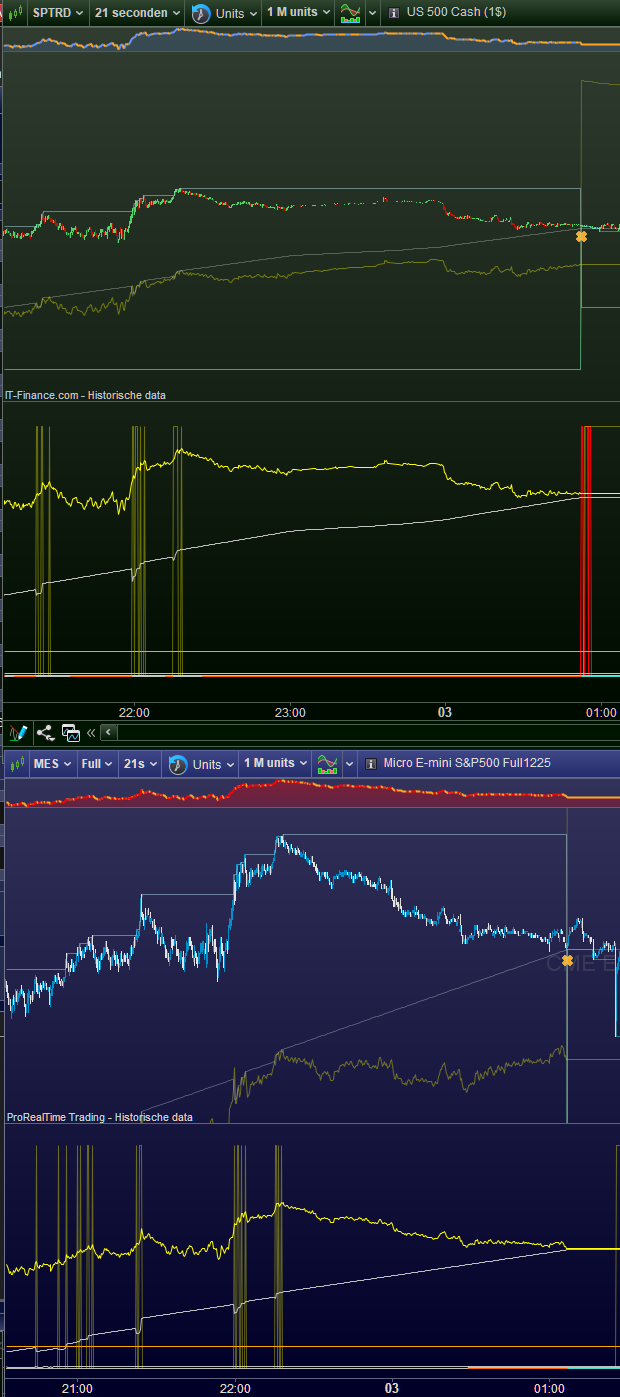
This shows that the $ version is the correct one. One small issue : you see the time in the IB chart going from 22:00 to 03 (this is Amsterdam time) which in the green IG chart is going from 22:00 to 23:00 to 03, which cannot be. I don’t know how others think about this, but I would expect zero volatility during that period of time for IG. Thus, we zoom in somewhat on that time-position. And indeed (3rd attachment), that all looks normal.
Update on IG instrument migration issue
The current work we are doing to resolve the situation is still focused on the same underlying problem created by IG from the start. All the issues that may seem “new” are in fact only side effects of IG’s initial action of changing instruments. Resolving them takes time, considering the thousands of clients who have been affected. We understand how frustrating this is, and please know that we are also working over the weekend to fix the mess — even though we are not responsible for it.
Latest progress
-
IG corrected its instrument set and market access over the weekend. We spent several hours on Saturday and Sunday checking their status.
-
Additional fixes are still ongoing (instrument timezone…!)
-
Following the weekend corrections, we started migrating:
-
order history
-
position history
-
stopped strategies
-
We are also correcting rankings (Palmarès) and screeners.
This work will still take several more days before everything is fully stabilized.
Thank you for your patience and understanding.
DAX 1 € spread is now 1.8 on PRT, but 1.4 at IG. What price do you really get, when you press the buy button ? The one shown on PRT or IG’s price (0.2 less) at the same time ??
Here’s a short test code on the SP500 to illustrate the problem… The day ends with this code at 7:00 AM, while with MTF the day ends at 6:00 AM. However, the day should end at 1:00 AM, at least that’s how it’s always been. Or am I missing something? Is this also what PRT is working on?
In
this post (251260) I laid out how the data for the US 500 (S&P 500) 1$ vs 1€ carried a time difference (a shift) of 4 hours;
Yesterday end of the day PRT told me that a lot of work had been done since the weekend and whether I could look if all was OK for me now. Well, I don’t see a difference anywhere (still an empty ProOrder and still no history of orders), so I thought to dive into the data again, like I did in the post I referred to above.
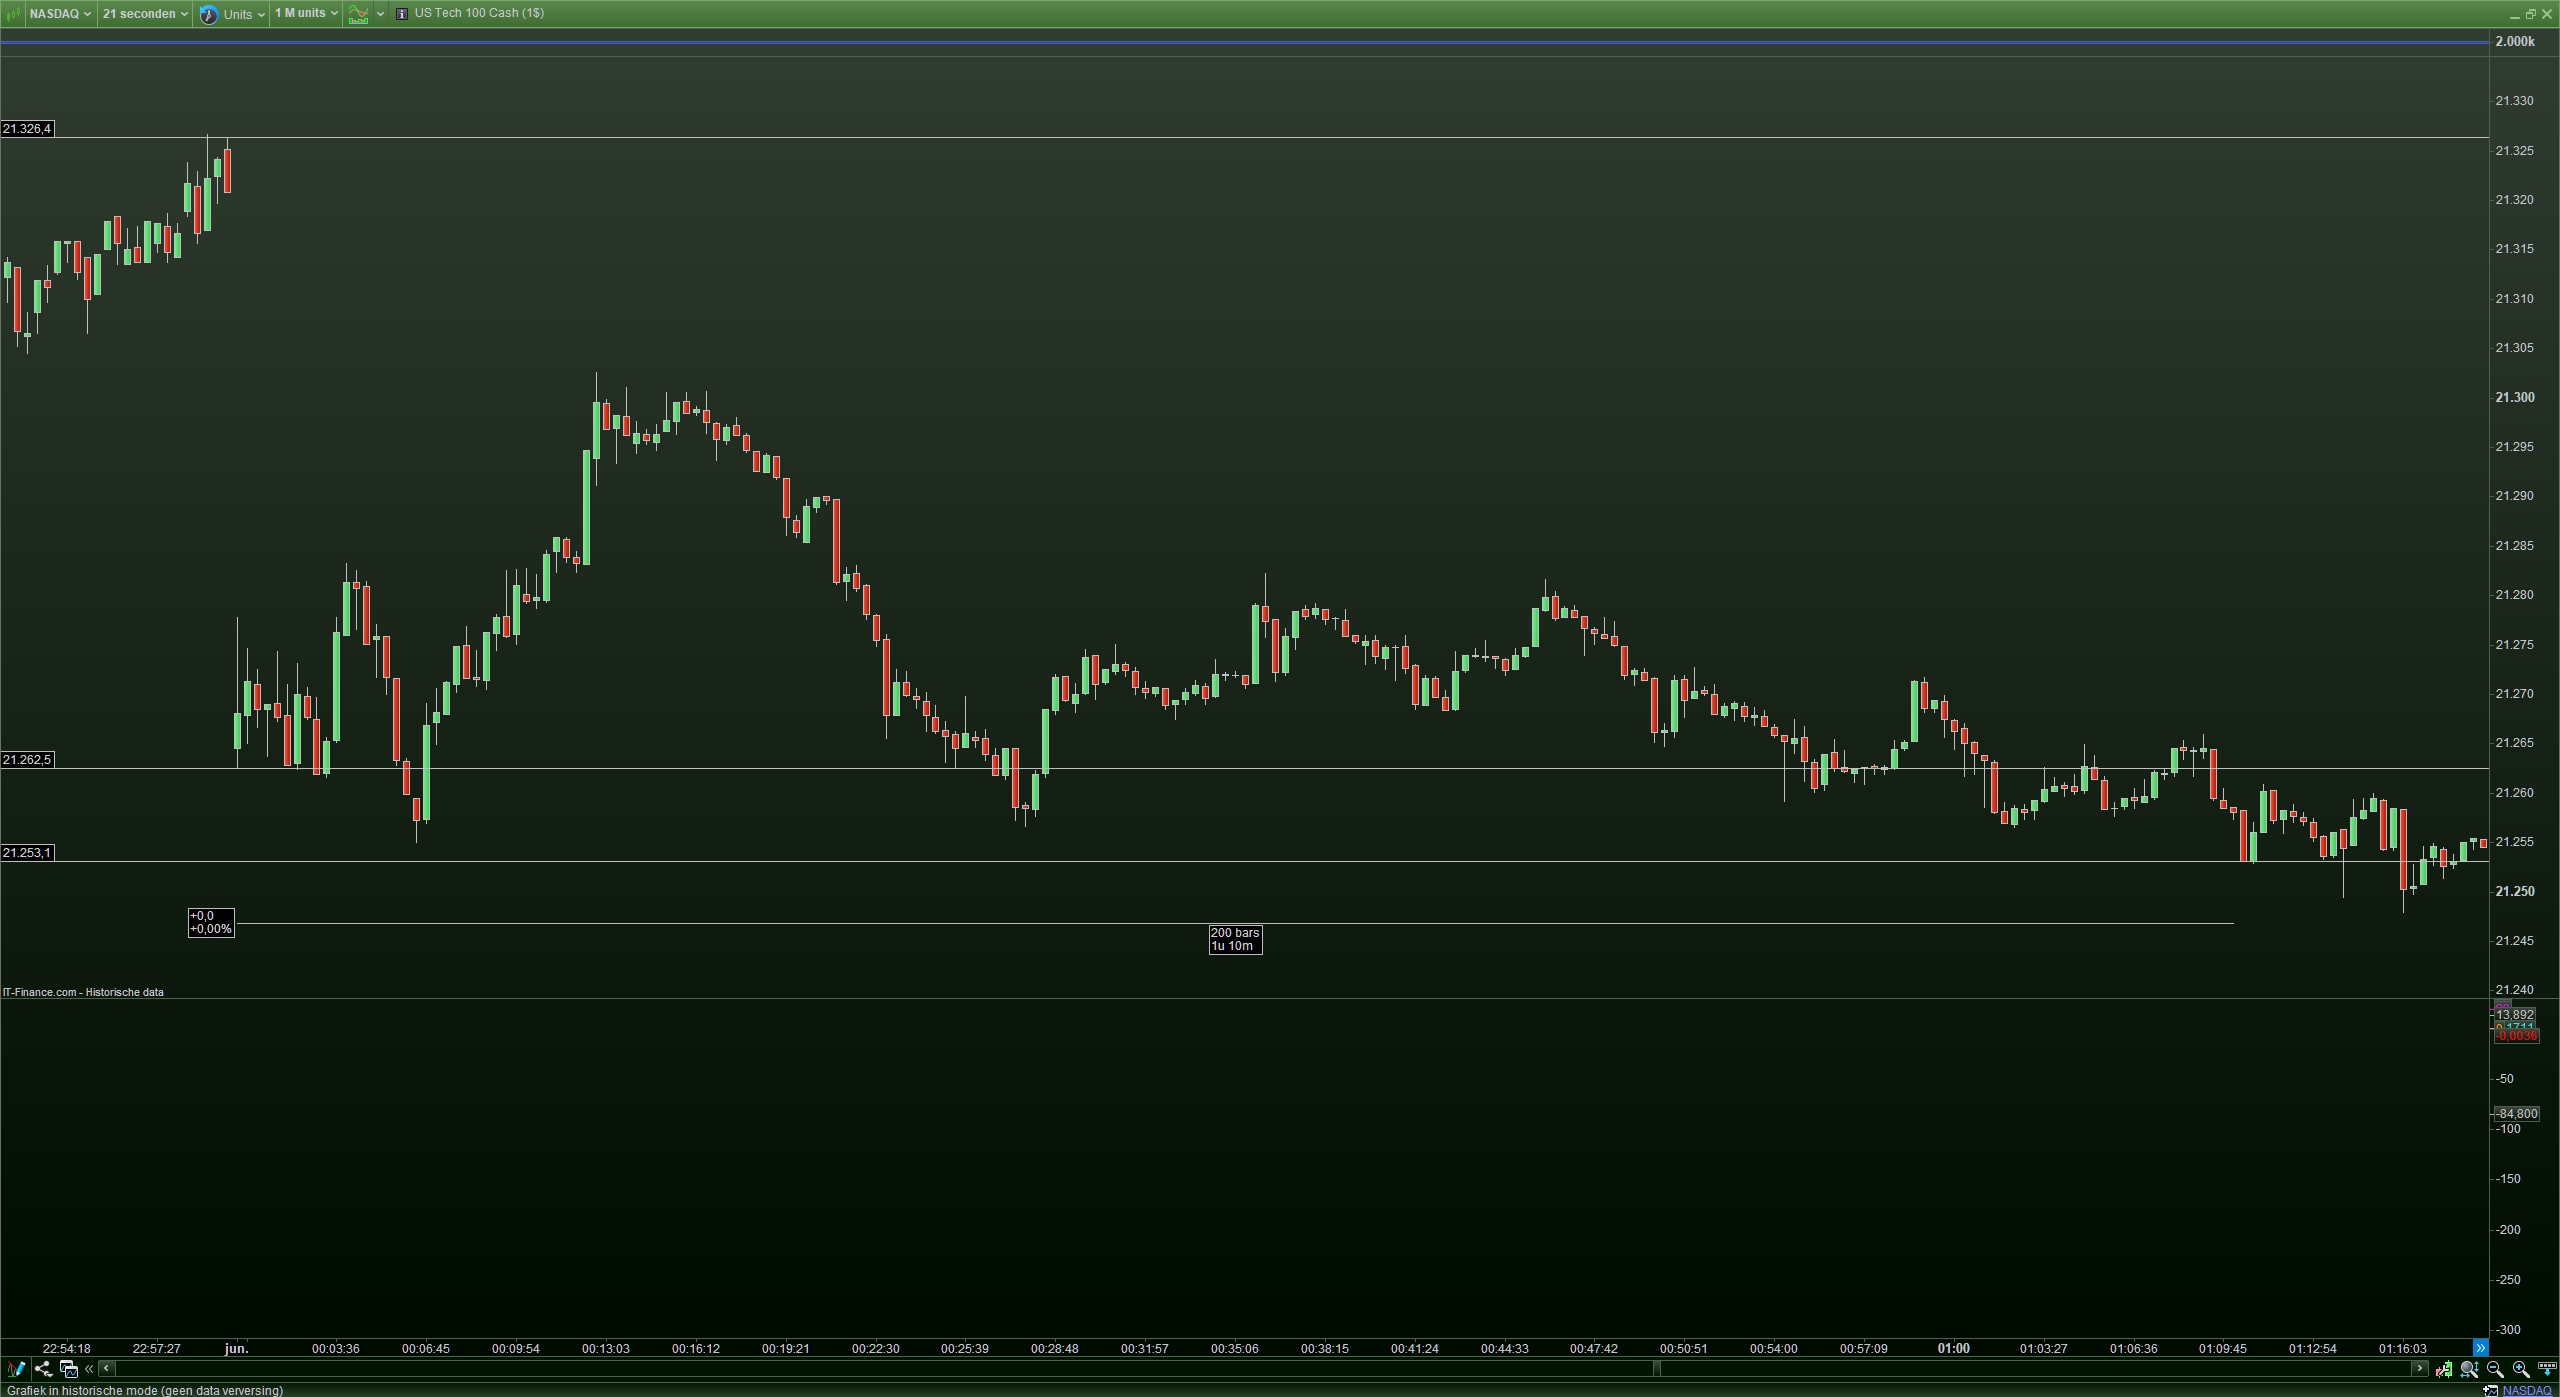
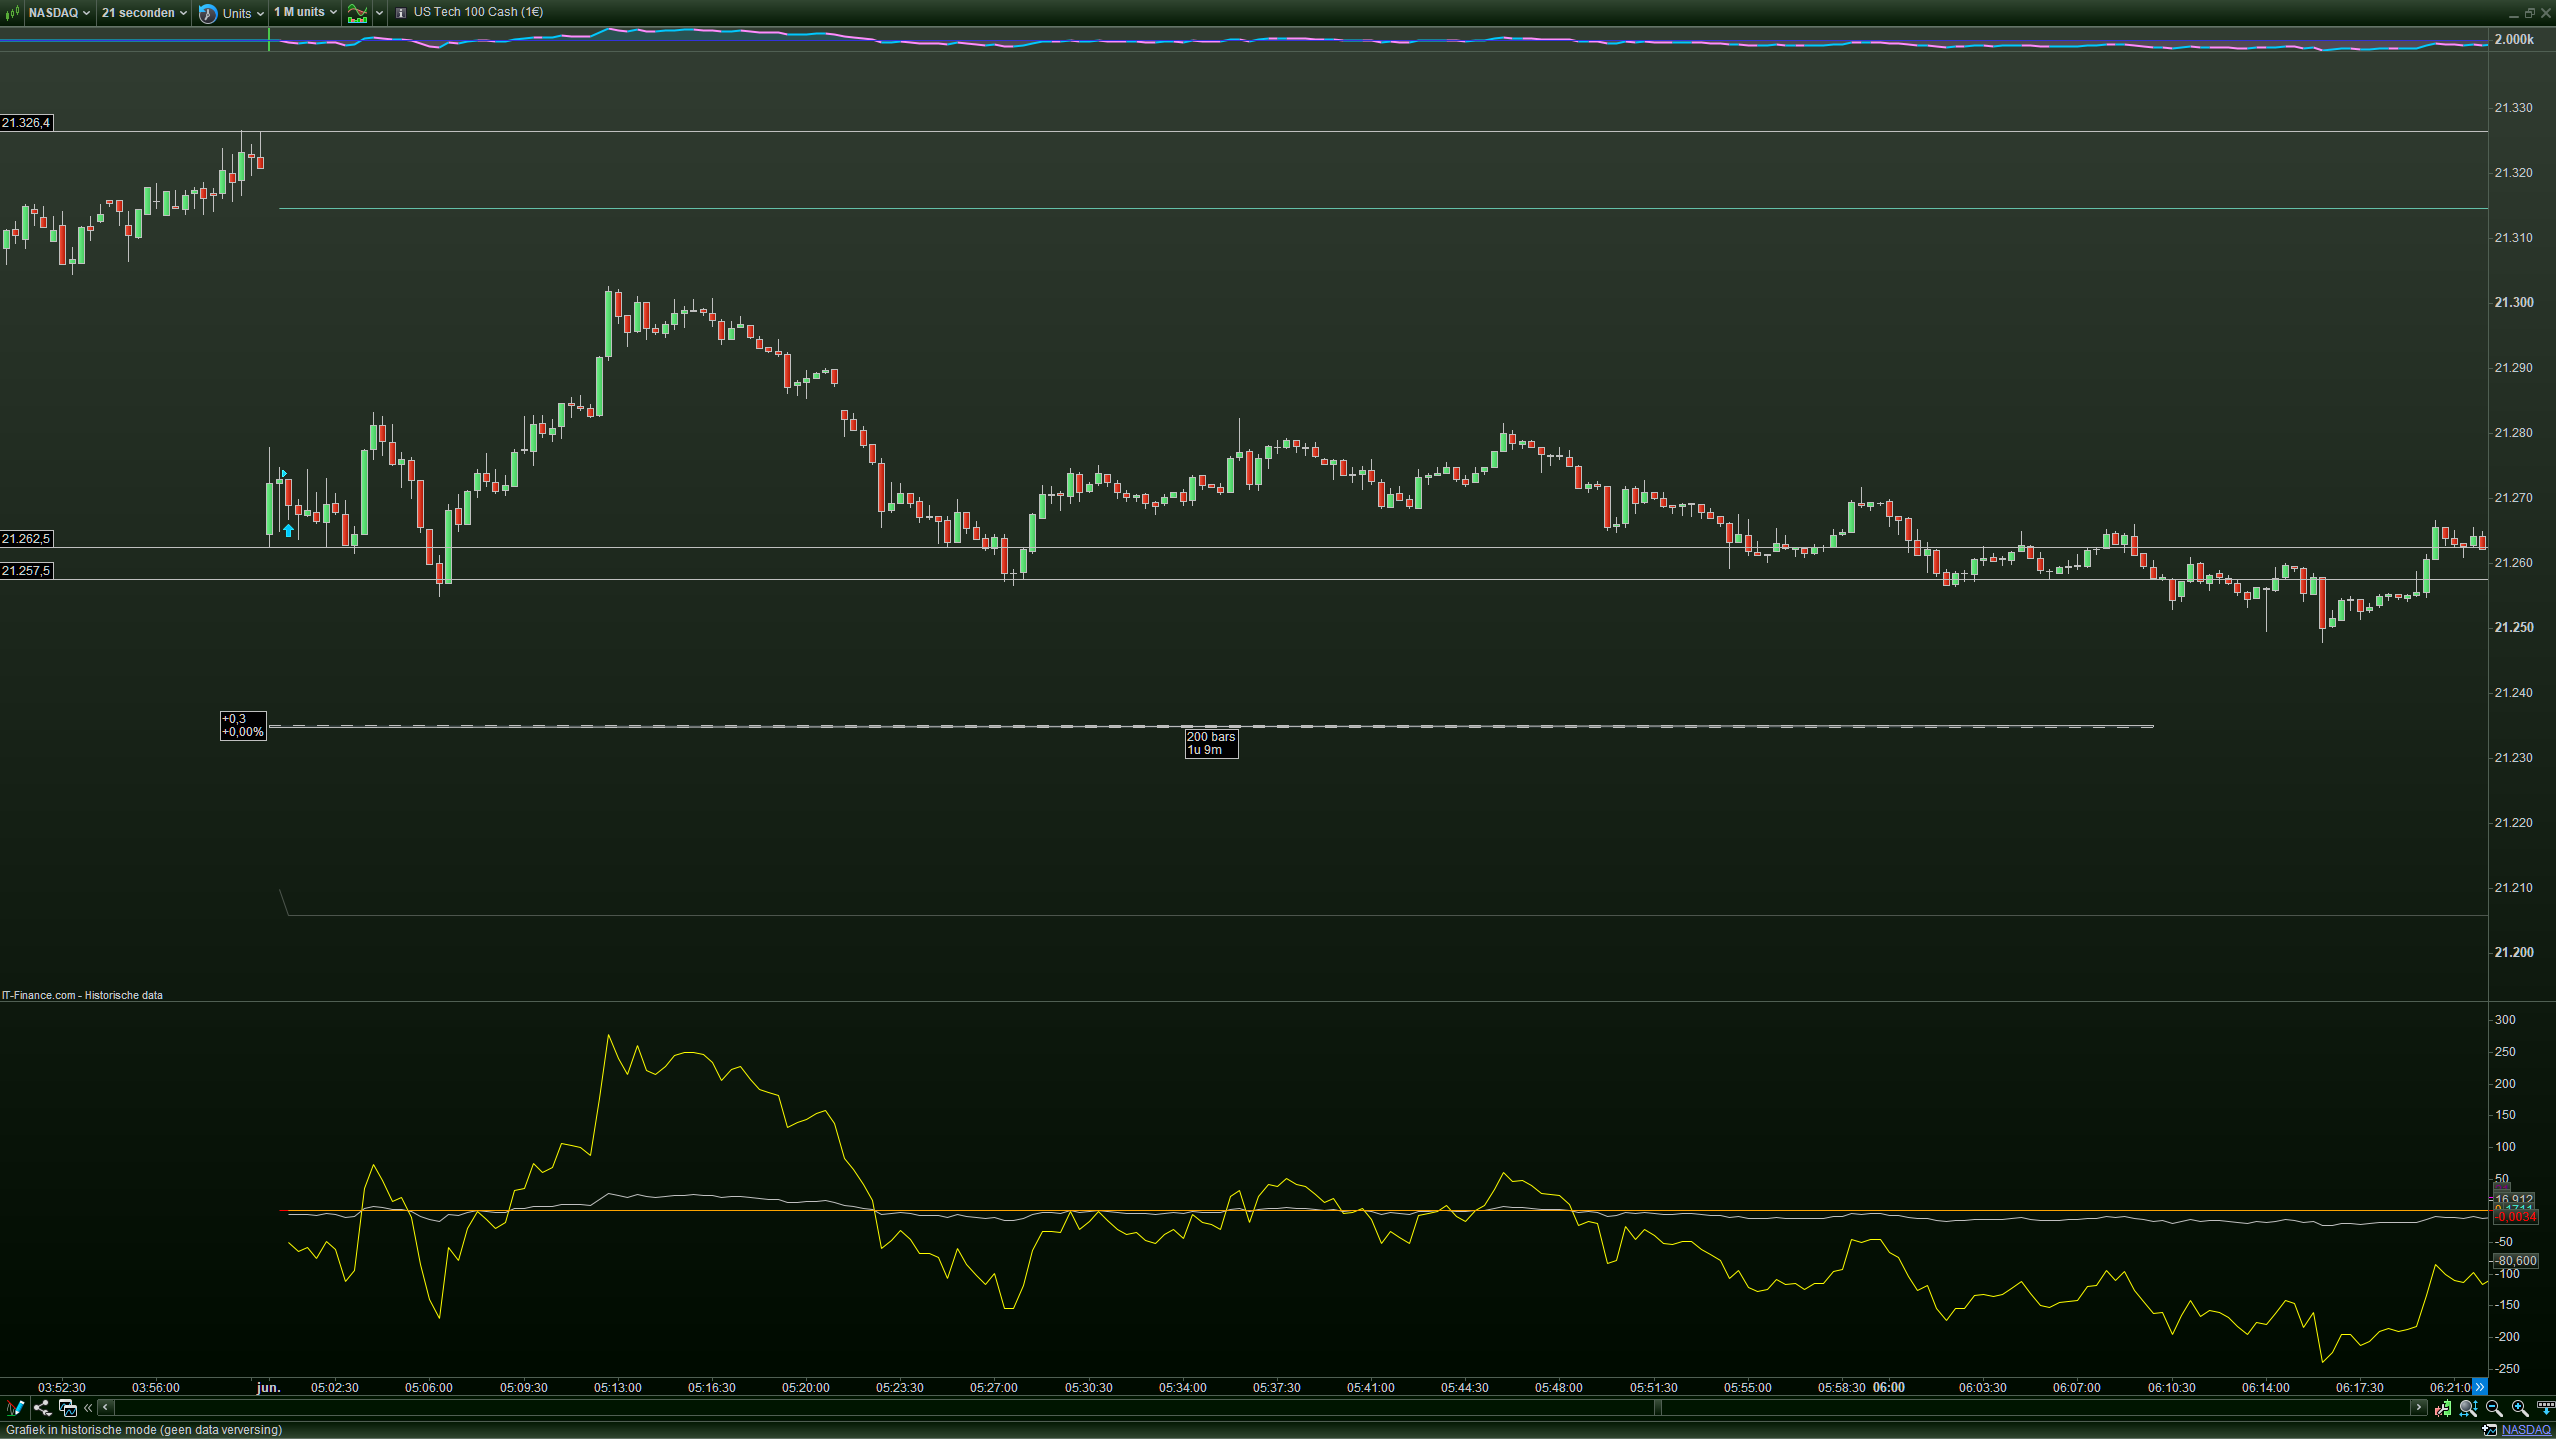
Abusively I now used the US Tech 100 (NASDAQ) for the comparison, and after an hour of aligning things I saw my mistake. Actually this mistake is convenient because it now see different things wrong. With apologies for the large screen shots (best to open them in a new window or at least tab), this is what I now observe :
1st is the $, 2nd is the €. The date is again June 3 (actually randomly chosen, but my backtesting starts there and it helps to align the charts).
The difference (shift in time) is now
5 hours.
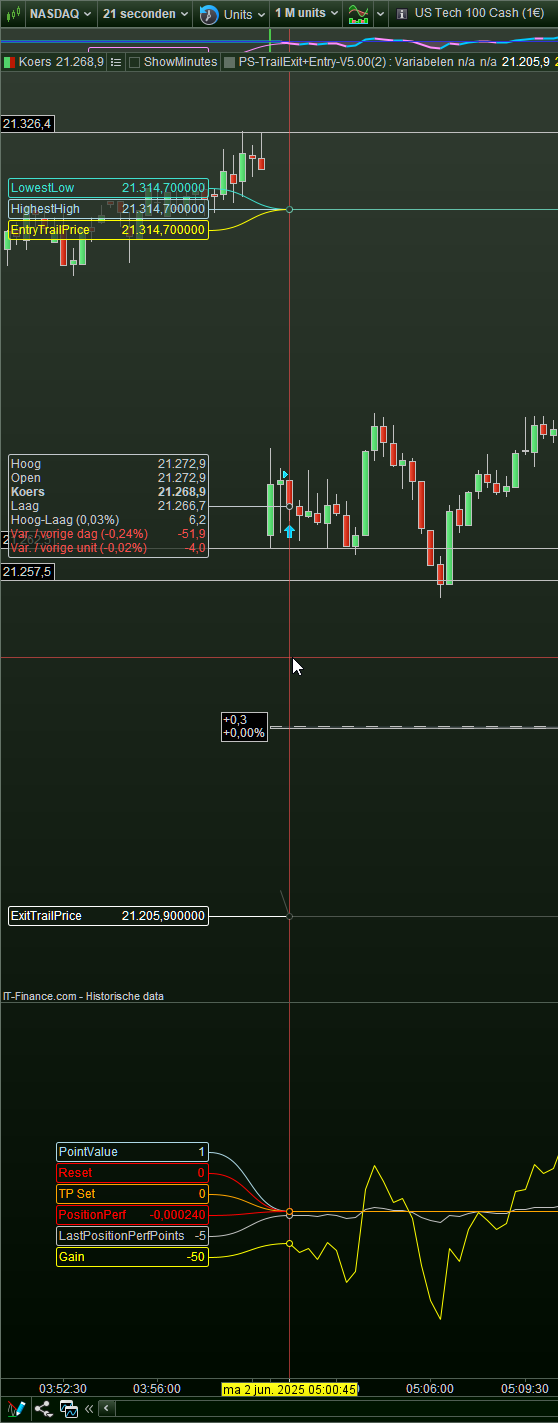
I put in some lines that denote the starting point of trading of the day, related to the price. This shows that the last price of the previous day and the first price of the new day align 100% (21.326,4 and 21.262,5 respectively).
Then I put a ruler to measure 200 bars, so I would know what prices to compare after 200 bars; this was necessary because the data does not look the same in the first place; when you’d have the two charts open in separate browser windows and “alt-tab” them, you can easily see how difficult it is to align all, just because it is not the same data. Or better said : how the data develops over time is not the same. Now :
There is something wrong with the time or timing in the first place, because the 200 bars differ a minute (please note that this is a rounded number so I can’t tell how many seconds it differs and if you look at the time scale in the bottom, you can already see a difference; somehow my 21s charts work out differently in both cases while I tried to zoom as precise as possible for both. That said, the prices do not develop the same at all and the $ bears a price of 21.253,1 after 200 bars, while the € shows 21.257,5.
I like to notice that at exchanges data for “seconds” streams is always different than for minutes and beyond. How this is at IG’s I don’t know. Anyway I am using seconds here (because 21), and my comparison could work out very different for minutes based charts. I mean, something is the most clearly wrong and where this is I can’t tell. Also, in the post I referred to I reasoned that the $ chart should be the correct one, while in this US Tech 100 case I reason it the other way around : the € data is the correct version because my backtest starts at 05:00 on June 2 which is in this case in order/correct for the € chart – see the 3rd attachment) – this system just dives in after 2x 21 seconds, so this should be about correct.
If we look at the individual bars we see that they are all different, as if they were from different instruments. But they are not, testified by the same ending and start price at the day boundary.
To me, but this is my subjective thinking, I see that at least one of them is (!) manipulated. Please note that this is different from “has been” manipulated because the latter can have been done to correct things. But this is thus not how I see it, and instead I see the continuous manipulation which is there for IG all the time (and which is normal for their internal operation which hedging and all), BUT now for the two currency versions in a different fashion.
What I can’t tell is whether this is going on like this always already. I mean, I have never looked at the data this way and I suppose for others this counts just the same.
Also, because the end/start prices align 100% – and without checking this I would be pretty sure that this is also the case for next day boundary and the next and the next and always, we can seriously wonder what we are looking at.
Anyway I can’t tell any more which of the two is correct, if any. I also can’t tell how this develops in real time. I mean, do we see the same differences when we observe real time price development ? Is the (backwards) backtest we will apply tomorrow representative for the data we see today in real time ? In the time span of about 1 hour and 15 minutes there’s a difference of 4 points between the two charts ??
Meanwhile I realize that I don’t grasp how a chart that works in $ vs a chart that works in € can ever show the same prices to begin with. Should the price not reflect the “currency” ? does anyone know ?
It was the first thing I looked at, a couple of days back and then took it for granted that the shown price “would be” the same. But maybe that is just the wrong assumption ? I reckon that people working with the $ chart(s), know this from experience ? But do people work with the $ charts ? I suppose people not from Europe might ? anyone ?
 JS
JSParticipant
Veteran
It is true that the euro chart is “manipulated” by IG; this is why you can indeed see differences in the chart structure compared to the dollar chart…
The reason is that IG receives the data feed from the US exchanges originally quoted in dollars (the correct/original feed), while many clients have euro accounts and want everything displayed in euros…
To achieve this, IG applies its own FX conversion on the euro chart…
As a result, differences appear compared to the dollar chart, most noticeable on very short timeframes (seconds)…
The dollar chart is therefore the original feed, while the euro chart is essentially the dollar chart with an IG FX conversion layer on top…
That would explain this difference, but it does not explain the time shift when a day ends and, above all, it does not explain the H4 candles that end on the wrong hour.
JSParticipant
Veteran
The “time-shift” indeed has nothing to do with this…
This “time-shift” is also corrected by PRT, as Nicolas pointed out…
As mentioned earlier, the “time-shift” is a result of the IG migration… (and will be corrected)
JSParticipant
Veteran
Latest progress
-
IG corrected its instrument set and market access over the weekend. We spent several hours on Saturday and Sunday checking their status.
-
Additional fixes are still ongoing (instrument timezone…!)
-
Following the weekend corrections, we started migrating:
-
order history
-
position history
-
stopped strategies
-
We are also correcting rankings (Palmarès) and screeners.
This work will still take several more days before everything is fully stabilized.
Thank you for your patience and understanding.
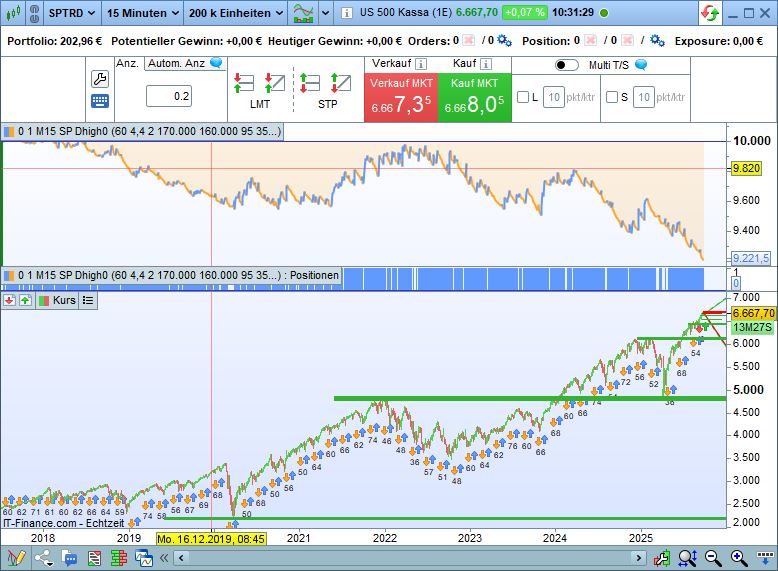
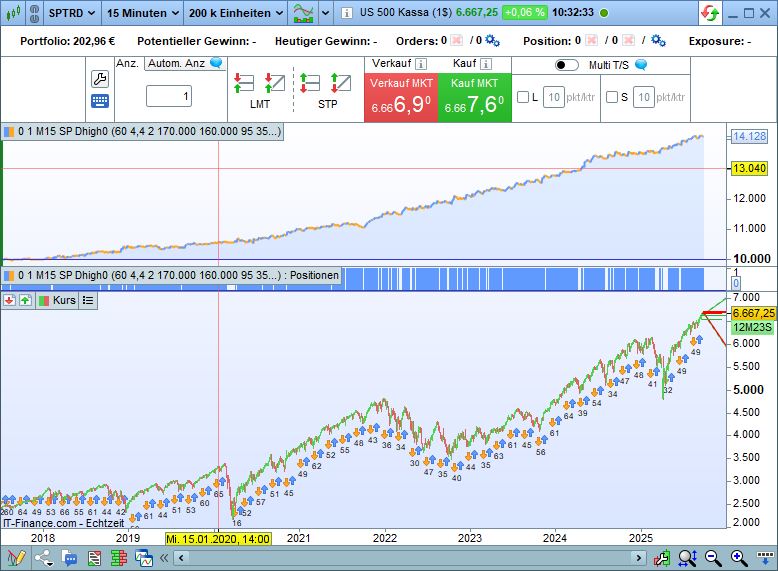
The thing with the IG FX conversion level just gave me pause… so I quickly tried it again. Here’s the SP500 M15 with the same algo, which locates highs and lows on an intraday basis and works with them. The €1 chart doesn’t work at all. The $1 chart looks exactly like what I’ve created. But the difference is stark, isn’t it? Like I said, the same algo!!!
I’ve now recapitalized the account (I withdrew everything last week just to be on the safe side) and started a few algos with a position size of 0.20. Just to be on the safe side.