Hello Nicolas, as you know PRT does not allow alert setting on standard error and standard deviation channels for which one solution could have been using your manual LR channels, however the actual PRT standard error and standard deviation channels do not match with your LR Channel. Do you have a code for these 2 dynamic channels starting from a fixed candle/ bar which will exactly match with standard PRT standard error and standard deviation channels please so that I can set the alert?
I have attached the images for your reference and your PRT code below please.
Many thanks.
//Parameters :
// Len = 127
// percent = 0.0016

//once j=0
de48=DPO[Len*2](close)
if de48=de48[1] and de48[1]=de48[2] and de48[2]<>de48[3] then
flag=1
endif

n=(Len*2)-4
p=(n/2)-1
d100=DPO[n](close)
moy100=close-d100
co=(moy100-moy100[1]+(close[p])/n)*n
if flag=1 and flag[1]=0 then
test=linearregression[Len](co)
test1=linearregressionslope[Len](co)
a=test1
b=test-test1*Len
endif

if flag=0 then
reg=a*j+b
upperchan = reg + reg*percent
lowerchan = reg - reg*percent
//reg=undefined
//upperchan=undefined
//lowerchan=undefined
else
j=j+1
reg=a*j+b
upperchan = reg + reg*percent
lowerchan = reg - reg*percent
endif

RETURN reg as "channel center", upperchan as "upper channel", lowerchan as "lower channel"
This code is not mine. I suggest you use this one instead: Standard Deviation & Standard Error Linear Regression Channel
I know that it moves with each new candle as it is based on period. We could change the code to start from a precise time/date in the past if this is what you want, just tell me.
Alert cannot be programmed, still, so you’ll have to use the alert tool from the platform, in any case.
Hello Nicholas,
You are really a good man, always ready to help others. Thank you so much for your fast and reliable response.
Thank you for the code, however it is not same as the standard ones available in PRT is/are not matching with that of your as captured in the image.
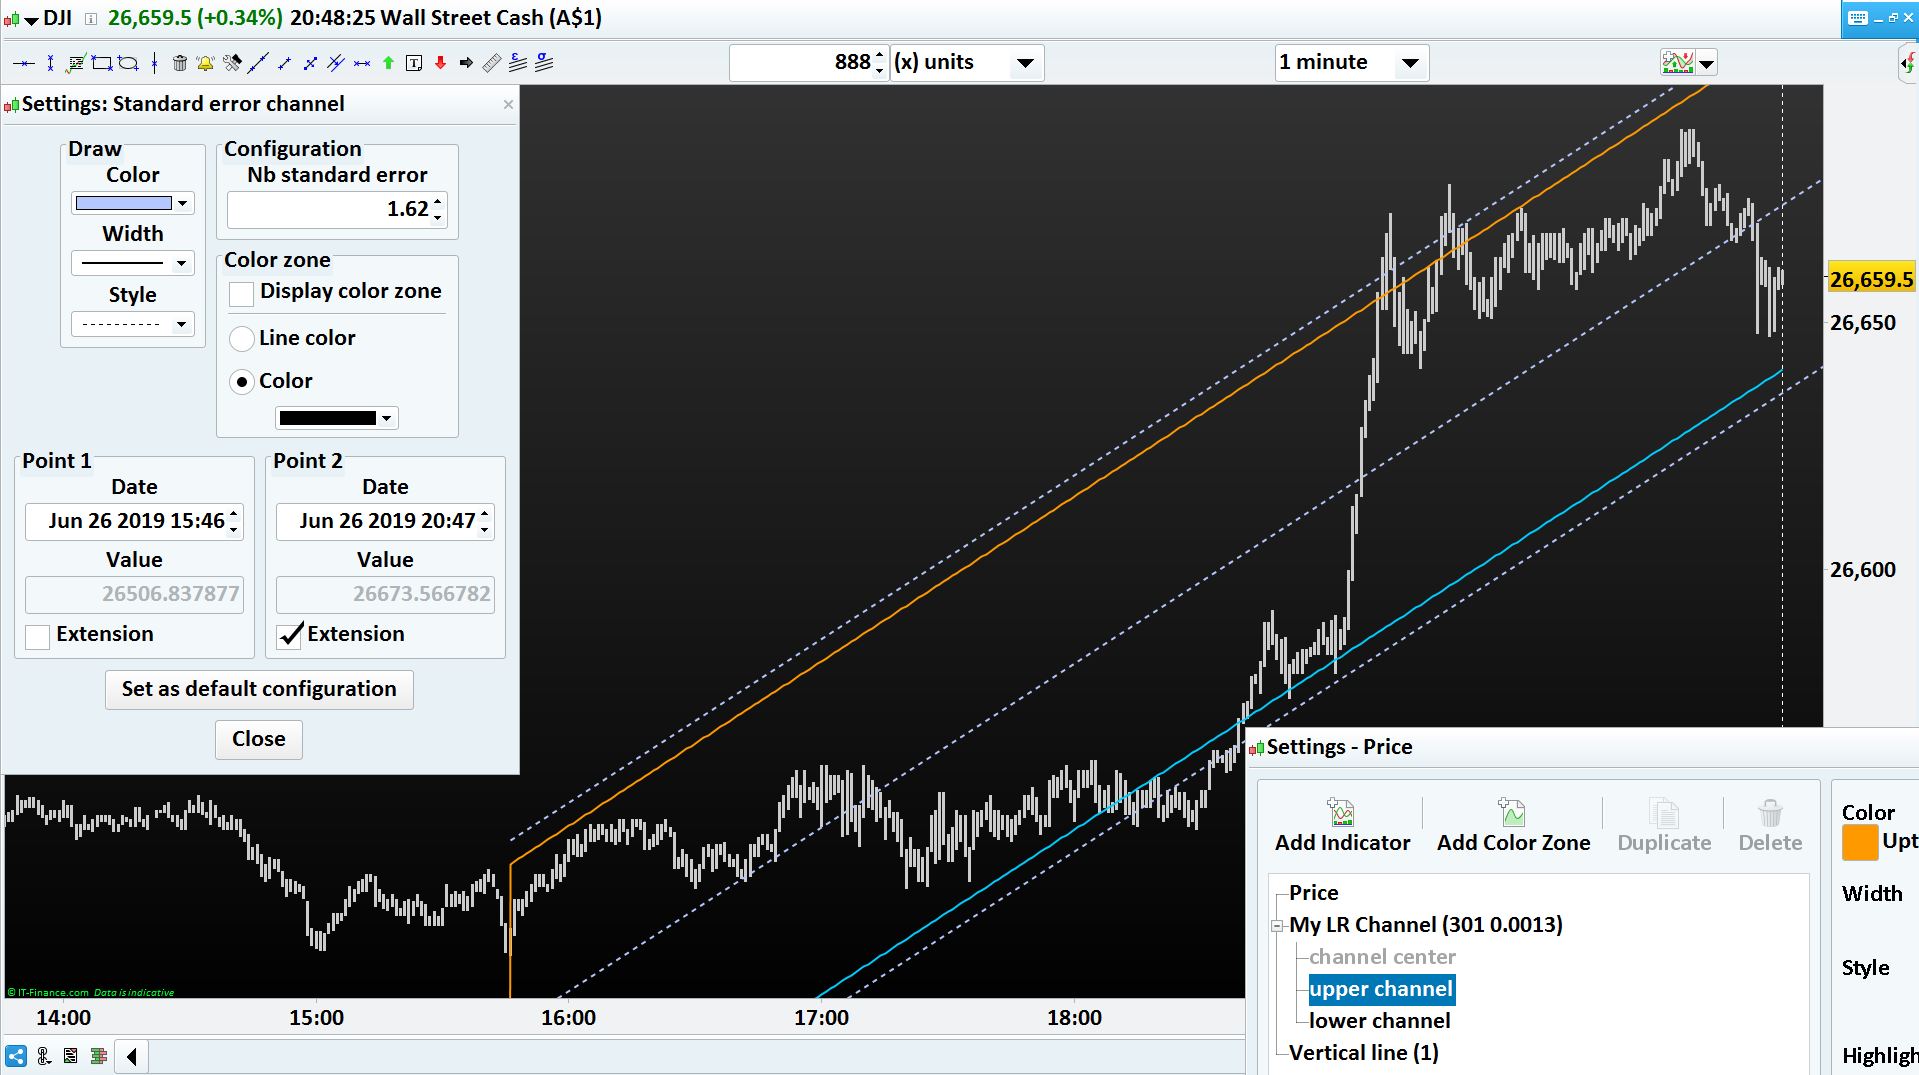
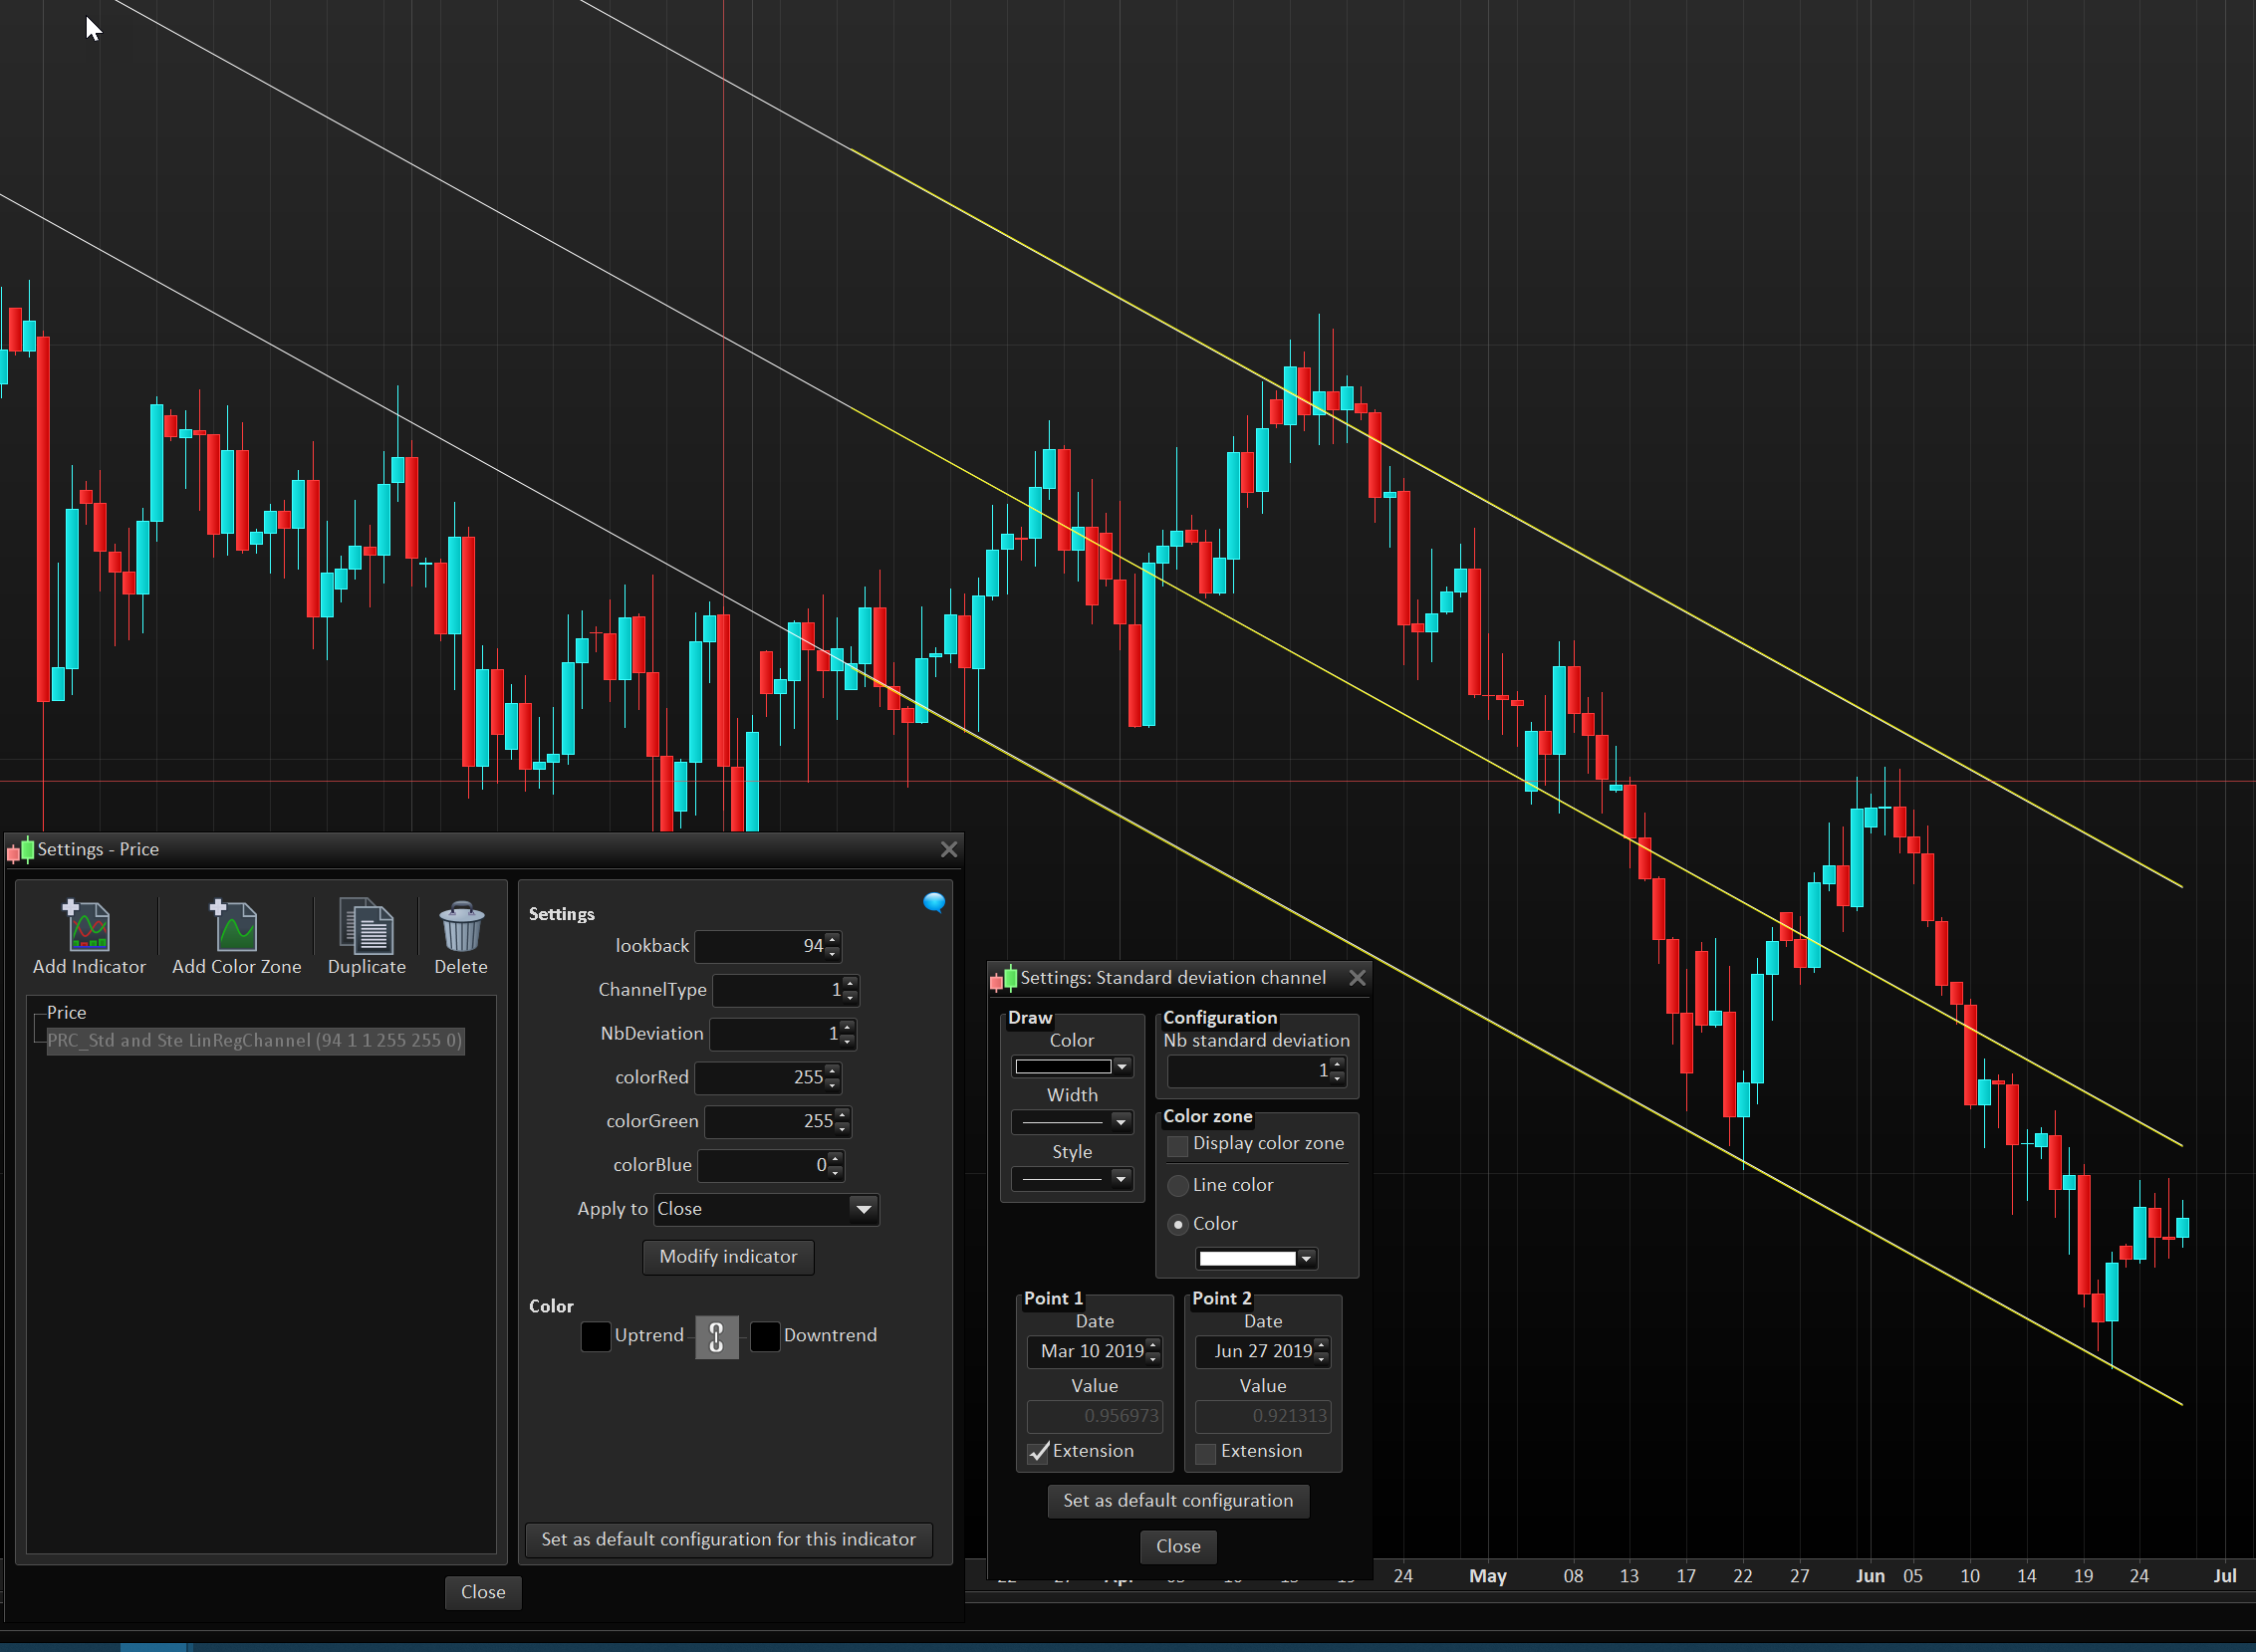
I have use, Standard error channel with Nb standard error as 1.62 (green dotted line) but when I set Deviation multiplier as 1.62 in your channel, it is not matching (image 1).
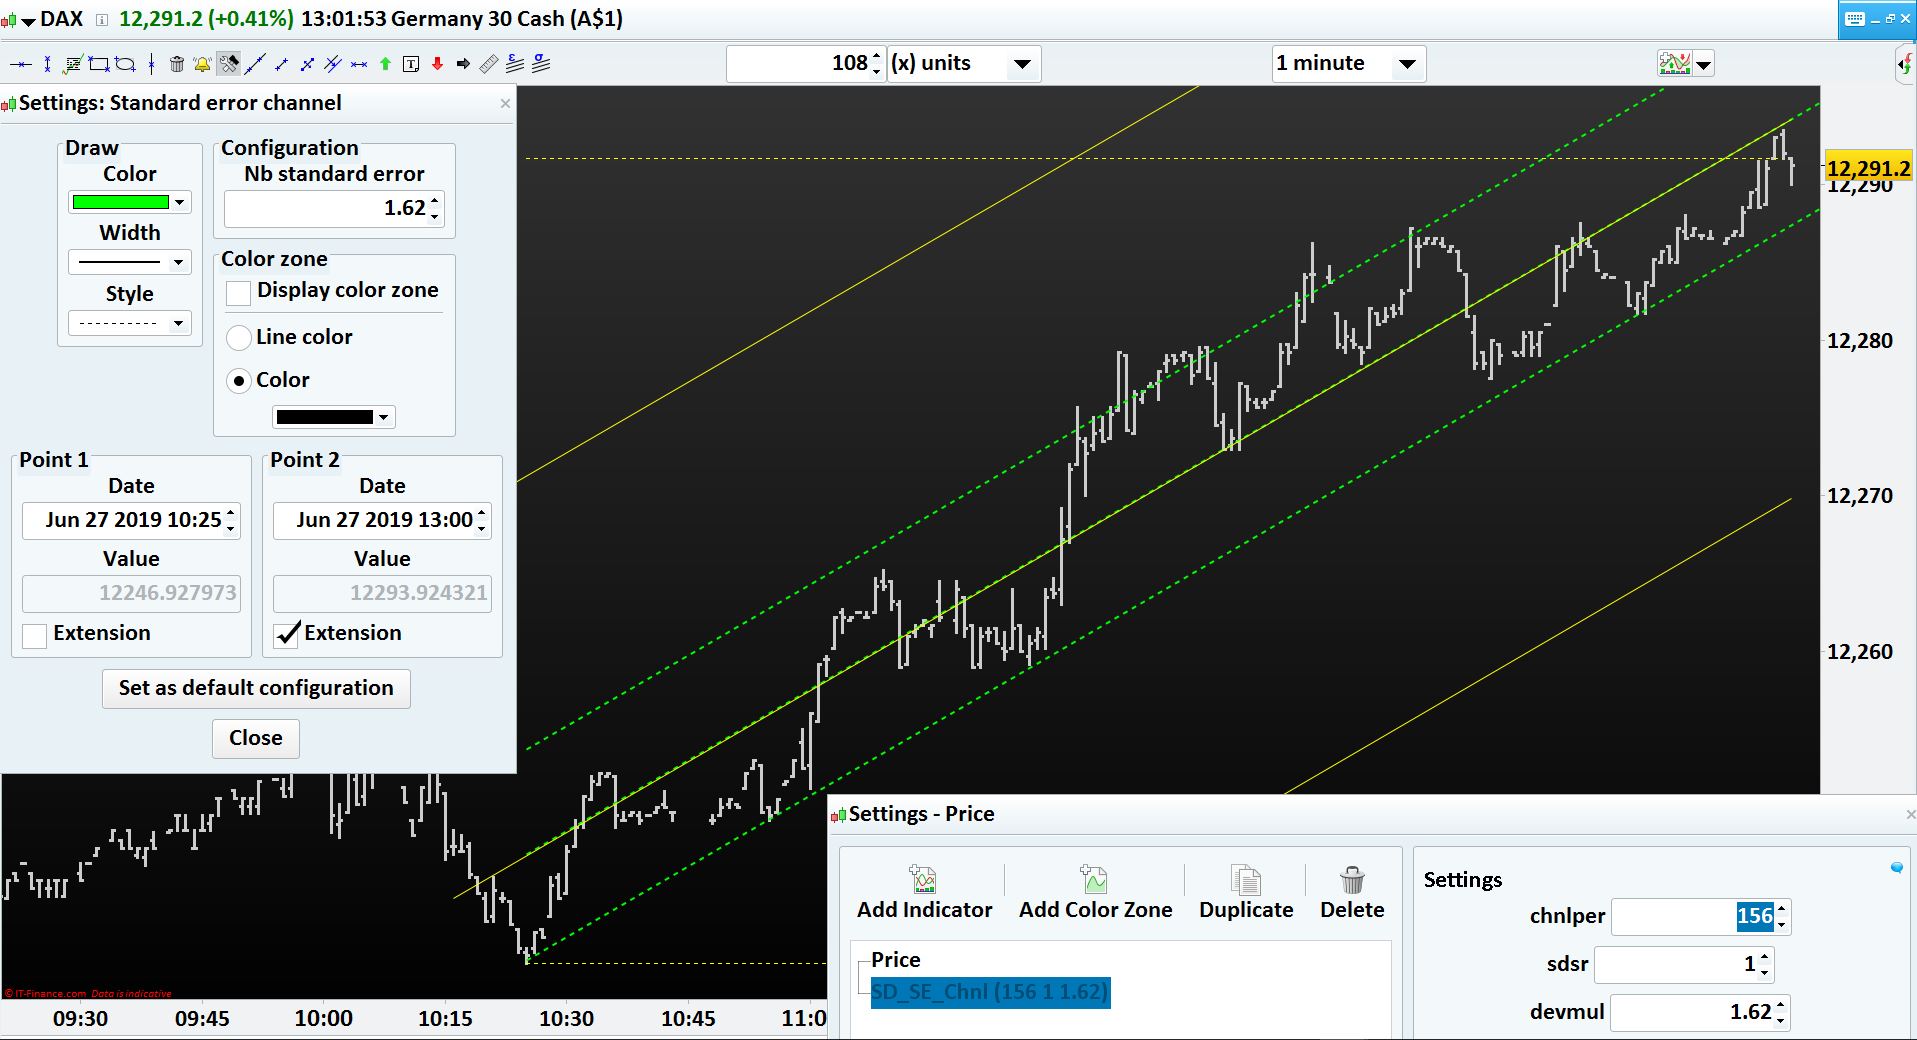
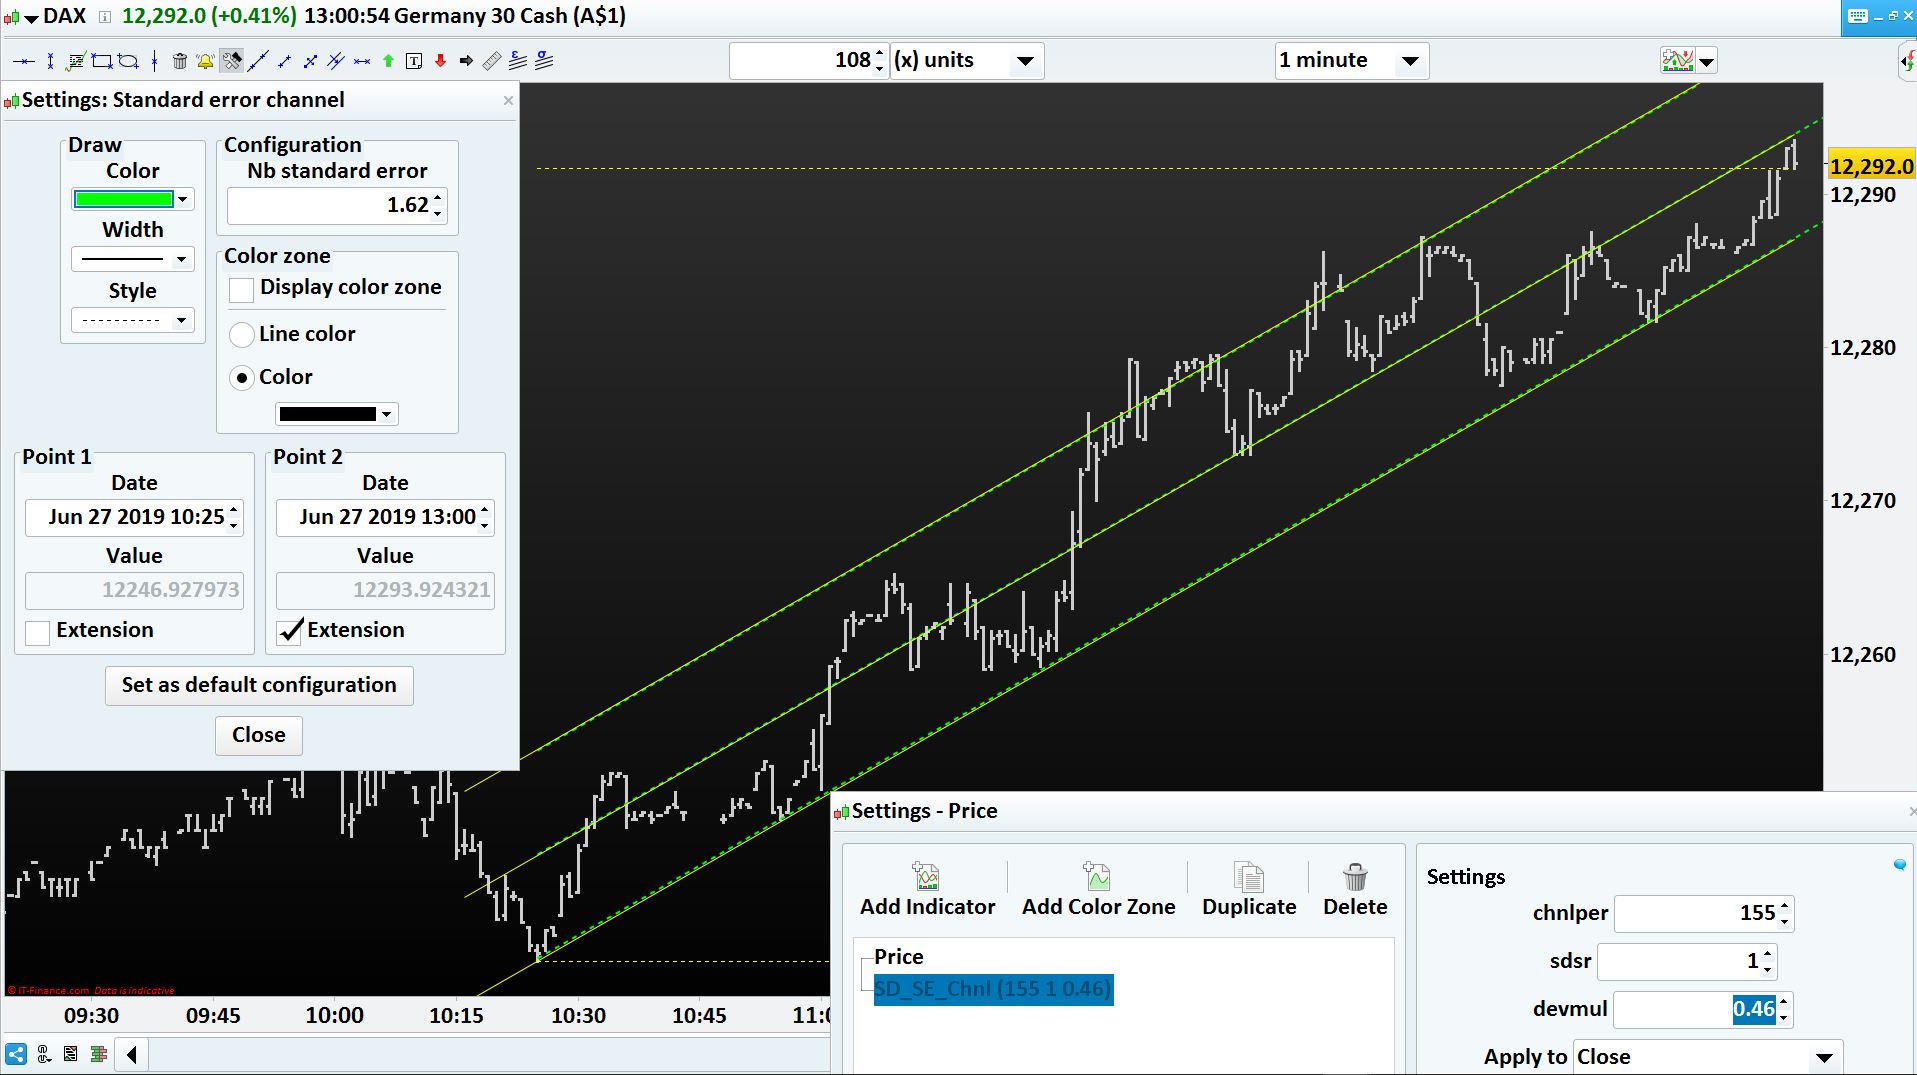
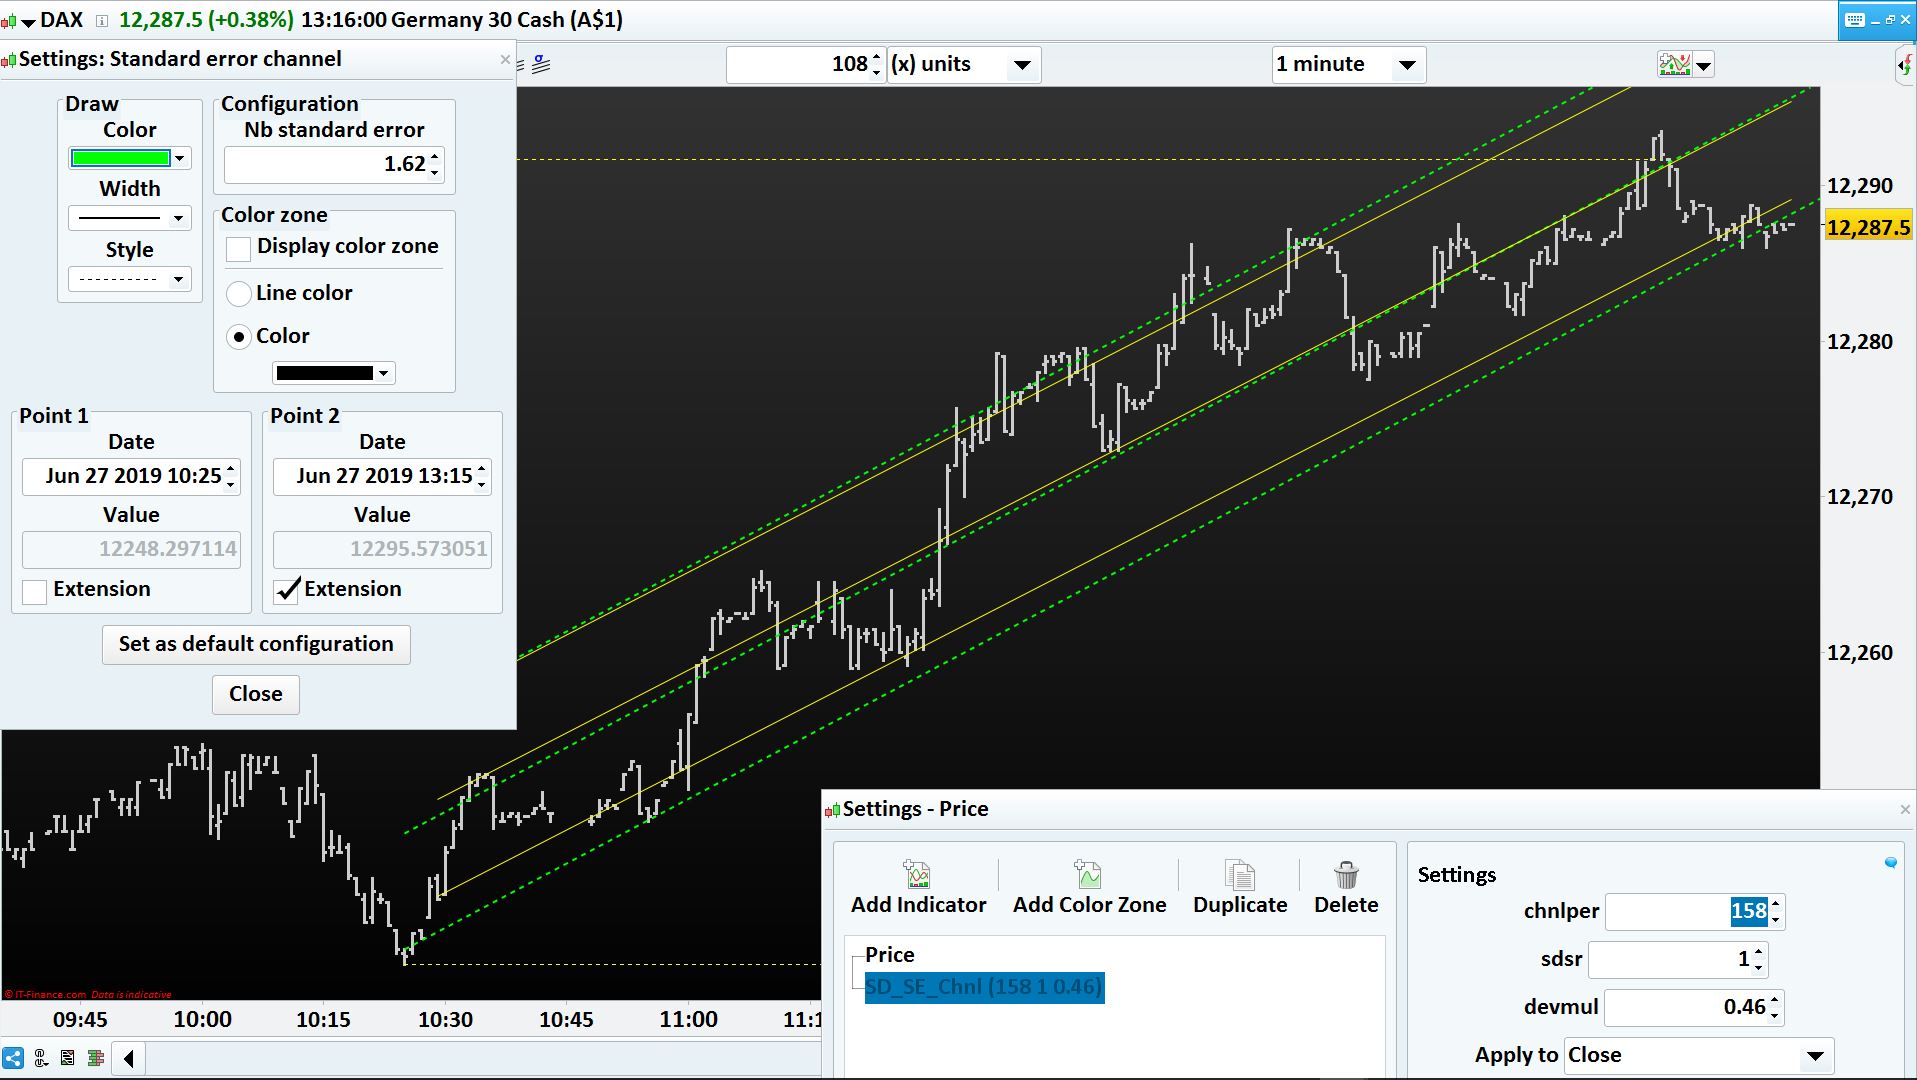
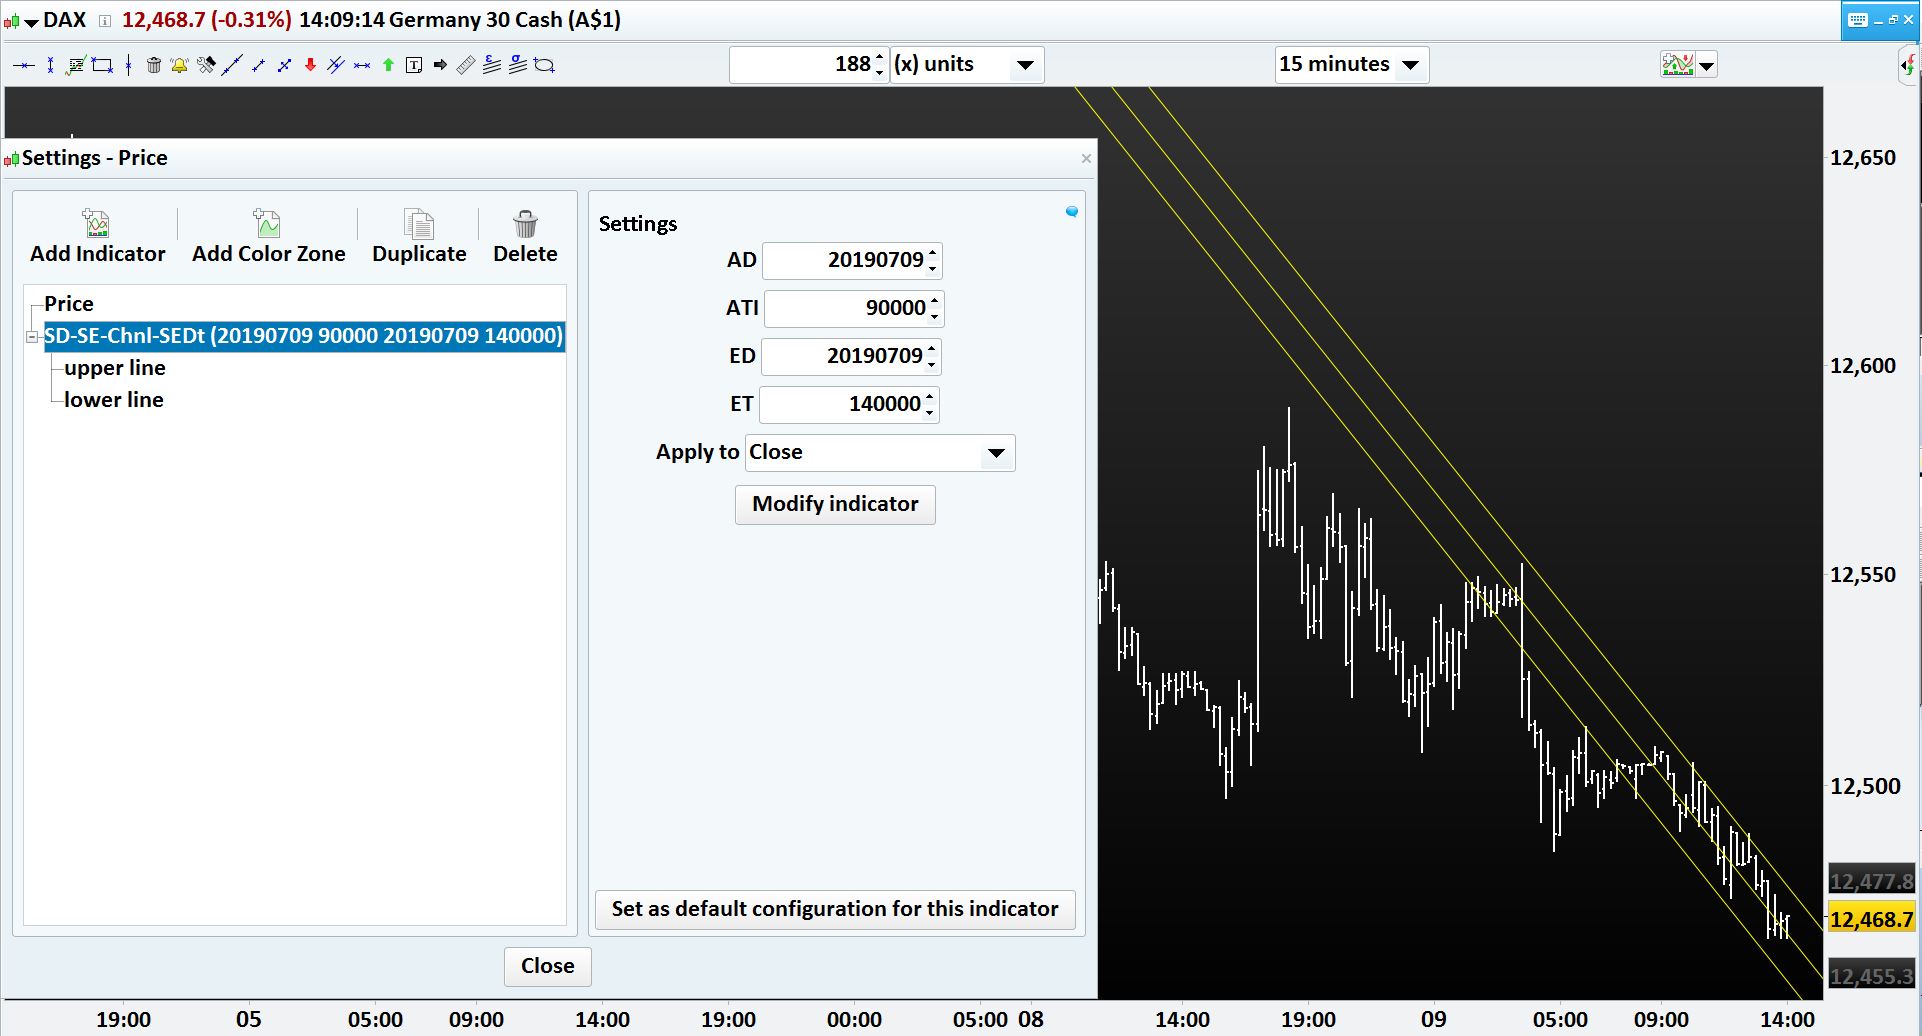
However, when I set Deviation multiplier as 0.46 in your channel, it is matching (image 2). But when the bars are moving your channel is getting shifted from the standard one as it is not staying anchored to the starting bar, as shown in image 3.
Also needs to anchor your channel to the starting point so that the number of bars need not be changed every 1 minute bar.
Appreciate your help please.
Many thanks.
I don’t know which version of the channel indicator you are using, but the one I provided the link above is perfectly matching the one from the platform (attached picture).
If you confirm you can use this one, I can change the calculation to make it anchor on specific date and time. Thanks.
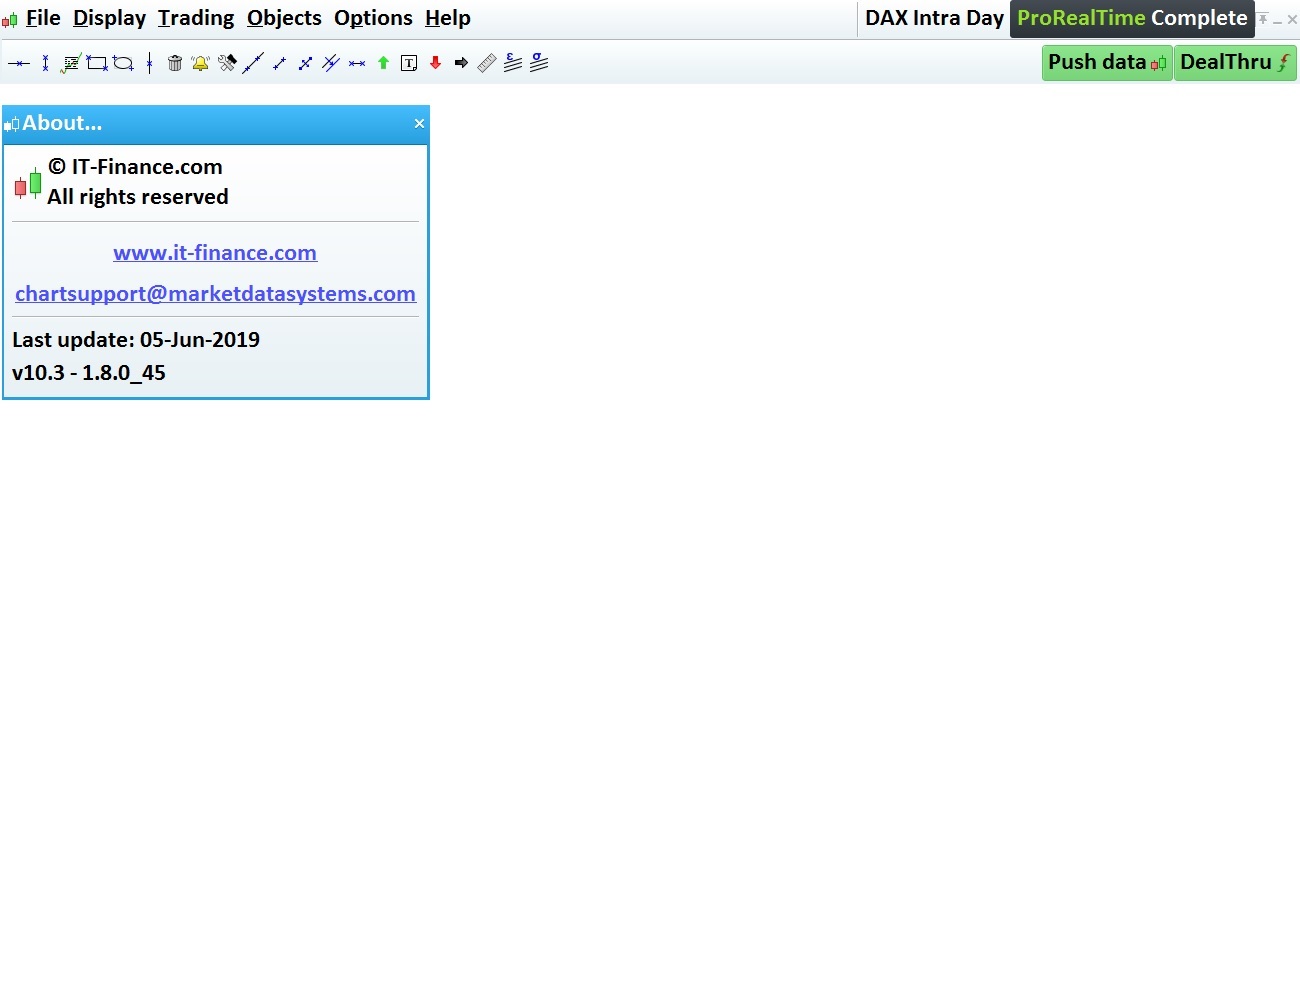
Many thanks Nicholas. I understand your point. Using your link I have downloaded the indicator whose code is as below. For the PRT Chart version I am using the one which is coming with IG Markets’ broker platform. The version is v10.3 – 1.8.0_45 as captured in the image. However, all good. Please anchor the channels to it fixed starting point. Many thanks for the code in advance.
I released a new version of the channel with anchored date and time in the library, download it from there: Anchored Standard Deviation & Standard Error Linear Regression Channel
You’ll have to define in the settings the precise date and time of candlestick of where to start the calculation of the channel.
Hello Nicholas, This is great. Many thanks for the same, however the very basic purpose of creating an ALERT on the channels is still not working. I have created the ALERT as shown in the enclosed, but system is not sensing the ALERT and hence not triggering. Appreciate your support please. Also the new anchored channels could not be truncated so that a new channel could be started. It should have an end date and time to terminate the old channel. Regards,
Hello Nicholas,
Any idea on how to make the ALERT work on the channels please?
Regards,
Hello Nicholas,
Can I conclude that it is not possible?
Regards,
Sorry but I don’t actively monitor each topic I answered to.
That’s indeed not possible to set alert on objects (I used objects to plot the channel). In this case we have to calculate each point of the segments and return them in the indicator, that way you should be able to set alert on them (when price crosses the segments).
I didn’t realize you wanted to have an end date for the channel too. I will look into that.
This version has EndDate and EndTime and you should be able to set alerts on price crossing one of the returned values of the indicator, first one is the upper line, second one the lower line.
//PRC_StdSte LinRegChannAnchored | indicator
//Standard Deviation and Standard Error with date&time anchor
//moded version with end date and time and channels values returned
//to set alerts with the alert tool
//Linear Regression Channel
//28.06.2019
//Nicolas @ www.prorealcode.com
//Sharing ProRealTime knowledge

defparam drawonlastbaronly=true
defparam calculateonlastbars=1000
// --- settings
AnchorDate = 20190624 //Date anchor YYYYMMDD format
AnchorTime = 100000 //Time anchor HHMMSS format

EndDate = 20190705 //Date anchor YYYYMMDD format
EndTime = 080000 //Time anchor HHMMSS format

ChannelType = 1 //1= Standard Deviation ; 2= Standard Erro
NbDeviation = 1 //Deviation multiplier
colorRed = 255
colorGreen = 255
colorBlue = 0
// --- end of settings

if date=anchordate and time=anchortime then
startbar=barindex
endif
if date=enddate and time=endtime then
endbar=barindex
endif

lookback = max(1,endbar-startbar)

if lookback>0 and date>=AnchorDate  then
sumx = 0
sumy = 0
sumxy = 0
sumx2 = 0

for cmpt = lookback downto 0 do
tmpx = cmpt
tmpy = close[cmpt]
sumy = sumy+tmpy
sumx = sumx+tmpx
sumx2 = sumx2 + (tmpx*tmpx)
sumxy = sumxy + (tmpy*tmpx)
next

n = lookback+1

if (sumx2 = sumx * sumx) then // protection to avoid infinite values
b = sumxy - sumx * sumy
else
b = (n * sumxy - sumx * sumy) / (n * sumx2 - sumx * sumx)
endif
a = (sumy - b * sumx) / n

drawline(startbar,a+b*lookback,endbar,a+b*0) coloured(colorRed,colorGreen,colorBlue)

//channel
if ChannelType = 1 then //Standard Deviation
dat = std[lookback]*NbDeviation
else
dat = ste[lookback]*NbDeviation
endif
drawline(startbar,(a+b*lookback)+dat,endbar,a+b*0+dat) coloured(colorRed,colorGreen,colorBlue)
drawline(startbar,(a+b*lookback)-dat,endbar,a+b*0-dat) coloured(colorRed,colorGreen,colorBlue)

coeff = ((a+b)-(a+b*lookback))/(max(1,endbar-startbar))
endif

return ((a+b*lookback)+dat)+(barindex-startbar)*coeff coloured(100,100,100,0) as "upper line",((a+b*lookback)-dat)+(barindex-startbar)*coeff coloured(100,100,100,0) as "lower line"
Hello Nicholas,
This is brilliant. Many thanks for the same. However the channel is extending to the left infinitely hence creating a confusion to its start date and time as enclosed. Can we truncate the channel from extending to its left please.
Regards,
Not possible to extend it only on one side. You have the choice, between segments like it used to be or like this..
We could add a vertical line at the starting date, so you could visualize where it starts, or a text/symbol for instance..
Here is a new version with a vertical line at the first bar of the channel (it contains also a bug fix, so use this version now).
//PRC_StdSte LinRegChannAnchored | indicator
//Standard Deviation and Standard Error with date&time anchor
//moded version with end date and time and channels values returned
//to set alerts with the alert tool
//Linear Regression Channel
//28.06.2019
//Nicolas @ www.prorealcode.com
//Sharing ProRealTime knowledge

defparam drawonlastbaronly=false
defparam calculateonlastbars=1000
// --- settings
AnchorDate = 20190710 //Date anchor YYYYMMDD format
AnchorTime = 100000 //Time anchor HHMMSS format

EndDate = 20190710 //Date anchor YYYYMMDD format
EndTime = 103000 //Time anchor HHMMSS format

ChannelType = 1 //1= Standard Deviation ; 2= Standard Erro
NbDeviation = 1 //Deviation multiplier
colorRed = 255
colorGreen = 255
colorBlue = 0
// --- end of settings

if date=anchordate and time=anchortime then
startbar=barindex
endif
if date=enddate and time=endtime then
endbar=barindex
endif

lookback = max(1,endbar-startbar)

if lookback>0 and date>=AnchorDate and date<=enddate and time<=endtime then
sumx = 0
sumy = 0
sumxy = 0
sumx2 = 0

for cmpt = lookback downto 0 do
tmpx = cmpt
tmpy = close[cmpt]
sumy = sumy+tmpy
sumx = sumx+tmpx
sumx2 = sumx2 + (tmpx*tmpx)
sumxy = sumxy + (tmpy*tmpx)
next

n = lookback+1

if (sumx2 = sumx * sumx) then // protection to avoid infinite values
b = sumxy - sumx * sumy
else
b = (n * sumxy - sumx * sumy) / (n * sumx2 - sumx * sumx)
endif
a = (sumy - b * sumx) / n

drawline(startbar,a+b*lookback,endbar,a+b*0) coloured(colorRed,colorGreen,colorBlue)

//channel
if ChannelType = 1 then //Standard Deviation
dat = std[lookback]*NbDeviation
else
dat = ste[lookback]*NbDeviation
endif
drawline(startbar,(a+b*lookback)+dat,endbar,a+b*0+dat) coloured(colorRed,colorGreen,colorBlue)
drawline(startbar,(a+b*lookback)-dat,endbar,a+b*0-dat) coloured(colorRed,colorGreen,colorBlue)
drawvline(startbar)

coeff = ((a+b)-(a+b*lookback))/(max(1,endbar-startbar))
endif

return ((a+b*lookback)+dat)+(barindex-startbar)*coeff coloured(100,100,100,0) as "upper line",((a+b*lookback)-dat)+(barindex-startbar)*coeff coloured(100,100,100,0) as "lower line"