Bard
BardParticipant
Master
Could someone please tell me how to get this code to find high implied volatility market bottoms? It’s based on the Williams Vix Fix code here: https://www.prorealcode.com/topic/a-better-implied-volatility-rank-and-percentile-indicator/#post-110636
It would also be great if it screened and found assets that had have 95% IV’s spikes over the last eg 10 periods.
Cheers.
p = 365 //LookBack for boundaries //Default 200, //365
pd = 10 // "LookBack Period Standard Deviation High" Default 22, //30
bbl = 60 //"Bollinger Band Length" //Default 20, //730
mult = 3.6 //"Bollinger Band Standard Deviation Up" Default 2.0, //4.5
lb = 95 //"Look Back Period Percentile High" // 99%
ph = 0.95 //"Highest Percentile - 0.90=90%, 0.95=95%, 0.99=99%"

mult = max(mult,1)
mult = min(mult,5)

// Implied High Volatility Rank -- IV Proxy

wvf = ((highest[pd](close)-low)/(highest[pd](close)))*100

sDev = mult * std[bbl](wvf)
midLine = average[bbl](wvf)
upperBand = midLine + sDev
rangeHigh = (highest[lb](wvf)) * ph

c1 = wvf >= upperBand
c2 = wvf >= rangeHigh

//Boundaries
upper = highest[p](wvf)
lower = lowest[p](wvf)

c3 = ((wvf-lower)/(upper-lower))*100

// Return 95% Percentile HIGH Volatility Market BOTTOMS
SCREENER [c1 and c2 and c3] (c3 as "95th Percentile Market Bottom")
The modified version below should work, but still didn’t get any result:
p = 200 //LookBack for boundaries //Default 200, //365
pd = 200 // "LookBack Period Standard Deviation High" Default 22, //30
bbl = 20 //"Bollinger Band Length" //Default 20, //730
mult = 4.5 //"Bollinger Band Standard Deviation Up" Default 2.0, //4.5
lb = 95 //"Look Back Period Percentile High" // 99%
ph = 0.95 //"Highest Percentile - 0.90=90%, 0.95=95%, 0.99=99%"

mult = max(mult,1)
mult = min(mult,5)

// Implied High Volatility Rank -- IV Proxy

wvf = ((highest[pd](close)-low)/(highest[pd](close)))*100

sDev = mult * std[bbl](wvf)
midLine = average[bbl](wvf)
upperBand = midLine + sDev
rangeHigh = (highest[lb](wvf)) * ph

c1 = wvf >= upperBand or wvf >= rangeHigh

//Boundaries
upper = highest[p](wvf)
lower = lowest[p](wvf)

wvflev = ((wvf-lower)/(upper-lower))*100

// Return 95% Percentile HIGH Volatility Market BOTTOMS
SCREENER [c1] (wvflev as "95th Percentile Market Bottom")
Please note that period of any calculation cannot exceed 254 bars as it is the limit of history with ProScreener.
BardParticipant
Master
Brilliant, thanks so much for coding this @Nicolas.
This lack of screener results is strange, not least because the same indicator code with higher criteria like multi = 6.0, lb 99 and ph 0.99 have produced results?
Pls see £/Y screenshot:
What do you think is going on with the Screener because it has lower threshold settings?
I made it works, the sum of p+pd periods must be lower or equal to 256.
BardParticipant
Master
Thanks Nicolas, that’s sorted it!
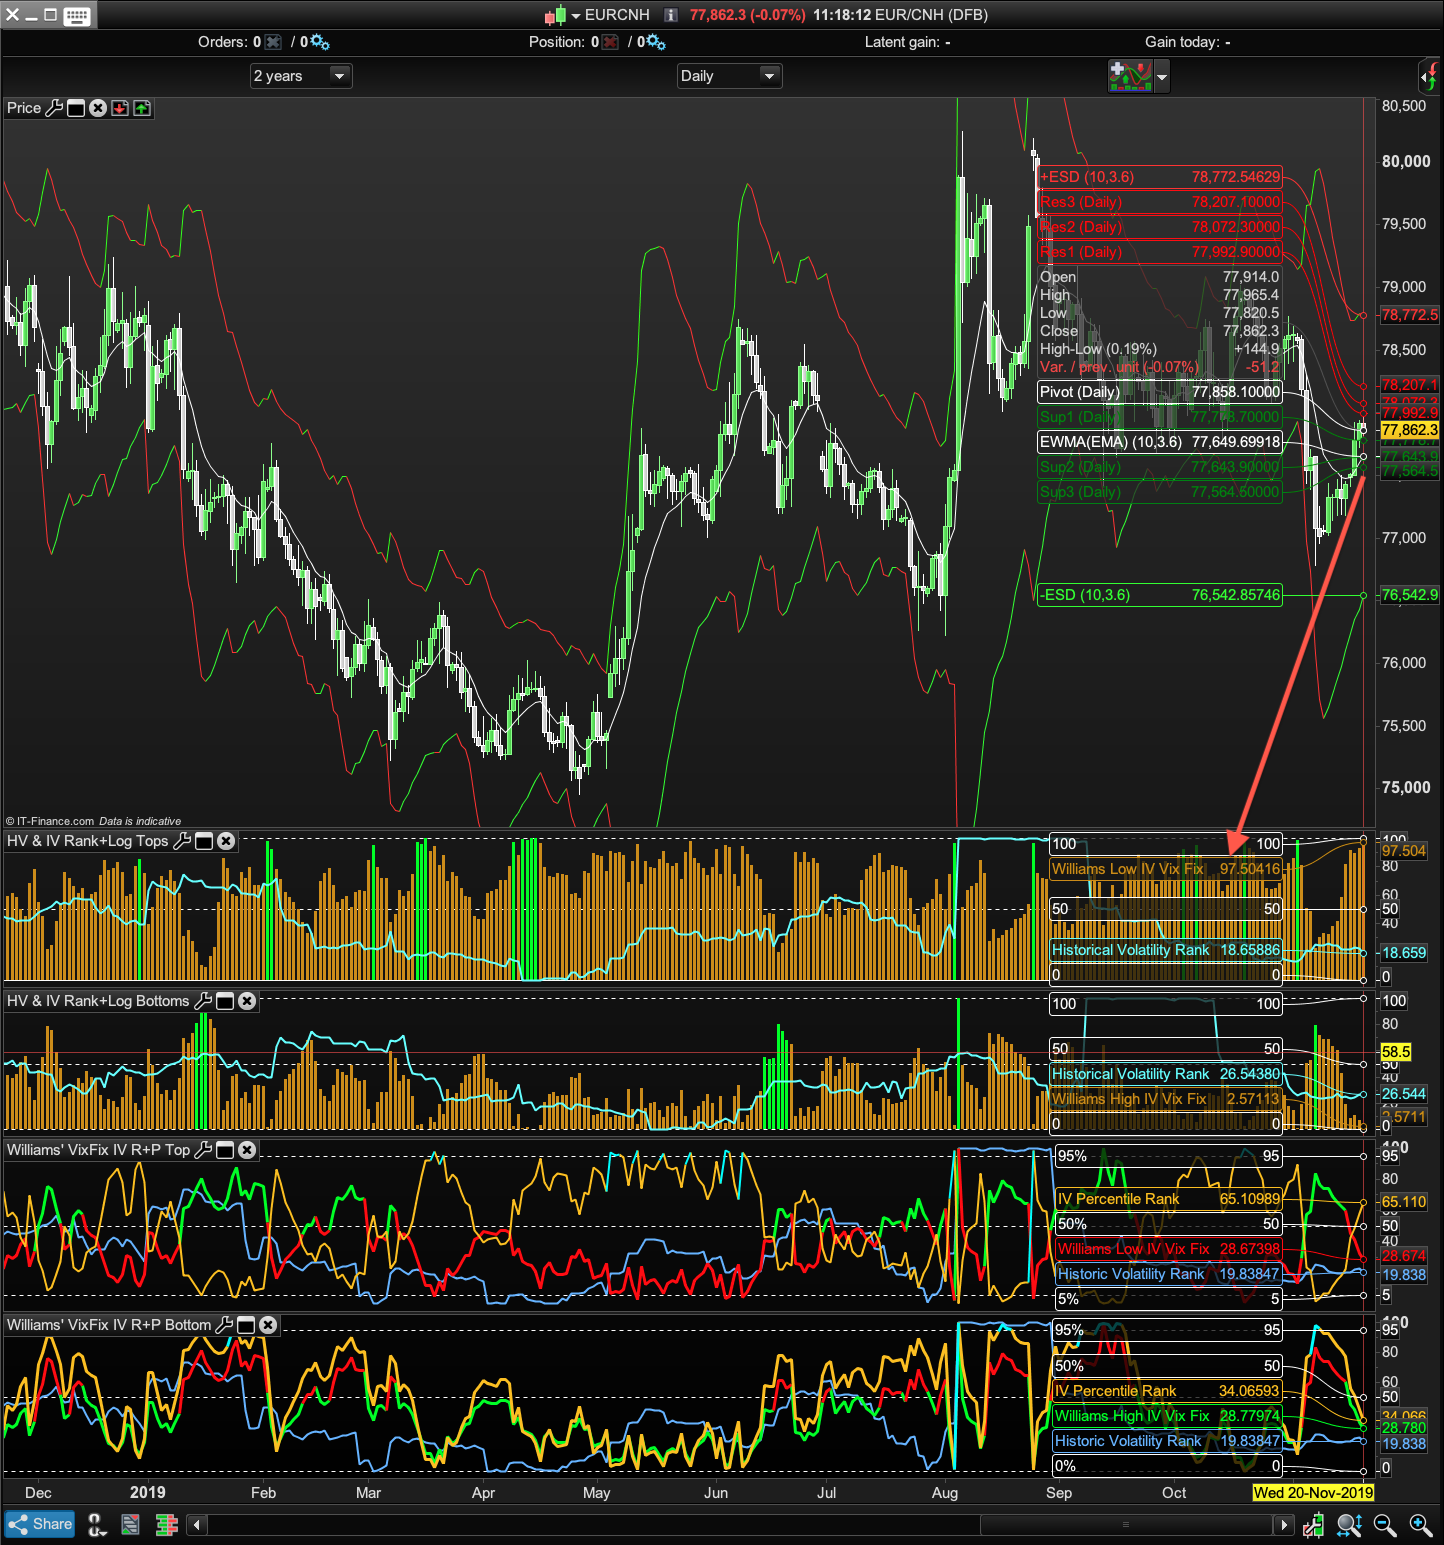
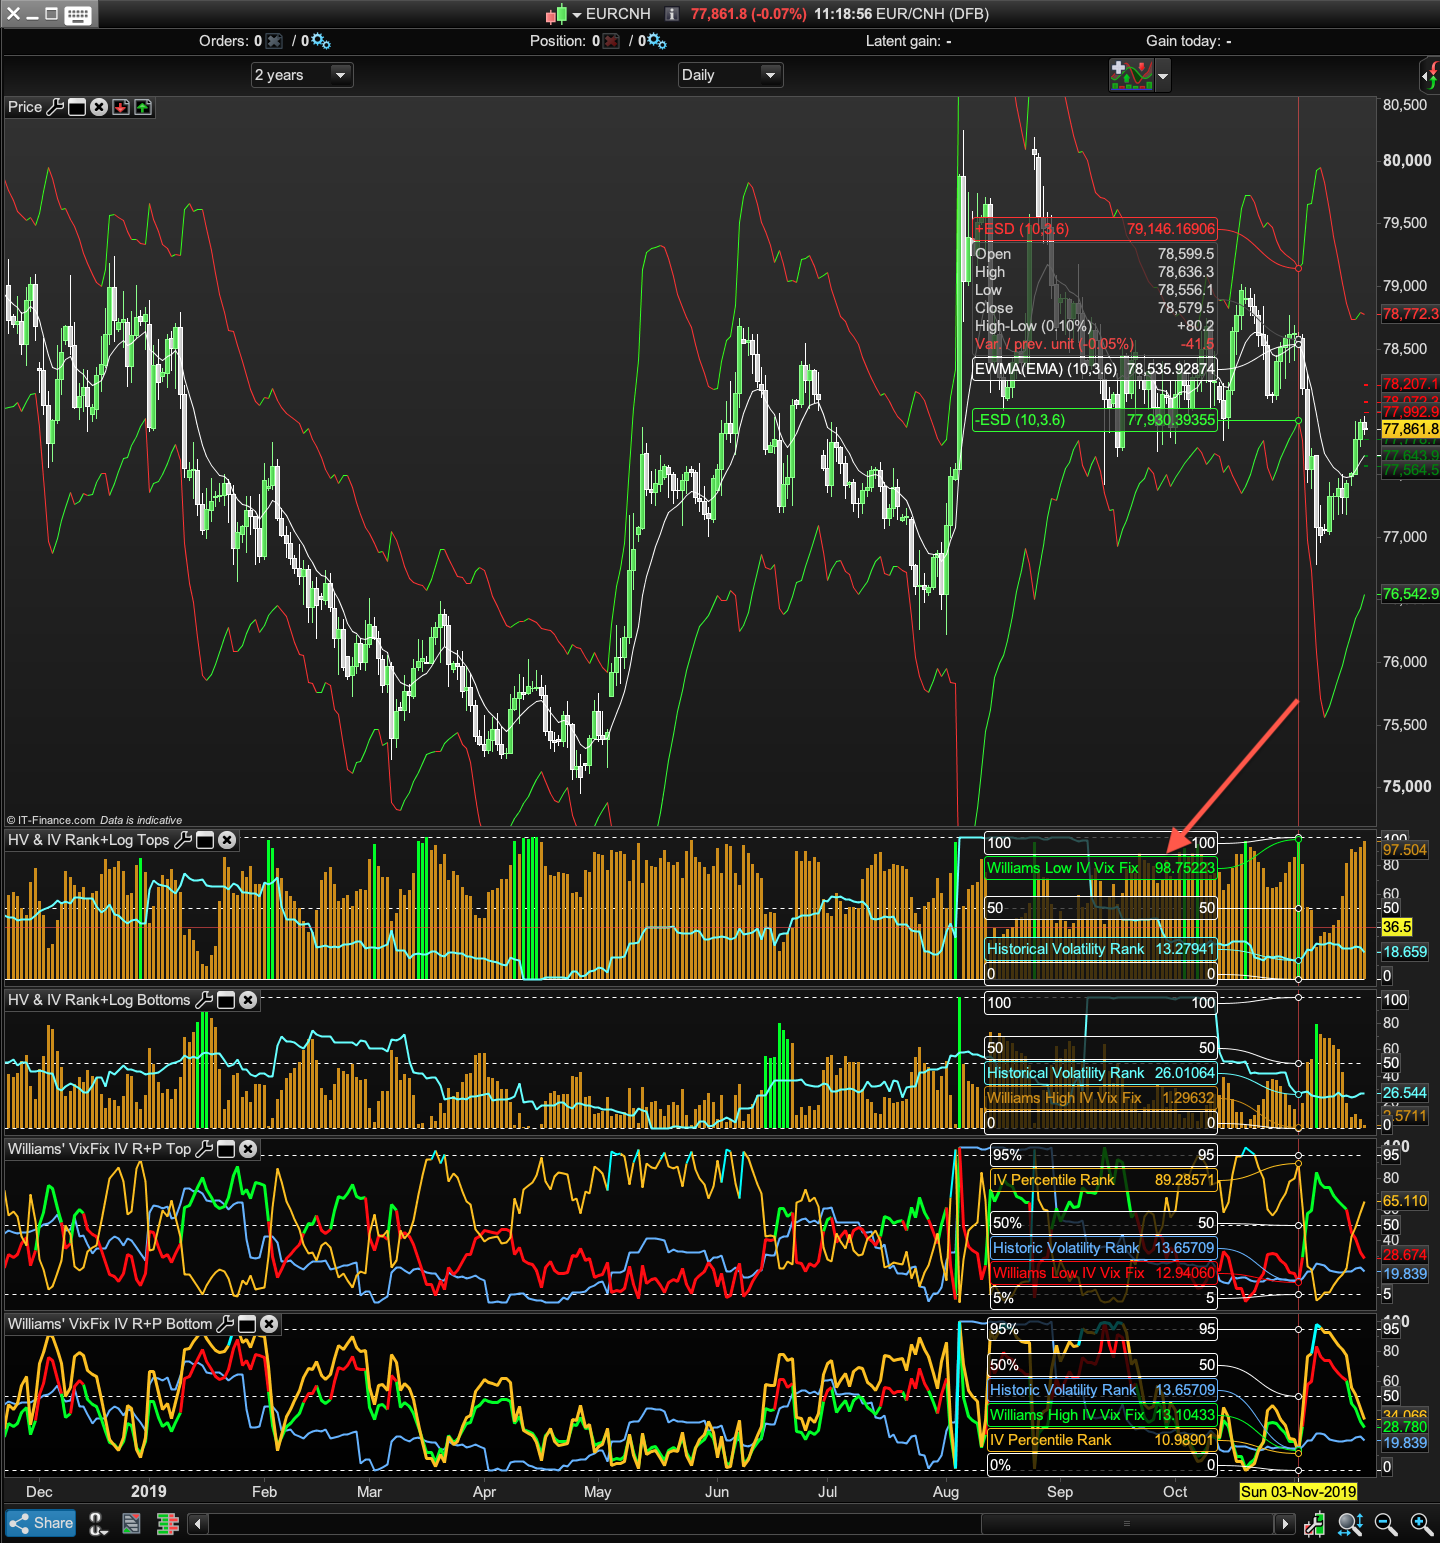
Can you think why there is no green highlight bar at 97.5% IV when the setting is looking for anthing over 95% IV and yet it marks a green bar for 98.7%?
Pls see 2 screenshots and a red arrrow showing a green highlight bar for 98.7% IV and another red arrow showing no such green bar (at 97.5% IV). Cheers.
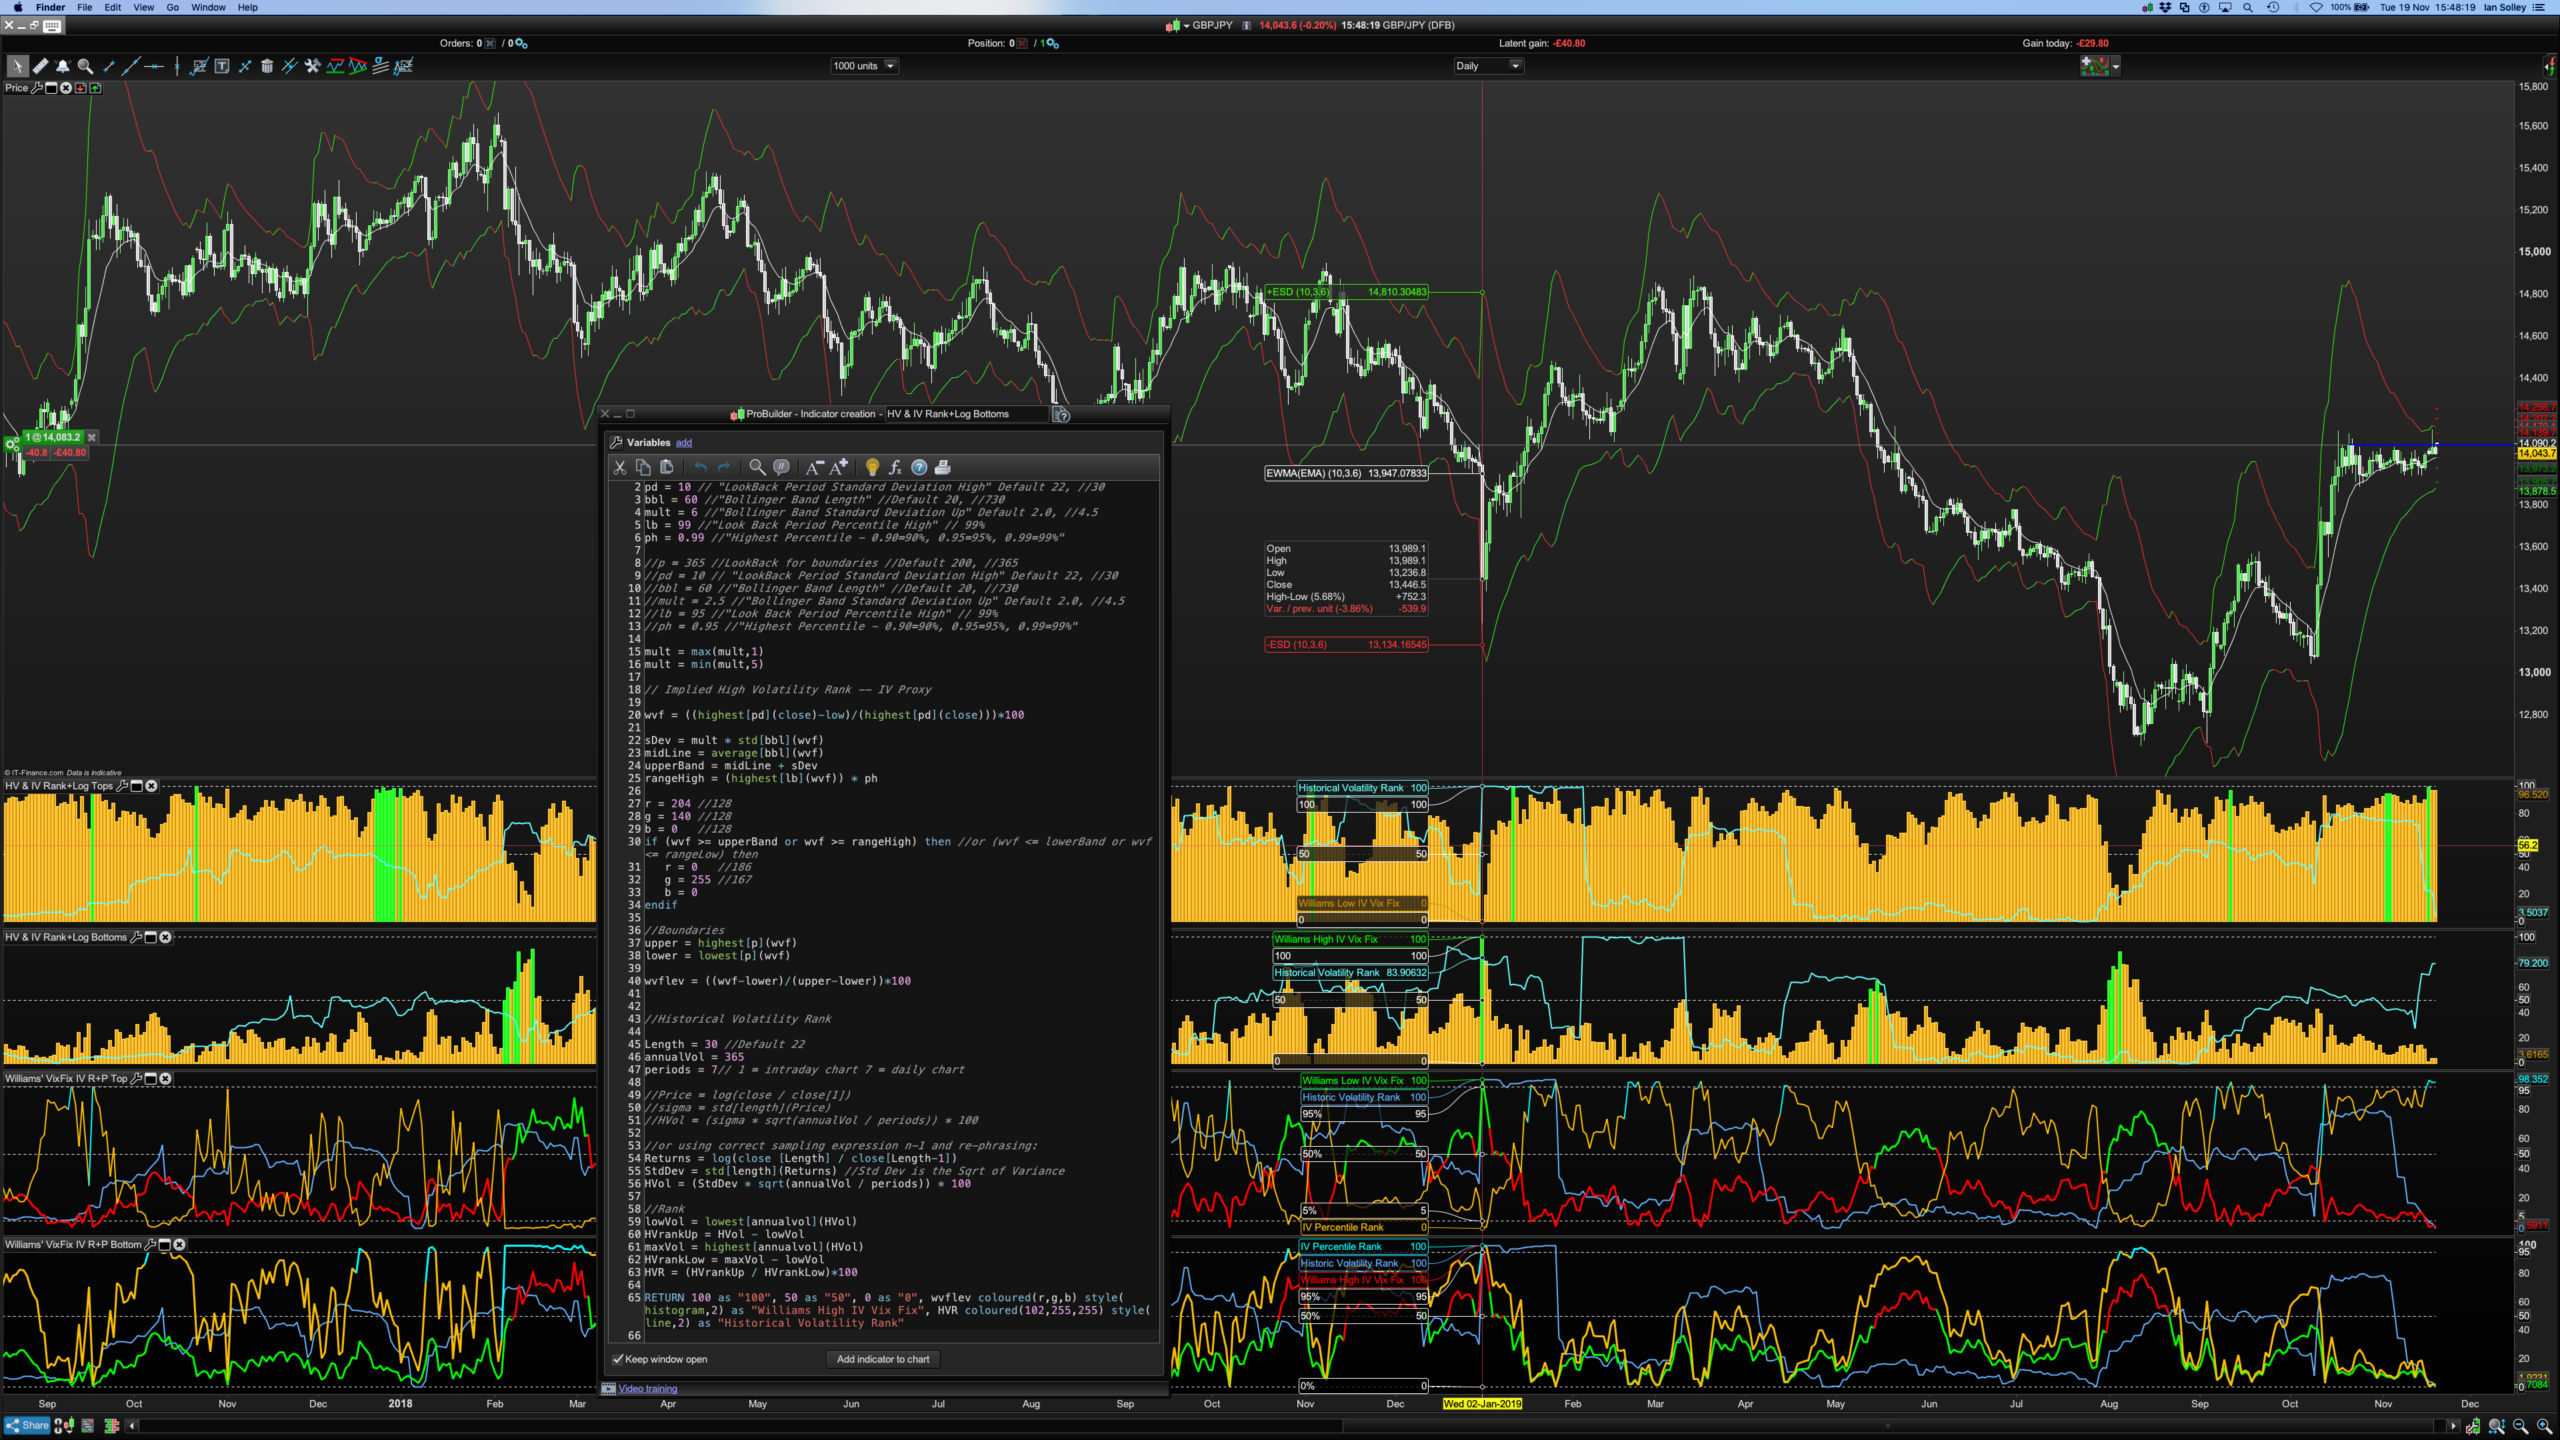
I’ve included the indicator code below for clarity:
p = 365 //LookBack for boundaries //Default 200 //365
pd = 10 // "LookBack Period Standard Deviation Low" Default 22 //30 //10
bbl = 60 //"Bollinger Band Length" //Default 20 //730 //60
mult = 1.5 //"Bollinger Band Standard Deviation down" Default 2.0, //1.0
lb = 95 //"Look Back Period Percentile low" //95%
pl = 1.05 //"Lowest Percentile - 1.10=90%, 1.05=95%, 1.01=99%"

mult = max(mult,1)
mult = min(mult,5)

// Implied Low Volatility Rank -- Inverse IV Proxy
wvf = ((highest[pd](close)-low)/(lowest[pd](close)))*100

//Correct but worse performing:
//wvfinverse = ((high-lowest[pd](close))/(lowest[pd](close)))*100

sDev = mult * std[bbl](wvf)
midLine = average[bbl](wvf)
lowerBand = midLine - sDev
rangeLow = (lowest[lb](wvf)) * pl

r = 204 //128
g = 140 //128
b = 0   //128
if wvf <= lowerBand or wvf <= rangeLow then
r = 0   //186
g = 255 //167
b = 0
endif

//Boundaries
upper = highest[p](wvf)
lower = lowest[p](wvf)

wvflev = 100-((wvf-lower)/(upper-lower))*100

//Historical Volatility Rank
Length = 30 //Default 22
annualVol = 365
//periods = 7// 1 = intraday chart 7 = daily chart

Price = log(close / close[1])
sigma = std[length](Price)
HVol = sigma * sqrt(annualVol ) * 100
lowVol = lowest[annualvol](HVol)
HVrankUp = HVol - lowVol
maxVol = highest[annualvol](HVol)
HVrankLow = maxVol - lowVol
HVR = (HVrankUp / HVrankLow)*100

RETURN 100 as "100", 50 as "50", 0 as "0", wvflev coloured(r,g,b) style(histogram,2) as "Williams Low IV Vix Fix", HVR coloured(102,255,255) style(line,2) as "Historical Volatility Rank"
This is a great Options (and general trading) Indicator and Screener highlighting typically unsustainably high volatility. Appreciate the help.