Expert Services

No recent search

8x Multicolour Market States
-
AuthorPosts
-
So I had this idea years ago that I was going to sit down one day and classify the markets as to whether they were trending, ranging, volatile or calm. The idea came from
Randy Stuckey who used to develop and sell trading systems with his company Mindfire Systems://Trending and Volatile //1 Trending Up and Volatile = DARK GREEN (0,150,0) //2 Trending Down and Volatile = DARK RED (153,0,0) //Trending and Calm //3 Trending Up and Calm = LIGHT GREEN (204,255,153) //4 Trending Down and Calm = LIGHT RED (255,102,102) //Ranging and Volatile //5 Ranging Up and Volatile = DARK BLUE (0,0,204) Consolidation Up //6 Ranging Down and Volatile = DARK ORANGE (76,153,0) Consolidation Down //Ranging and Calm //7 Ranging Up and Calm = LIGHT AQUA (153,255,255) Consolidation Up //8 Ranging Down and Calm = LIGHT PINK (255,153,255) Consolidation UpI then saw this interesting Multicolour Bollinger Bands indicator by @Supertiti: https://www.prorealcode.com/prorealtime-indicators/multicolour-bollinger-bands-market-phases/
which spurred me on to develop one using implied volatility, the Kaufman Efficiency Ratio and a Bear/Bull indicator I developed a while back that uses the responsive ALMA moving
Average.It’s a second “draft,” I just wondered if anyone had any ideas, perhaps to make the colour zones more solid and longer lasting as in the Supertiti version?
I wasn’t sure if it was respecting all the rules particularly with the moving averages and closes and there didn’t seem to be enough dark green sections?Either way it appears to give an immediate sense of what kind of market environment you’re in.
Let me know what you think and/or how it could be improved?
Cheers
BardPs/ If you tag me it’s @Brad. Slight admin b^&*s up. Don’t ask… 😀
“8x Multicolour Market States”
// Bard’s 8x Multicolour Market States //04/05/2019 v2 //P = 20 //bb20 period --- Add in VARIABLES //Dev = 2.0 //std deviation factor --- Add in VARIABLES //X = 90 //background alpha --- Add in VARIABLES //Trending and Volatile //1 Trending Up and Volatile = DARK GREEN (0,150,0) //2 Trending Down and Volatile = DARK RED (153,0,0) //Trending and Calm //3 Trending Up and Calm = LIGHT GREEN (204,255,153) //4 Trending Down and Calm = LIGHT RED (255,102,102) //Ranging and Volatile //5 Ranging Up and Volatile = DARK BLUE (0,0,204) Consolidation Up //6 Ranging Down and Volatile = DARK ORANGE (76,153,0) Consolidation Down //Ranging and Calm //7 Ranging Up and Calm = LIGHT AQUA (153,255,255) Consolidation Up //8 Ranging Down and Calm = LIGHT PINK (255,153,255) Consolidation Up DEFPARAM CalculateOnLastBars = 5000 EMA20 = ExponentialAverage[20](close) //ALMA //=================================================================// ShortMA = 50 MediumMA = 100 LongMA = 200 Period = 50 //start with 50 periods Series = customclose FOR j = 1 TO 3 Sigma = 6 Offset = 0.85 m = ROUND(Offset * (Period - 1)) s = Period / Sigma WtdSum = 0 CumWt = 0 FOR k = 0 TO Period - 1 DO Wtd = EXP(-((k - m) * (k - m)) / (2 * s * s)) WtdSum = WtdSum + Wtd * Series[Period - 1 - k] CumWt = CumWt + Wtd NEXT IF CumWt <= 0 THEN AFR = Series ELSE AFR = WtdSum / CumWt ENDIF IF j = 1 THEN ShortMA = AFR ELSIF j = 2 THEN MediumMA = AFR ELSE LongMA = AFR ENDIF Period = Period * 2 //doubles the periods NEXT //Bull Market increase in Prices BullC1 = Close[0] > ShortMA BullC2 = Close[0] > MediumMA BullC3 = Close[0] > LongMA //BullC4 = Close[0] >= (Close[200] * 1.2) //Bear Market decrease in Prices BearC5 = Close[0] < ShortMA BearC6 = Close[0] < MediumMA BearC7 = Close[0] < LongMA If BullC1 = 0 and BullC2 = 0 and BullC3 = 0 and BearC5 = -0 and BearC6 = -0 and BearC7 = -0 then NoBullorBear = 0 Endif //=================================================================// //Bollinger BollUp =Average[PeriodBoll](close)+dev*std[PeriodBoll](close) BollDown = Average[PeriodBoll](close)-dev*std[PeriodBoll](close) //=================================================================// //"Williams' VixFix IV R+P //Implied Volatility Rank and Percentile Indicator — MARKET TOPS //By Vonasi //Date 20191018 //NEED 1000 UNITS FOR AQUA BLUE PEAK OUTS //Settings HiLoPeriod = 365 //Highest/Lowest Period IVperiod = 22 //IVperiod //Inverse Vix Fix - Low IV Proxy //MODIFIED LOW VOL //Inverse Vix Fix - Low IV Proxy //MODIFIED LOW VOL //Correct but worse performing wvfinverse for spotting tops. //wvf = ((high-lowest[IVperiod](close))/(lowest[IVperiod](close)))*100 //High Volatility Market Bottoms - Non Inverse Vix Fix wvf = ((highest[IVperiod](close)-low)/(lowest[IVperiod](close)))*100 //Boundaries upper = highest[HiLoPeriod](wvf) lower = lowest[HiLoPeriod](wvf) //wvflev = 100-((wvf-lower)/(upper-lower)*100) //Doesn't Show Low Vol Tops wvflev = ((wvf-lower)/(upper-lower)*100) //=================================================================// //Kaufman's Efficiency Ratio PeriodKER = 20 Change = ABS(close - close[PeriodKER]) calc = ABS(close - close[1]) volat = summation[PeriodKER](calc) KER = Change / volat //Conditions //=================================================================// //Trending and Volatile //1 Trending Up and Volatile = DARK GREEN (0,150,0) //ALMA BULL/BEAR BullC1 = Close[0] > ShortMA BullC2 = Close[0] > MediumMA BullC3 = Close[0] > LongMA //ignored, CTI20, ignored, ignored, ignored, ignored = CALL "Ehler's Correlation Trend R2X3"[5, 20, 40](close) //CTI1 = (CTI20 > 25) VixFix1 = (wvflev > 50) If BullC1 and BullC2 and BullC3 and VixFix1 then Indicator = close //Indicator =1 r=0 g=150 b=0 Endif //=================================================================// //2 Trending Down and Volatile = DARK RED (153,0,0) //ALMA BULL/BEAR BearC5 = Close[0] < ShortMA BearC6 = Close[0] < MediumMA BearC7 = Close[0] < LongMA //ignored, CTI20, ignored, ignored, ignored, ignored = CALL "Ehler's Correlation Trend R2X3"[5, 20, 40](close) //CTI2 = (CTI20 > 25) VixFix2 = (wvflev > 50) If BearC5 and BearC6 and BearC7 and VixFix2 then Indicator = close //Indicator =1 r=204 g=0 b=0 Endif //=================================================================// //Trending and Calm //3 Trending Up and Calm = LIGHT GREEN (204,255,153) //ALMA BULL/BEAR BullC1 = Close[0] > ShortMA BullC2 = Close[0] > MediumMA BullC3 = Close[0] > LongMA //ignored, CTI20, ignored, ignored, ignored, ignored = CALL "Ehler's Correlation Trend R2X3"[5, 20, 40](close) //CTI3 = (CTI20 > 25) VixFix3 = (wvflev < 50) If BullC1 and BullC2 and BullC3 and VixFix3 then Indicator = close //Indicator =1 r=204 g=255 b=153 Endif //=================================================================// //4 Trending Down and Calm = LIGHT RED (255,102,102) //ALMA BULL/BEAR BearC5 = Close[0] < ShortMA BearC6 = Close[0] < MediumMA BearC7 = Close[0] < LongMA //ignored, CTI20, ignored, ignored, ignored, ignored = CALL "Ehler's Correlation Trend R2X3"[5, 20, 40](close) //CTI4 = (CTI20 > 25) VixFix4 = (wvflev < 50) If BearC5 and BearC6 and BearC7 and VixFix4 then Indicator = close //Indicator =1 r=255 g=102 b=102 Endif //=================================================================// //Ranging and Volatile //5 Ranging Up and Volatile = DARK BLUE (0,0,204) Consolidation Up ALMAC5=(ShortMA>LongMA)and(close>LongMA)and(close>MediumMA)//and((close<ShortMA)) //ignored, CTI20, ignored, ignored, ignored, ignored = CALL "Ehler's Correlation Trend R2X3"[5, 20, 40](close) //CTI5 = (CTI20 > 25) KER5 = (KER > 0.3) VixFix5 = (wvflev > 50) If ALMAC5 and KER5 and VixFix5 then Indicator = close //Indicator =1 r=0 g=0 b=204 Endif //=================================================================// //6 Ranging Down and Volatile = DARK ORANGE (76,153,0) Consolidation Down ALMAC6=(ShortMA>LongMA)and(close>LongMA)and(close>MediumMA)//and((close<ShortMA)) //ignored, CTI20, ignored, ignored, ignored, ignored = CALL "Ehler's Correlation Trend R2X3"[5, 20, 40](close) //CTI6 = (CTI20 < 25) KER6 = (KER > 0.3) VixFix6 = (wvflev > 50) If ALMAC6 and KER6 and VixFix6 then Indicator = close //Indicator =1 r=76 g=153 b=0 Endif //=================================================================// //Ranging and Calm //7 Ranging Up and Calm = LIGHT AQUA (153,255,255) Consolidation Up ALMAC7=(ShortMA>LongMA)and(close>LongMA)and(close>MediumMA) //and((close<ShortMA)) //ignored, CTI20, ignored, ignored, ignored, ignored = CALL "Ehler's Correlation Trend R2X3"[5, 20, 40](close) //CTI7 = (CTI20 < 25) BullBear7 = (NoBullorBear = 0) KER7 = (KER < 0.3) VixFix7 = (wvflev < 50) If ALMAC7 and BullBear7 and KER7 and VixFix7 then Indicator = close //Indicator =1 r= 153 g=255 b=255 Endif //=================================================================// //8 Ranging Down and Calm = LIGHT PINK (255,153,255) Consolidation Up ALMAC8=(ShortMA<LongMA)and(close<LongMA)and(close<MediumMA)//and((close<ShortMA)) //ignored, CTI20, ignored, ignored, ignored, ignored = CALL "Ehler's Correlation Trend R2X3"[5, 20, 40](close) //CTI8 = (CTI20 < 25) BullBear8 = (NoBullorBear = 0) KER8 = (KER < 0.3) VixFix8 = (wvflev < 50) If ALMAC8 and BullBear8 and KER8 and VixFix8 then Indicator = close //Indicator =1 r=255 g=153 b=255 Endif max1=BollUp min1=BollDown DRAWCANDLE(max1, min1, max1, min1)coloured(R,G,B,x) RETURN EMA20 style(line) as "EMA20", BollUp as "BollUp", BollDown as "BollDown", indicatorNice work mate, will give it a go. I’m interested in Kaufmans work and I see that you’re as well 🙂
Regards,
Bel.
Thanks @Bel, it took many hours. Worth also checking out my posts on the work of Cynthia Kase (Kase Dev Stop v3) and John Ehlers.
Bel thanked this postI hear ya and already checking them. Thanks again. Probably its impossible and against the rules of forum to try and communicate for a chat somewhere?
Regards,
Bel.
Whoever wants to communicate with some users should use the contact form (Contact Us) to ask permission to Admin.
Done. Thanks.
Thanks @Bel, it took many hours. Worth also checking out my posts on the work of Cynthia Kase (Kase Dev Stop v3) and John Ehlers.
Looking at Kase Dev Stop research and def on the list to explore. Kase bars also should be interesting imo:)
Thanks Bard, very interesting, I had trouble to make the indicator to work, so I attach the code with all settings available at the top.
DEFPARAM CalculateOnLastBars = 5000
// Bard’s 8x Multicolour Market States
//04/05/2019 v2
PeriodBoll = 20 //bb20 period --- Add in VARIABLES
Dev = 2.0 //std deviation factor --- Add in VARIABLES
X = 50 //background alpha --- Add in VARIABLES

//Trending and Volatile
//1 Trending Up and Volatile = DARK GREEN (0,150,0)
//2 Trending Down and Volatile = DARK RED (153,0,0)

//Trending and Calm
//3 Trending Up and Calm = LIGHT GREEN (204,255,153)
//4 Trending Down and Calm = LIGHT RED (255,102,102)

//Ranging and Volatile
//5 Ranging Up and Volatile = DARK BLUE (0,0,204) Consolidation Up
//6 Ranging Down and Volatile = DARK ORANGE (76,153,0) Consolidation Down

//Ranging and Calm
//7 Ranging Up and Calm = LIGHT AQUA (153,255,255) Consolidation Up
//8 Ranging Down and Calm = LIGHT PINK (255,153,255) Consolidation Up

EMA20 = ExponentialAverage[20](close)

//ALMA
//=================================================================//
ShortMA = 50
MediumMA = 100
LongMA = 200

Period = 50 //start with 50 periods
Series = customclose
FOR j = 1 TO 3
Sigma = 6
Offset = 0.85
m = ROUND(Offset * (Period - 1))
s = Period / Sigma
WtdSum = 0
CumWt = 0
FOR k = 0 TO Period - 1 DO
Wtd = EXP(-((k - m) * (k - m)) / (2 * s * s))
WtdSum = WtdSum + Wtd * Series[Period - 1 - k]
CumWt = CumWt + Wtd
NEXT
IF CumWt <= 0 THEN
AFR = Series
ELSE
AFR = WtdSum / CumWt
ENDIF

IF j = 1 THEN
ShortMA = AFR
ELSIF j = 2 THEN
MediumMA = AFR
ELSE
LongMA = AFR
ENDIF
Period = Period * 2 //doubles the periods
NEXT

//Bull Market increase in Prices
BullC1 = Close[0] > ShortMA
BullC2 = Close[0] > MediumMA
BullC3 = Close[0] > LongMA
//BullC4 = Close[0] >= (Close[200] * 1.2)

//Bear Market decrease in Prices
BearC5 = Close[0] < ShortMA
BearC6 = Close[0] < MediumMA
BearC7 = Close[0] < LongMA

If BullC1 = 0 and BullC2 = 0 and BullC3 = 0 and BearC5 = -0 and BearC6 = -0 and BearC7 = -0 then
NoBullorBear = 0
Endif
//=================================================================//

//Bollinger
BollUp =Average[PeriodBoll](close)+dev*std[PeriodBoll](close)
BollDown = Average[PeriodBoll](close)-dev*std[PeriodBoll](close)

//=================================================================//
//"Williams' VixFix IV R+P

//Implied Volatility Rank and Percentile Indicator — MARKET TOPS
//By Vonasi //Date 20191018

//NEED 1000 UNITS FOR AQUA BLUE PEAK OUTS

//Settings
HiLoPeriod = 365 //Highest/Lowest Period
IVperiod = 22 //IVperiod

//Inverse Vix Fix - Low IV Proxy
//MODIFIED LOW VOL

//Inverse Vix Fix - Low IV Proxy
//MODIFIED LOW VOL
//Correct but worse performing wvfinverse for spotting tops.
//wvf = ((high-lowest[IVperiod](close))/(lowest[IVperiod](close)))*100

//High Volatility Market Bottoms - Non Inverse Vix Fix
wvf = ((highest[IVperiod](close)-low)/(lowest[IVperiod](close)))*100

//Boundaries
upper = highest[HiLoPeriod](wvf)
lower = lowest[HiLoPeriod](wvf)

//wvflev = 100-((wvf-lower)/(upper-lower)*100) //Doesn't Show Low Vol Tops
wvflev = ((wvf-lower)/(upper-lower)*100)

//=================================================================//

//Kaufman's Efficiency Ratio
PeriodKER = 20

Change = ABS(close - close[PeriodKER])

calc = ABS(close - close[1])

volat = summation[PeriodKER](calc)

KER = Change / volat

//Conditions
//=================================================================//

//Trending and Volatile

//1 Trending Up and Volatile = DARK GREEN (0,150,0)
//ALMA BULL/BEAR
BullC1 = Close[0] > ShortMA
BullC2 = Close[0] > MediumMA
BullC3 = Close[0] > LongMA

//ignored, CTI20, ignored, ignored, ignored, ignored = CALL "Ehler's Correlation Trend R2X3"[5, 20, 40](close)
//CTI1 = (CTI20 > 25)

VixFix1 = (wvflev > 50)

If BullC1 and BullC2 and BullC3 and VixFix1 then
Indicator = close //Indicator =1
r=0
g=150
b=0
Endif

//=================================================================//
//2 Trending Down and Volatile = DARK RED (153,0,0)
//ALMA BULL/BEAR
BearC5 = Close[0] < ShortMA
BearC6 = Close[0] < MediumMA
BearC7 = Close[0] < LongMA

//ignored, CTI20, ignored, ignored, ignored, ignored = CALL "Ehler's Correlation Trend R2X3"[5, 20, 40](close)
//CTI2 = (CTI20 > 25)

VixFix2 = (wvflev > 50)

If BearC5 and BearC6 and BearC7 and VixFix2 then
Indicator = close //Indicator =1
r=204
g=0
b=0
Endif

//=================================================================//
//Trending and Calm

//3 Trending Up and Calm = LIGHT GREEN (204,255,153)
//ALMA BULL/BEAR
BullC1 = Close[0] > ShortMA
BullC2 = Close[0] > MediumMA
BullC3 = Close[0] > LongMA

//ignored, CTI20, ignored, ignored, ignored, ignored = CALL "Ehler's Correlation Trend R2X3"[5, 20, 40](close)
//CTI3 = (CTI20 > 25)

VixFix3 = (wvflev < 50)

If BullC1 and BullC2 and BullC3 and VixFix3 then
Indicator = close //Indicator =1
r=204
g=255
b=153
Endif

//=================================================================//
//4 Trending Down and Calm = LIGHT RED (255,102,102)
//ALMA BULL/BEAR
BearC5 = Close[0] < ShortMA
BearC6 = Close[0] < MediumMA
BearC7 = Close[0] < LongMA

//ignored, CTI20, ignored, ignored, ignored, ignored = CALL "Ehler's Correlation Trend R2X3"[5, 20, 40](close)
//CTI4 = (CTI20 > 25)

VixFix4 = (wvflev < 50)

If BearC5 and BearC6 and BearC7 and VixFix4 then
Indicator = close //Indicator =1
r=255
g=102
b=102
Endif

//=================================================================//
//Ranging and Volatile

//5 Ranging Up and Volatile = DARK BLUE (0,0,204) Consolidation Up
ALMAC5=(ShortMA>LongMA)and(close>LongMA)and(close>MediumMA)//and((close<ShortMA))

//ignored, CTI20, ignored, ignored, ignored, ignored = CALL "Ehler's Correlation Trend R2X3"[5, 20, 40](close)
//CTI5 = (CTI20 > 25)

KER5 = (KER > 0.3)

VixFix5 = (wvflev > 50)

If ALMAC5 and KER5 and VixFix5 then
Indicator = close //Indicator =1
r=0
g=0
b=204
Endif

//=================================================================//
//6 Ranging Down and Volatile = DARK ORANGE (76,153,0) Consolidation Down
ALMAC6=(ShortMA>LongMA)and(close>LongMA)and(close>MediumMA)//and((close<ShortMA))

//ignored, CTI20, ignored, ignored, ignored, ignored = CALL "Ehler's Correlation Trend R2X3"[5, 20, 40](close)
//CTI6 = (CTI20 < 25)

KER6 = (KER > 0.3)

VixFix6 = (wvflev > 50)

If ALMAC6 and KER6 and VixFix6 then
Indicator = close //Indicator =1
r=76
g=153
b=0
Endif

//=================================================================//
//Ranging and Calm

//7 Ranging Up and Calm = LIGHT AQUA (153,255,255) Consolidation Up
ALMAC7=(ShortMA>LongMA)and(close>LongMA)and(close>MediumMA) //and((close<ShortMA))

//ignored, CTI20, ignored, ignored, ignored, ignored = CALL "Ehler's Correlation Trend R2X3"[5, 20, 40](close)
//CTI7 = (CTI20 < 25)

BullBear7 = (NoBullorBear = 0)

KER7 = (KER < 0.3)

VixFix7 = (wvflev < 50)

If ALMAC7 and BullBear7 and KER7 and VixFix7 then
Indicator = close //Indicator =1
r= 153
g=255
b=255
Endif

//=================================================================//
//8 Ranging Down and Calm = LIGHT PINK (255,153,255) Consolidation Up
ALMAC8=(ShortMA<LongMA)and(close<LongMA)and(close<MediumMA)//and((close<ShortMA))

//ignored, CTI20, ignored, ignored, ignored, ignored = CALL "Ehler's Correlation Trend R2X3"[5, 20, 40](close)
//CTI8 = (CTI20 < 25)

BullBear8 = (NoBullorBear = 0)

KER8 = (KER < 0.3)

VixFix8 = (wvflev < 50)

If ALMAC8 and BullBear8 and KER8 and VixFix8 then
Indicator = close //Indicator =1
r=255
g=153
b=255
Endif

max1=BollUp
min1=BollDown
DRAWCANDLE(max1, min1, max1, min1)coloured(R,G,B,x)bordercolor(r,g,b,0)


RETURN EMA20 style(line) as "EMA20", BollUp as "BollUp", BollDown as "BollDown", indicator
atxeel thanked this postGood idea, thanks Nicolas. I might try for a simpler 4 state indicator just showing the first 4 defined market states, that or find a better way to make sure conditions like c7 and c8 are more accurate.
Sorry for a bit off-topic Brad, just wanted to know if you have researched perhaps Kaufmans Velocity and Accelerator concepts?
Regards,
Bel.
Hi Bel, no I haven’t. Have you backtested them to see if there is an edge? Maybe worth starting a new topic in a new thread?
Ps, I am reachable on @Brad but it’s actually “Bard,” despite what my profile link says (it was an admin error)! Lol.
Hi Bel, no I haven’t. Have you backtested them to see if there is an edge? Maybe worth starting a new topic in a new thread?
Ps, I am reachable on @brad but it’s actually “Bard,” despite what my profile link says (it was an admin error)! Lol.
Hi mate, no worries lol
I’d def worth to explore but would need to code them as there’s none in PRT language from what I was able to find.
Regards,
Bel.
just showing the first 4 defined market states,
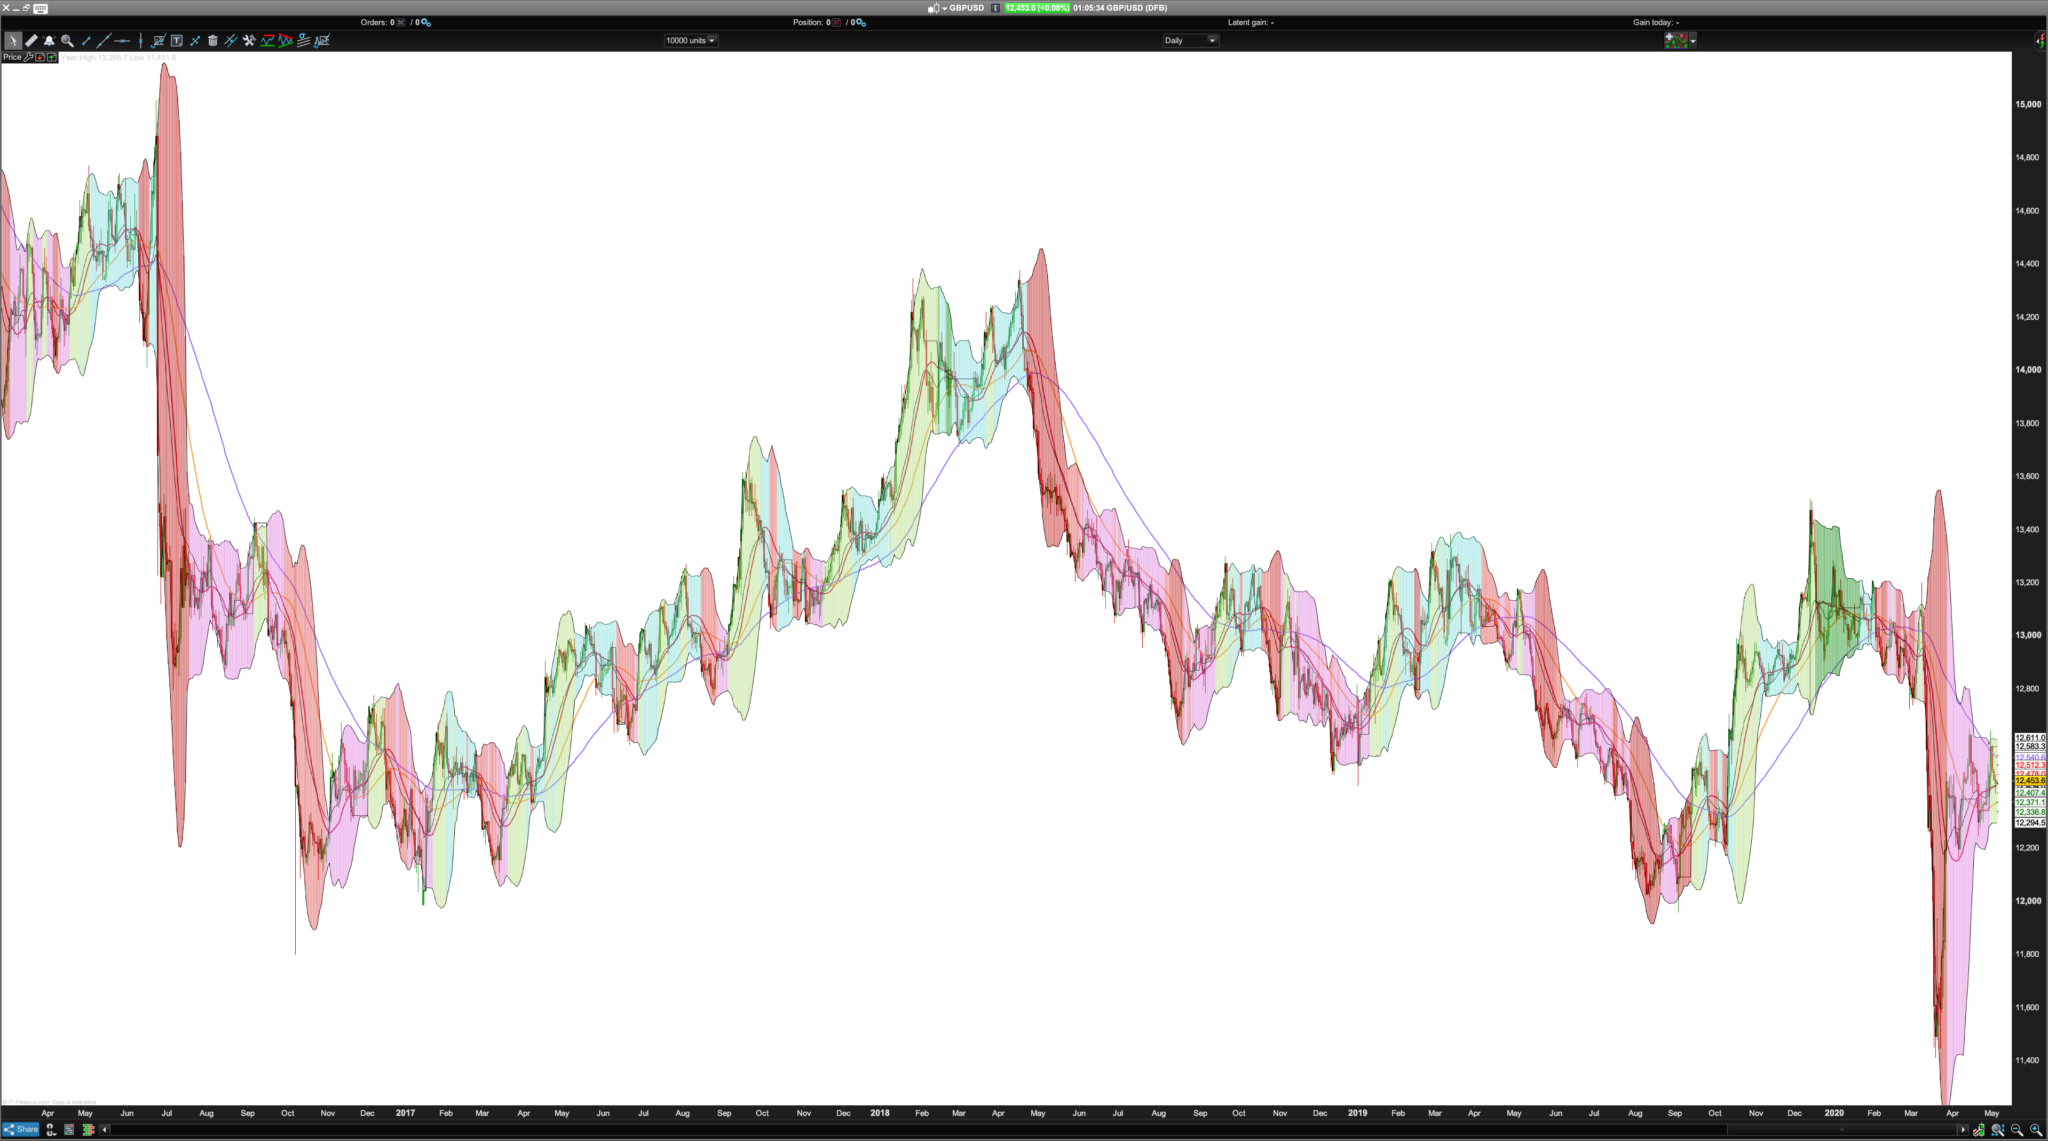
Correction: Showing: Trending and Volatile, Trending and Calm, Ranging and Volatile and Ranging and Calm.
The multicolour multi state indicator shows high and low volatility markets trending either up or down.
Trend is determined by four ALMA moving averages and the volatility is based on a 22 period Williams Vix Fix / Percentile Rank indicator (coded by Vonasi) over 365 days, ranked as a percentage.
I might yet do a version with an advanced ADX indicator to depict ranging markets (both volatile and calm), that was actually the basis for what turned into this idicator.
Anyone who says there isn’t a relationship between volatility and trend hasn’t studied volatility and the options market:
High volatility is synonymous with market bottoms and low volatility with market tops. It’s not a perfect relationship but it is better to know how volatile a market is when you’re entering it and what the potential trend direction might be. A good example of a low volatility top is the peak before the current Covid19 market rout.
Implied volatility (IV) in the options market is measured over 365 days. The IV is derived from the Black Scholes Options Pricing Model. Higher IV (over historic volatility) implies higher options prices. Go long Puts and write/short Calls.
Possible improvements might be to add ranging (volatile and calm) markets and to replace the ALMA for a MA Type #65 Ehler’s Zero Lag moving average from the Average Filter Regression indicator on this forum. Next time!
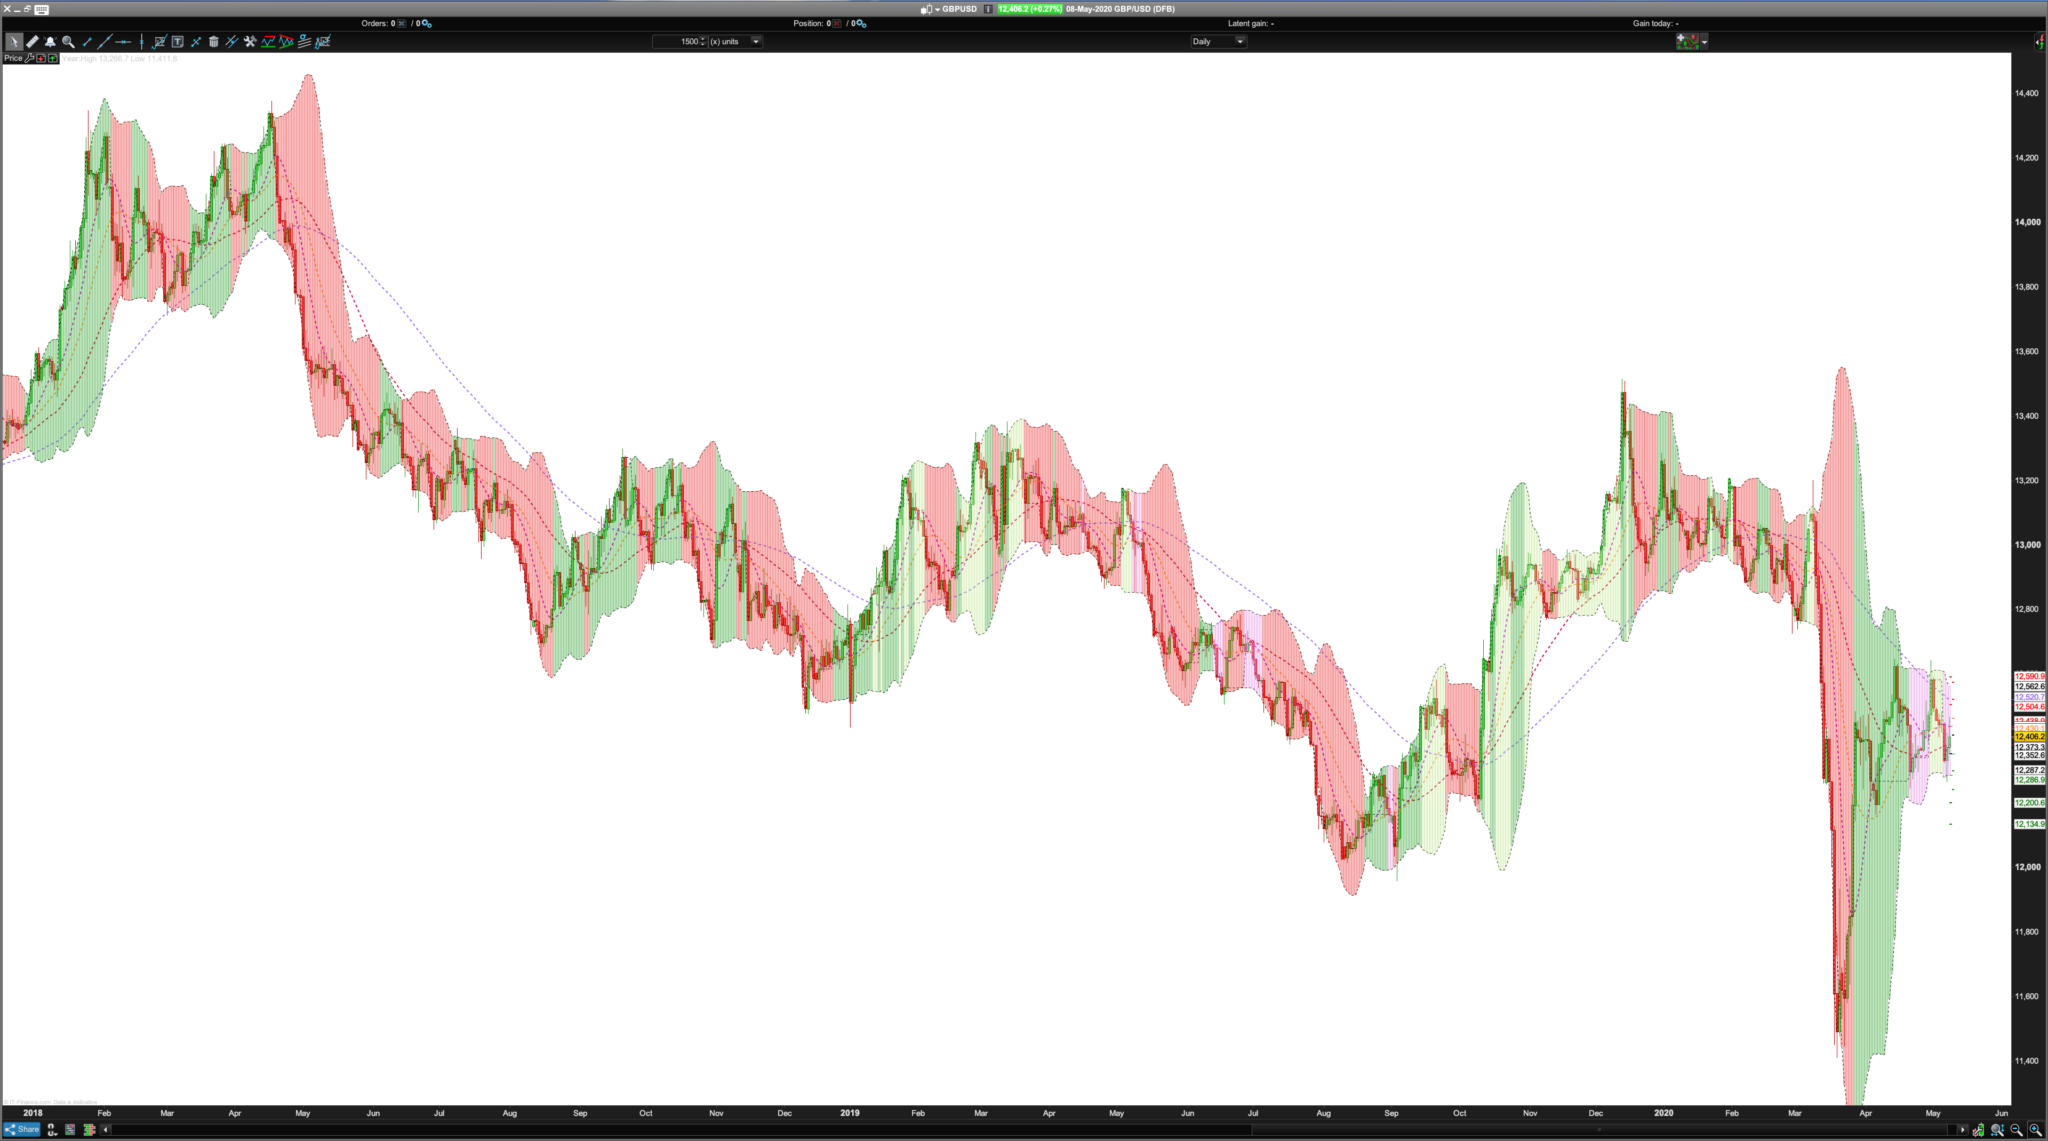
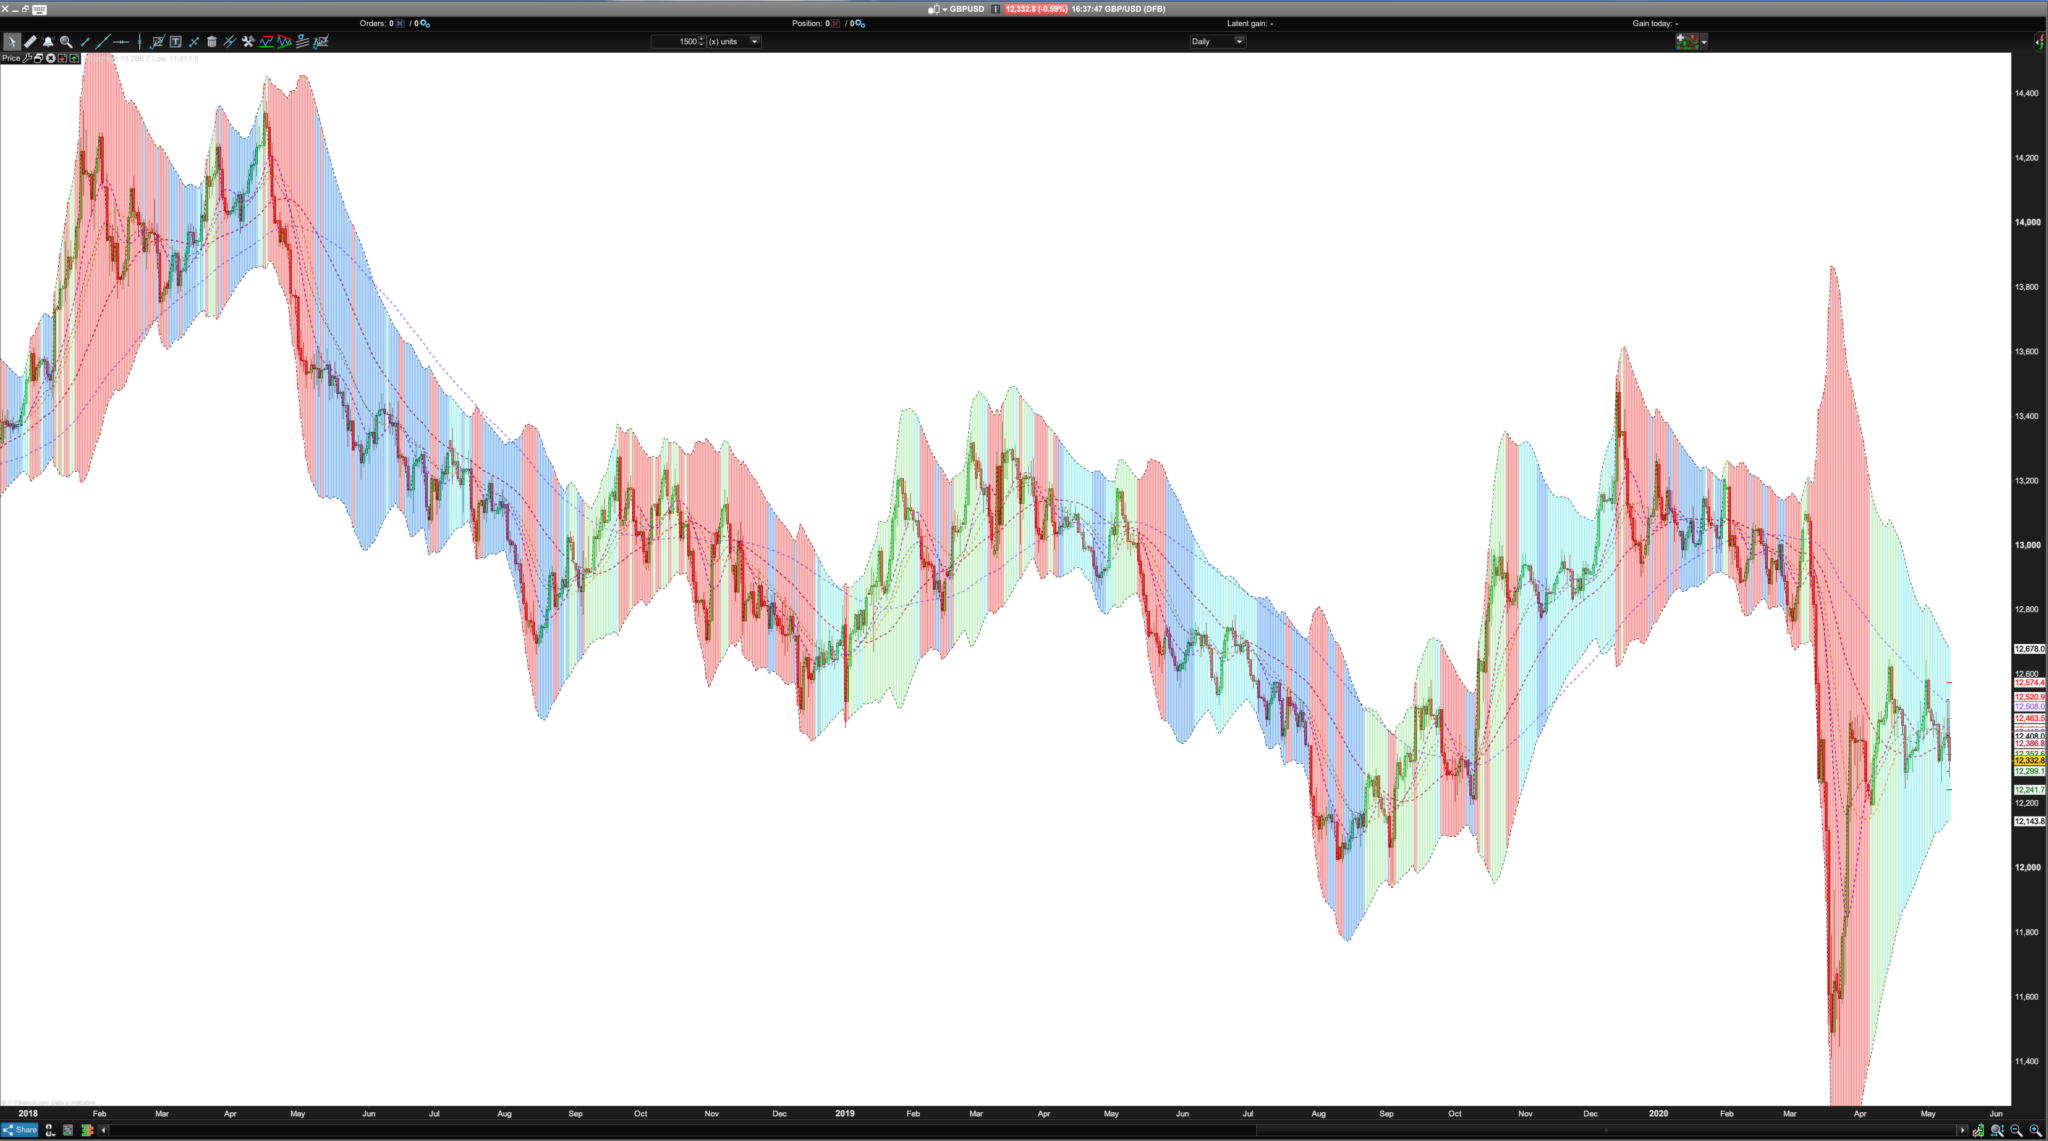
Update:// Bard’s 4x Multicolour Trending/Volatility (No Ranging) //08/05/2019 v1 //P = 20 //bb20 period --- Add in VARIABLES //Dev = 2.0 //std deviation factor --- Add in VARIABLES //X = 75 //background alpha --- Add in VARIABLES //Trending Up and Volatile //Trending Down and Volatile //Trending Up and Calm //Trending Down and Calm DEFPARAM CalculateOnLastBars = 1000 //=================================================================// //ALMA //=================================================================// //VShortMA = 25 //ShortMA = 50 //MediumMA = 100 //LongMA = 200 Period = 25 //start with 50 periods Series = customclose FOR j = 1 TO 4 Sigma = 6 Offset = 0.85 m = ROUND(Offset * (Period - 1)) s = Period / Sigma WtdSum = 0 CumWt = 0 FOR k = 0 TO Period - 1 DO Wtd = EXP(-((k - m) * (k - m)) / (2 * s * s)) WtdSum = WtdSum + Wtd * Series[Period - 1 - k] CumWt = CumWt + Wtd NEXT IF CumWt <= 0 THEN AFR = Series ELSE AFR = WtdSum / CumWt ENDIF IF j = 1 THEN VShortMA = AFR ELSIF j = 2 THEN ShortMA = AFR ELSIF j = 3 THEN MediumMA = AFR ELSE LongMA = AFR ENDIF Period = Period * 2 //doubles the periods NEXT //ALMAve25 = WtdSum / CumWt //ALMAve25 = 0.5*AFR //ALMA25 = 0.5*AFR //Bull Market increase in Prices //BullC1 = Close[0] > ShortMA //BullC2 = Close[0] > MediumMA //BullC3 = Close[0] > LongMA //BullC4 = Close[0] >= (Close[200] * 1.2) //Bear Market decrease in Prices //BearC5 = Close[0] < ShortMA //BearC6 = Close[0] < MediumMA //BearC7 = Close[0] < LongMA //BearC8 = Close[0] <= (Close[200] * 1.2) //If BullC1 = 0 and BullC2 = 0 and BullC3 = 0 and BearC5 = -0 and BearC6 = -0 and BearC7 = -0 then //NoBullorBear = 0 //Endif //=================================================================// //"Williams' VixFix IV R+P //=================================================================// //Implied Volatility Rank and Percentile Indicator — MARKET TOPS //By Vonasi //Date 20191018 //NEED 1000 UNITS FOR AQUA BLUE PEAK OUTS //Settings HiLoPeriod = 365 //Highest/Lowest Period IVperiod = 22 //IVperiod //Inverse Vix Fix - Low IV Proxy //MODIFIED LOW VOL //Inverse Vix Fix - Low IV Proxy //MODIFIED LOW VOL //Correct but worse performing wvfinverse for spotting tops. //wvf = ((high-lowest[IVperiod](close))/(lowest[IVperiod](close)))*100 //High Volatility Market Bottoms - Non Inverse Vix Fix wvf = ((highest[IVperiod](close)-low)/(lowest[IVperiod](close)))*100 //Boundaries upper = highest[HiLoPeriod](wvf) lower = lowest[HiLoPeriod](wvf) //wvflev = 100-((wvf-lower)/(upper-lower)*100) //Doesn't Show Low Vol Tops wvflev = ((wvf-lower)/(upper-lower)*100) //=================================================================// //Implied Volatility Rank and Percentile Indicator — MARKET TOPS //=================================================================// //By Vonasi //Date 20191018 //NEED 1000 UNITS //Settings HiLoPeriod = 365 //Highest/Lowest Period IVperiod = 22 //IVperiod //Inverse Vix Fix - Low IV Proxy //MODIFIED LOW VOL //Correct but worse performing wvfinverse. Not sure if it is worse performing: //wvf = ((high-lowest[IVperiod](close))/(lowest[IVperiod](close)))*100 wvf = ((highest[IVperiod](close)-low)/(lowest[IVperiod](close)))*100 //Boundaries upper = highest[HiLoPeriod](wvf) lower = lowest[HiLoPeriod](wvf) //wvflev = 100-((wvf-lower)/(upper-lower)*100) //Doesn't Show Low Vol Tops wvflev = ((wvf-lower)/(upper-lower)*100) //Percentile rnkCount = 0 count = 0 FOR i = 1 to HiLoPeriod-1 count = count + 1 IF (wvflev[i]) > (wvflev) THEN rnkCount = rnkCount + 1 endif NEXT PercentileRank = 100-(rnkCount/count)*100 //Historic Volatility //HVLength = 22 //annualVol = 365 //periods = 7// 1 = intraday chart 7 = daily chart //Returns = log(close / close[1]) //StdDev = std[HVLength](Returns) //HVol = StdDev * sqrt(annualVol) * 100 //sqrt(annualVol / periods //lowVol = lowest[annualvol](HVol) //HVrankUp = HVol - lowVol //maxVol = highest[annualvol](HVol) //HVrankLow = maxVol - lowVol //HVR = (HVrankUp / HVrankLow)*100 //=================================================================// //=================================================================// //Bollinger //=================================================================// BollUp =Average[PeriodBoll](close)+dev*std[PeriodBoll](close) BollDown = Average[PeriodBoll](close)-dev*std[PeriodBoll](close) //=================================================================// //Trending and Volatile //=================================================================// //1 Trending Up and Volatile = DARK GREEN (0,150,0) //ALMA BULL/BEAR BullC0 = Close[0] > VShortMA BullC1 = Close[0] > ShortMA //BullC2 = Close[0] > MediumMA //BullC3 = Close[0] > LongMA //VixFix1 = (wvflev > 50) PercRankTV = PercentileRank > 50 If BullC0 and BullC1 and PercRankTV then//and BullC2 and BullC3 Indicator = close //Indicator =1 r=0 g=150 b=0 Endif //=================================================================// //2 Trending Down and Volatile = RED (255,0,0) //ALMA BULL/BEAR BearC4 = Close[0] < VShortMA BearC5 = Close[0] < ShortMA //BearC6 = Close[0] < MediumMA //BearC7 = Close[0] < LongMA //VixFix2 = (wvflev > 50) PercRankTV = PercentileRank > 50 If BearC4 and BearC5 and PercRankTV then Indicator = close //Indicator =1 r=255 g=0 b=0 Endif //=================================================================// //Trending and Calm //=================================================================// //3 Trending Up and Calm = LIGHT GREEN (204,255,153) //ALMA BULL/BEAR BullC0 = Close[0] > VShortMA BullC1 = Close[0] > ShortMA BullC2 = Close[0] > MediumMA BullC3 = Close[0] > LongMA //VixFix3 = (wvflev < 50) PercRankTC = PercentileRank < 50 If BullC0 and BullC1 and BullC2 and BullC3 and PercRankTC then Indicator = close //Indicator =1 r=204 g=255 b=153 Endif //=================================================================// //4 Trending Down and Calm = LIGHT PINK (255,153,255) //ALMA BULL/BEAR BearC4 = Close[0] < VShortMA BearC5 = Close[0] < ShortMA BearC6 = Close[0] < MediumMA BearC7 = Close[0] < LongMA //VixFix4 = (wvflev < 50) PercRankTC = PercentileRank < 50 If BearC4 and BearC5 and BearC6 and BearC7 and PercRankTC then Indicator = close //Indicator =1 r=255 g=153 b=255 Endif //=================================================================// max1=BollUp min1=BollDown DRAWCANDLE(max1, min1, max1, min1)coloured(R,G,B,x) RETURN VShortMA coloured (204,0,204,255) style (dottedline,2) as "ALMA 25", ShortMA coloured (255,153,51,255) style (dottedline,2) as "ALMA 50", MediumMA coloured (204,0,51,255) style (dottedline,2) as "ALMA 100", LongMA coloured (153,102,255,255) style (dottedline,2) as "ALMA 200", BollUp style(dottedline) as "BollUp", BollDown style(dottedline) as "BollDown", indicator style(dottedline) as "8x Multicolour Market States" //RETURN HVR coloured(102,179,255) style (line,3) as "Historic Volatility Rank"just showing the first 4 defined market states,
Correction: Showing: Trending and Volatile, Trending and Calm, Ranging and Volatile and Ranging and Calm.
Changes need on the 8x MultiColour Change line 164 to r=153 (previously was a wrong colour) Change line 146 to g=205 (for better definition)This 4x Colour Trend/Range/Volatility/Calm indicator can be used to instantly gauge what kind of market conditions you are in. For example, before the Covid19 market rout in the £/$ you can already see the market was becoming very “skittish” from mid December onwards with lots of red and blue areas which depict higher volatility. The trending colours are red for “Trending and Volatile” and light green for “Trending and Calm.” (Think of trends in terms of red and green as a mnemonic). The indicator is non directional but ALMA moving averages and a Zero Lag Bollinger Band has been constructed around price. The ranging market regime is also split into volatile and calm, coloured in blue and aqua blue respectively, (again try thinking of a calm blue sea as a mnemonic for ranging conditions). Trending or ranging is determined by use of the Damiani Volatmeter to determine the signal to noise ratio, whilst volatility is determined by a percentile rank of the 22 day implied volatility (“Williams Vix Fix”) compared to 365 day highs and lows of implied volatility. Volatile is set at greater than 50% and calm at 50% or less. You can change these if you wish, perhaps only depicting markets that are very volatile and over 75% or even 95%. Good for options traders. I’ve left the effective ALMA Bull/Bear indicator in case you want to experiment with another way of determine a trend. Ditto with the Vix Fix for volatility. No indicator is perfect (feel free to play with the settings) but this does go someway to giving you a more statistically based summation of market conditions thanks to Vonasi’s Williams Vix Fix indicator and Bollinger Bands set at 2 standard deviations to capture 95% of the price distribution — if prices were to follow a normal distribution. They don’t as prices suffer from skew/trends caused by the vagaries of human emotions like fear and greed! “4x Colour Trend/Range/Volatility/Calm”// Bard’s 4x Multicolour Trending/Ranging/Volatile/Calm Damiani //10/05/2019 v3 //Template: 2x Colour Trend/Range Damiani //P = 20 //bb20 period --- Add in VARIABLES //Dev = 2.0 //std deviation factor --- Add in VARIABLES //X = 90 //background alpha --- Add in VARIABLES //TRENDS -- RED/GREEN // 1 Trending and Volatile = RED (204,0,0) // 2 Trending and Calm = LIGHT GREEN (255,153,255) //RANGING OUT AT SEA -- BLUE'S // 3 Ranging and Volatile = BLUE (0,128,255) // 4 Ranging and Calm AQUA BLUE (0,0,255) DEFPARAM CalculateOnLastBars = 2000 //=================================================================// //ALMA //=================================================================// //VShortMA = 25 //ShortMA = 50 //MediumMA = 100 //LongMA = 200 Period = 25 //start with 50 periods Series = customclose FOR j = 1 TO 4 Sigma = 6 Offset = 0.85 m = ROUND(Offset * (Period - 1)) s = Period / Sigma WtdSum = 0 CumWt = 0 FOR k = 0 TO Period - 1 DO Wtd = EXP(-((k - m) * (k - m)) / (2 * s * s)) WtdSum = WtdSum + Wtd * Series[Period - 1 - k] CumWt = CumWt + Wtd NEXT IF CumWt <= 0 THEN AFR = Series ELSE AFR = WtdSum / CumWt ENDIF IF j = 1 THEN VShortMA = AFR ELSIF j = 2 THEN ShortMA = AFR ELSIF j = 3 THEN MediumMA = AFR ELSE LongMA = AFR ENDIF Period = Period * 2 //doubles the periods NEXT //ALMAve25 = WtdSum / CumWt //ALMAve25 = 0.5*AFR //ALMA25 = 0.5*AFR //Bull Market increase in Prices //BullC1 = Close[0] > ShortMA //BullC2 = Close[0] > MediumMA //BullC3 = Close[0] > LongMA //BullC4 = Close[0] >= (Close[200] * 1.2) //Bear Market decrease in Prices //BearC5 = Close[0] < ShortMA //BearC6 = Close[0] < MediumMA //BearC7 = Close[0] < LongMA //BearC8 = Close[0] <= (Close[200] * 1.2) //If BullC1 = 0 and BullC2 = 0 and BullC3 = 0 and BearC5 = -0 and BearC6 = -0 and BearC7 = -0 then //NoBullorBear = 0 //Endif //=================================================================// // ZLJE - Zero Lag John Ehlers //=================================================================// // --- parameters MAType = 0 Series = CustomClose // Period = 15 // --- IF MAType = 65 THEN Period = MAX(Period, 2) alpha = 2 / (1 + Period) per = ROUND((Period - 1) / 2) IF BarIndex < per THEN AFR = Series ELSE AFR = AFR[1] + alpha * (2 * Series - Series[per] - AFR[1]) ENDIF ENDIF //=================================================================// // ELASTIC WEIGHTED MOVING AVERAGE BOLLINGER // //Dev = 1.618 //=================================================================// BollPERIODS = 20 Deviations = 2.57 PRICE = LOG(customclose) alpha = 2/(BollPERIODS+1) // EWMA (EMA) if barindex < BollPERIODS then EWMA = EXPONENTIALAVERAGE[3](PRICE) else EWMA = alpha * PRICE + (1-alpha)*EWMA endif // ELASTIC WEIGHTED STANDARD DEVIATION (ESD) error = PRICE - EWMA dev = SQUARE(error) if barindex < BollPERIODS+1 then var = dev else var = alpha * dev + (1-alpha) * var endif ESD = SQRT(var) // BANDSSAverage[20](close) // BANDS UpperBoll = EXP(EWMA + (Deviations*ESD)) LowerBoll = EXP(EWMA - (Deviations*ESD)) MidBoll = EXP(EWMA) //RETURN MID as "EWMA(EMA)", UB as "+ESD", BB as "-ESD" //=================================================================// //"Williams' VixFix IV R+P //=================================================================// //Implied Volatility Rank and Percentile Indicator — MARKET TOPS //By Vonasi //Date 20191018 //NEED 1000 UNITS FOR AQUA BLUE PEAK OUTS //Settings HiLoPeriod = 365 //Highest/Lowest Period IVperiod = 22 //IVperiod //Inverse Vix Fix - Low IV Proxy //MODIFIED LOW VOL //Inverse Vix Fix - Low IV Proxy //MODIFIED LOW VOL //Correct but worse performing wvfinverse for spotting tops. //wvf = ((high-lowest[IVperiod](close))/(lowest[IVperiod](close)))*100 //High Volatility Market Bottoms - Non Inverse Vix Fix wvf = ((highest[IVperiod](close)-low)/(lowest[IVperiod](close)))*100 //Boundaries upper = highest[HiLoPeriod](wvf) lower = lowest[HiLoPeriod](wvf) //wvflev = 100-((wvf-lower)/(upper-lower)*100) //Doesn't Show Low Vol Tops wvflev = ((wvf-lower)/(upper-lower)*100) //=================================================================// //Implied Volatility Rank and Percentile Indicator — MARKET TOPS //=================================================================// //By Vonasi //Date 20191018 //NEED 1000 UNITS FOR AQUA BLUE PEAK OUTS //Settings HiLoPeriod = 365 //Highest/Lowest Period IVperiod = 22 //IVperiod //Inverse Vix Fix - Low IV Proxy //MODIFIED LOW VOL //Correct but worse performing wvfinverse. Not sure if it is worse performing: //wvf = ((high-lowest[IVperiod](close))/(lowest[IVperiod](close)))*100 wvf = ((highest[IVperiod](close)-low)/(lowest[IVperiod](close)))*100 //Boundaries upper = highest[HiLoPeriod](wvf) lower = lowest[HiLoPeriod](wvf) //wvflev = 100-((wvf-lower)/(upper-lower)*100) //Doesn't Show Low Vol Tops wvflev = ((wvf-lower)/(upper-lower)*100) //Percentile rnkCount = 0 count = 0 FOR i = 1 to HiLoPeriod-1 count = count + 1 IF (wvflev[i]) > (wvflev) THEN rnkCount = rnkCount + 1 endif NEXT PercentileRank = 100-(rnkCount/count)*100 //Historic Volatility //HVLength = 22 //annualVol = 365 //periods = 7// 1 = intraday chart 7 = daily chart //Returns = log(close / close[1]) //StdDev = std[HVLength](Returns) //HVol = StdDev * sqrt(annualVol) * 100 //sqrt(annualVol / periods //lowVol = lowest[annualvol](HVol) //HVrankUp = HVol - lowVol //maxVol = highest[annualvol](HVol) //HVrankLow = maxVol - lowVol //HVR = (HVrankUp / HVrankLow)*100 //=================================================================// //PRC_Damiani Volatmeter | Indicator //=================================================================// //24.04.2017 //Nicolas @ www.prorealcode.com //Sharing ProRealTime knowledge //translated from MT4 indicator code //---Damiani Volatmeter Settings Viscosity=8 //8£/$ //9 //Default=7 //try 5, 2 Sedimentation=90 //90£/$ 60 //Default 50 //try 60 Thresholdlevel=1.2 //1.2£/$ 0.9 1.2 Default 1.1 -- higher values = more bars defined as ranging and aqua lagsupressor=1 //boolean value (default=true) MAtype=2 //MA type variable (2=Weighted average) //Default 2 if barindex>Sedimentation then lagsK=0.5 sa = averagetruerange[Viscosity] s1 = indc[1] s3 = indc[3] if lagsupressor then vol=sa/averagetruerange[Sedimentation]+lagsK*(s1-s3) else vol=sa/averagetruerange[Sedimentation] endif MA1=average[Viscosity,MAtype](typicalprice) D1=0 Sum1=0 for x1=0 to Viscosity-1 do D1=square(typicalprice[x1]-MA1) Sum1=Sum1+D1 anti=sqrt(Sum1/(x1+1)) next MA2=average[Sedimentation,MAtype](typicalprice) D2=0 Sum2=0 for x2=0 to Sedimentation-1 do D2=square(typicalprice[x2]-MA2) Sum2=Sum2+D2 Sedi=sqrt(Sum2/(x2+1)) next antithres=anti/Sedi t = Thresholdlevel t=t-antithres if(vol>t) then volt=vol else volt=vol endif indc=vol endif //return volt coloured(0,200,0) style(line,2) as "volatility meter", t style(line,2) as "threshold level" //=================================================================// //Bollinger - Orig //=================================================================// //BollUp =Average[PeriodBoll](close)+dev*std[PeriodBoll](close) //BollDown = Average[PeriodBoll](close)-dev*std[PeriodBoll](close) //=================================================================// //Conditions //=================================================================// // Trending and Volatile //=================================================================// // 1 Trending and Volatile = RED (255,0,0) //ALMA BULL/BEAR //BullC0 = Close[0] > VShortMA //BullC1 = Close[0] > ShortMA ////BullC2 = Close[0] > MediumMA ////BullC3 = Close[0] > LongMA //VixFix1 = (wvflev > 50) PercRankTV = PercentileRank > 50 If Volt > t and PercRankTV then Indicator = close //Indicator =1 r=255 g=0 b=0 Endif //=================================================================// // Trending and Calm //=================================================================// // 2 Trending and Calm = LIGHT GREEN (255,153,255) //ALMA BULL/BEAR //BullC0 = Close[0] > VShortMA //BullC1 = Close[0] > ShortMA //BullC2 = Close[0] > MediumMA //BullC3 = Close[0] > LongMA //VixFix3 = (wvflev < 50) PercRankTC = PercentileRank < 50 If Volt > t and PercRankTC then Indicator = close //Indicator =1 r=153 g=255 b=153 Endif //=================================================================// // Ranging and Volatile //=================================================================// // 3 Ranging and Volatile = BLUE (0,128,255) PercRankRV = PercentileRank > 50 If Volt < t and PercRankRV then Indicator = close //Indicator =1 r=0 g=128 b=255 Endif //=================================================================// // Ranging and Calm //=================================================================// // 4 Ranging and Calm AQUA BLUE (0,0,255) PercRankRC = PercentileRank < 50 If Volt < t and PercRankRC then Indicator = close //Indicator =1 r=102 g=255 b=255 Endif //=================================================================// max1=UpperBoll min1=LowerBoll DRAWCANDLE(max1, min1, max1, min1)coloured(R,G,B,x) RETURN VShortMA coloured (204,0,204,255) style (dottedline,2) as "ALMA 25", ShortMA coloured (255,153,51,255) style (dottedline,2) as "ALMA 50", MediumMA coloured (204,0,51,255) style (dottedline,2) as "ALMA 100", LongMA coloured (153,102,255,255) style (dottedline,2) as "ALMA 200", UpperBoll style(dottedline) as "BollUp", LowerBoll style(dottedline) as "BollDown", MidBoll style(dottedline) as "MidBoll", indicator style(dottedline) as "8x Multicolour Market States",0 //RETURN HVR coloured(102,179,255) style (line,3) as "Historic Volatility Rank" -
AuthorPosts
- You must be logged in to reply to this topic.
8x Multicolour Market States
ProBuilder: Indicators & Custom Tools
Summary
This topic contains 28 replies,
has 5 voices, and was last updated by ![]() Bard
Bard
6 years, 1 month ago.
Topic Details
| Forum: | ProBuilder: Indicators & Custom Tools |
| Language: | English |
| Started: | 05/05/2020 |
| Status: | Active |
| Attachments: | 10 files |
About personal data collected
The information collected on this form is stored in a computer file by ProRealCode to create and access your ProRealCode profile. This data is kept in a secure database for the duration of the member's membership. They will be kept as long as you use our services and will be automatically deleted after 3 years of inactivity. Your personal data is used to create your private profile on ProRealCode. This data is maintained by SAS ProRealCode, 407 rue Freycinet, 59151 Arleux, France. If you subscribe to our newsletters, your email address is provided to our service provider "MailChimp" located in the United States, with whom we have signed a confidentiality agreement. This company is also compliant with the EU/Swiss Privacy Shield, and the GDPR. For any request for correction or deletion concerning your data, you can directly contact the ProRealCode team by email at privacy@prorealcode.com If you would like to lodge a complaint regarding the use of your personal data, you can contact your data protection supervisory authority.