Salut,
I’m looking for advise on how to code a screener that identifies a pattern of 2 higher low and 2 higher high.
The idea is to build a screener where I select upward trending assets characterized by 2 significant higher high and 2 higher low, that are on a sweet spot to be bought
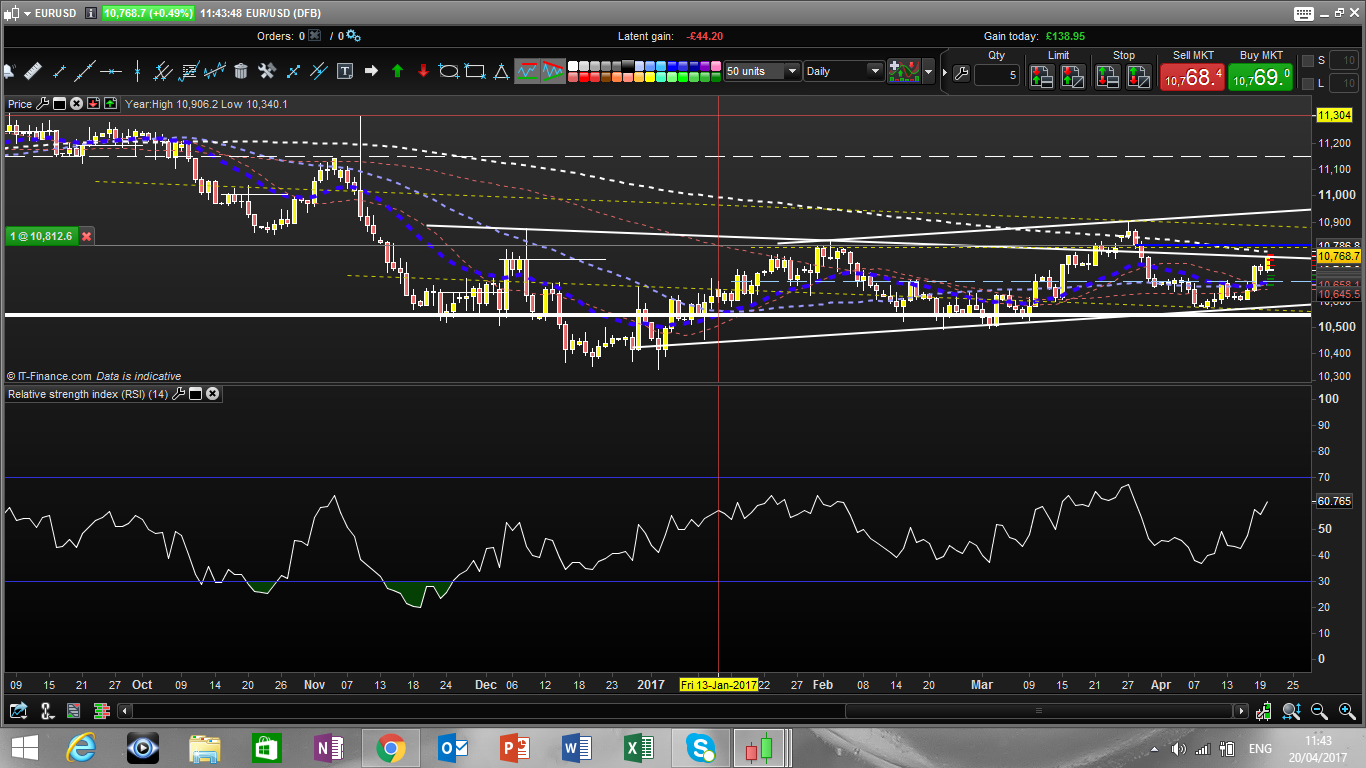
My idea ( which I heard from a trader) is to buy when RSI is below 40 ( see the example on EUR USD below)
Of course the same for 2 lower high and 2 lower low where I would sell if RSI is > 60
Many thanks
It would be worth also for the higher highs, higher lows including two lows at same or very close % same before the first higher high. Same logic for Lower Lows, lower highs.
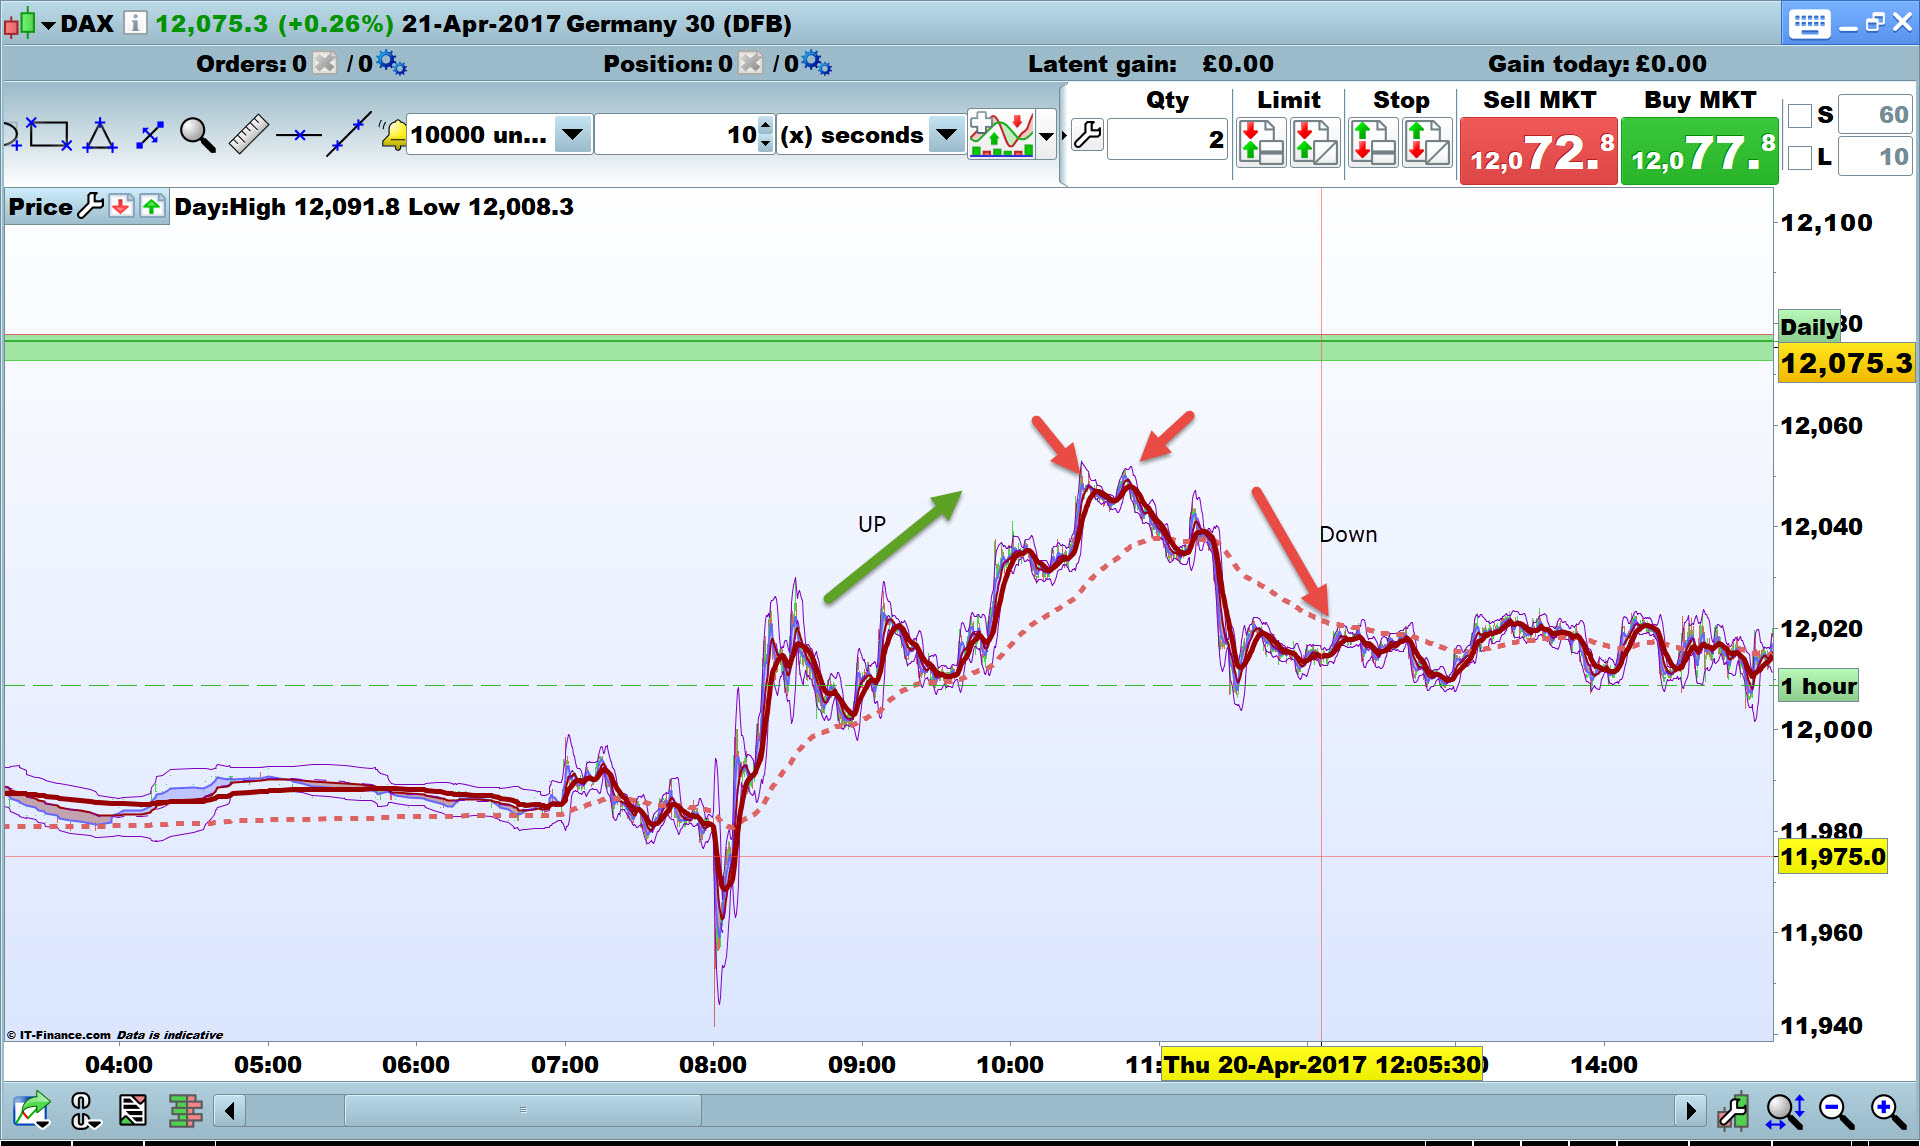
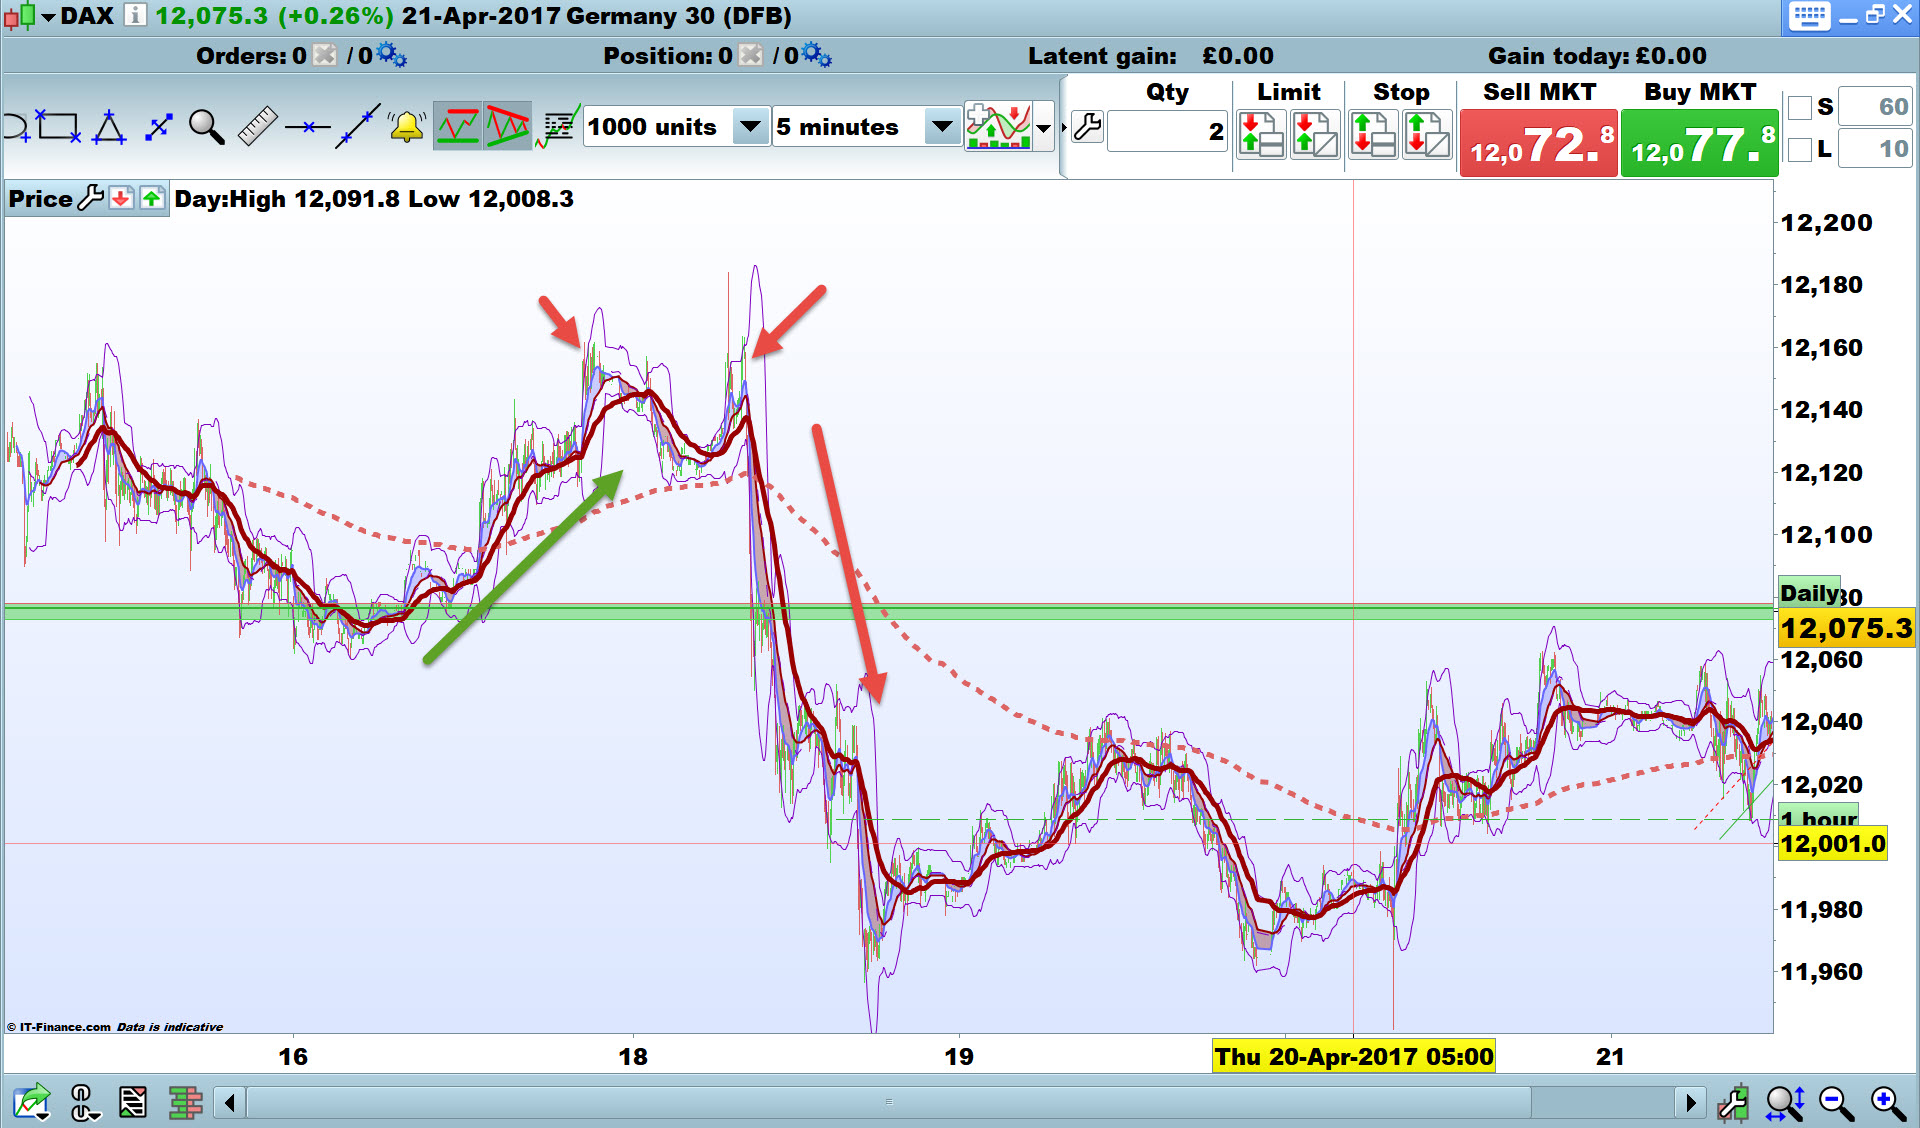
I have noticed the above pattern countless times (two lows same / close % at end of DOWN, OR two highs same / close% at end of an UP) as a turning point / change of trend. This can occur across all timeframes, but I tend to see it more at lower TFs as that is what I use when manual trading (5m, 1m, 10sec, 6 sec).
Now I read your post again you are looking for an established trend to get in and go higher? My pattern would signal a turning point.
As the code has similarities, maybe whoever codes it up could do mine also?
Ahhh apologies Francesco … I feel like I’ve hijacked your Thread a bit now! Whoever does it can tell me to raise my own Thread if there is no synergy / ease of coding for them??
Regards
GraHal
No apologies GraHal
“Now I read your post again you are looking for an established trend to get in and go higher? My pattern would signal a turning point”
Yes my idea is to get in WITH THE TREND when there is an estabilished trend and a meaningful correction that in my mind is when
Upward trend -> RSI crosses 40 from above -> go long
Downward trend -> RSI crosses 60 from below -> go short.
This is for long time frame 4h or 1d.
Cheers
I can help code both of your pattern screener, it’s a bit late now but could you please give me more details (screenshots please!). Thanks.
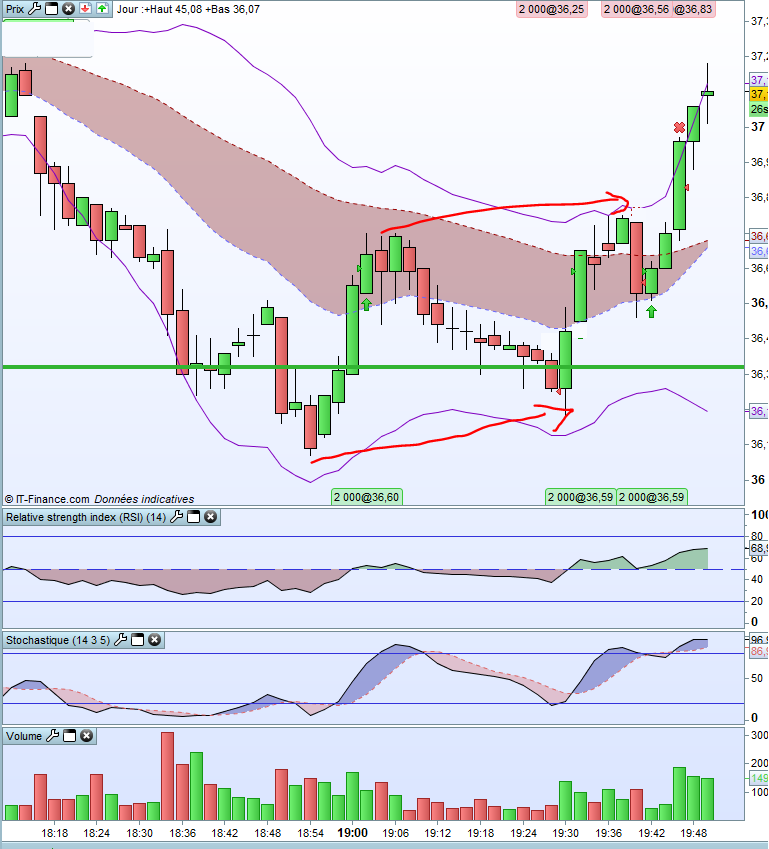
Thank you Nicolas, I attach one example of what I meant for the bullish case (2 higher highs, 2 lower lows, RSI crossing 40 from below)
No attachment Francesco 🙂
Also I’ll do mine by tonight.
Attached are mine Nicolas … thank you so much!
GraHal
@francesco78
I made something quite similar this weekend in this topic: https://www.prorealcode.com/topic/coding-help-required-using-oscillator-for-price-action-trading/ but with a stochastic, sounds almost the same, I believe you could sort it to make your own with the RSI.
@GraHal
Double top / bottom?
Thank you Nicolas, will have a look this afternoon.
Nicolas yes I also thought double top / bottom when I was specifically looking for the pattern.
I did a quick search on the site, but didn’t see a screener … I’ll have another look.
I’ll also look for head and shoulders / reverse .. I’m sure you have done them?
Thanks
GraHal
PS Just found somebody else asking … remains unanswered so maybe you haven’t?
https://www.prorealcode.com/topic/doubletop-saerch/
What I would really like is to understand how to order Highest in a predetermined period.
Lets say I have 50 days periods, is there a way to rank all the highs with a time associated to them?
basically from a coding point of view should be similar to the codes used to do the trandline on the chart of PRT.
Is it possible or it would be feasable only through professional help?
Many thanks
Francesco
@GraHal
Still not done double bottom or double top, I add this on my todo list!
@Francesco
You mean, rank all the last highest high that occurred during the last 50 periods, in a list?
Hi Nicolas, yes sort of.
Im not a programmer by education but I was thinking the following.
1- create an array with ranked highs with their time of occurence
2-create an array with ranked lows with their time of occurence.
3- take the highest 2 highs, if the second highest is significantly above a short term moving average and sufficiently separated by the highest high and if its time of occurence is before the time of occurence of the highest high then its a candidate for a bull trend.
4. Repeat the same for the lows.
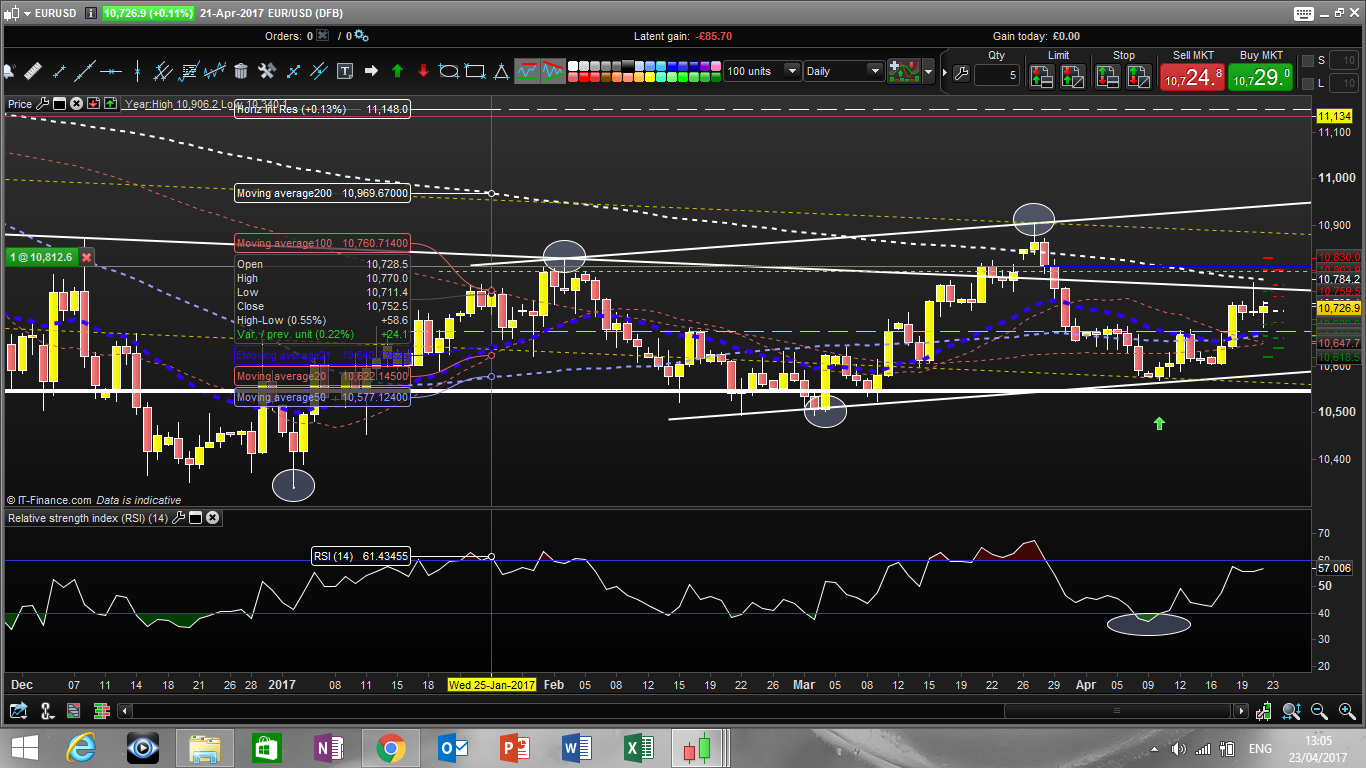
All this is to be able to screen prices that have been experiencing a bull or bear pattern of lower lows higher highs as depicted in the picture I posted.
If you have an other idea please lets discuss it. I think it will be a very powerful screener to find oversold price in a bull trend or overbought price in a bear trend.
Many thanks!
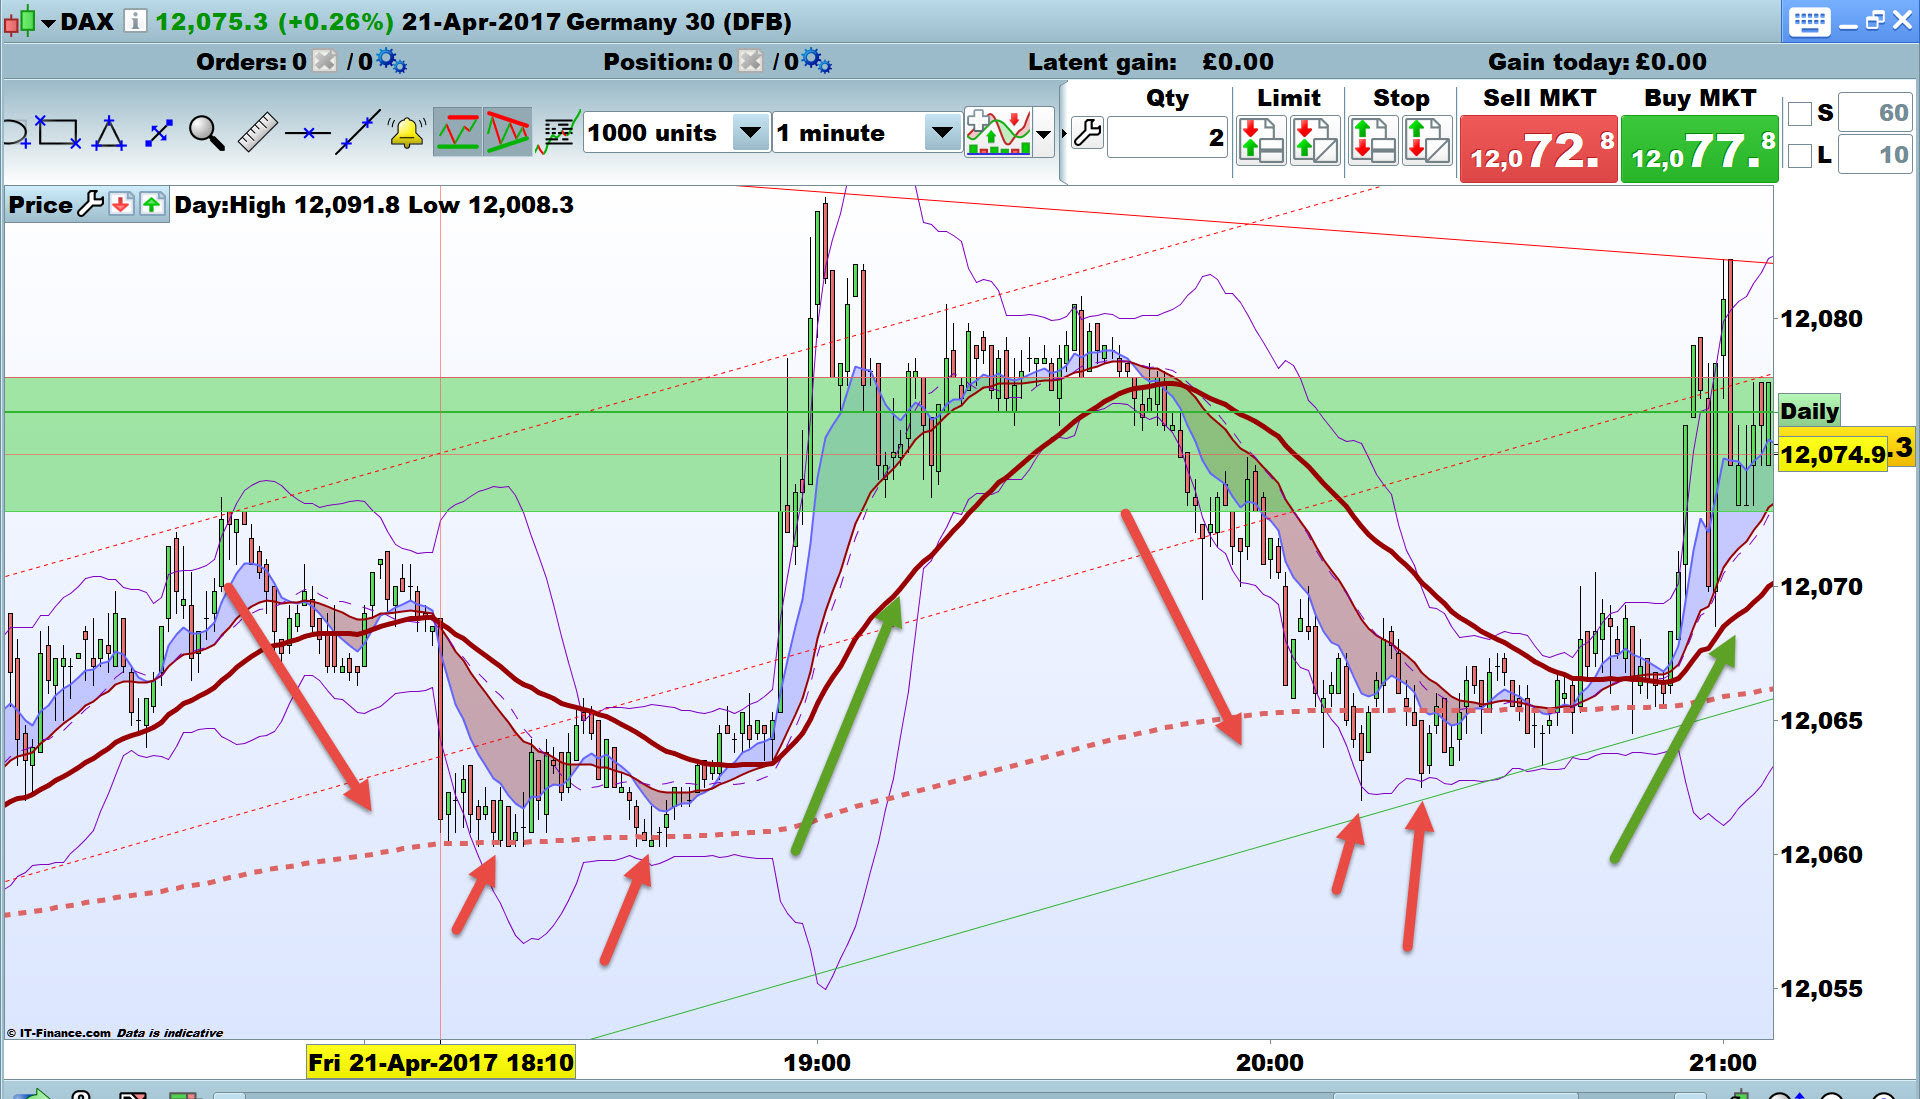
another exemple of higher low and higher high after a huge downtrend. Idea is to buy near moving average once this reversal trend is established. The array idea of Franscesco is a good, but I don’t think that exist under prorealcode? would be a nice addition to the coding to be able to code array of limited size