Hi,
Im testing a strategy based on Center of Gravity by Belkhayate and MBFX Timing 2.
Indicators found here:
Center of Gravity
https://www.prorealcode.com/prorealtime-indicators/mbfx-timing-v2/
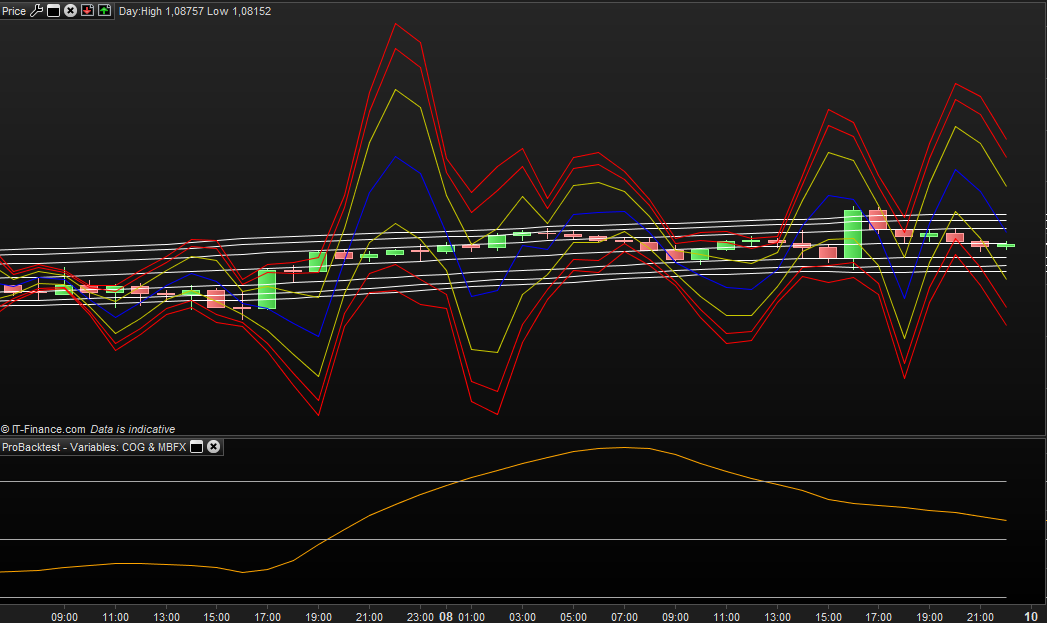
Instead of calling the indicators I’ve included them in the code for easier optimisation and faster loading. But I have an issue with the GRAPHONPRICE function for the COG indicator. The lines are not plotted the same as if I were to add the indicator on price chart settings manually. In the screenshot I have included COG both in code and Price Chart settings.
I’m a bit stuck and would be grateful for some help, also any thoughts or suggestions regarding the strategy is very much appreciated.
My sauna is warm and beer is cold…I’ll be right back…
// COG & MBFX Timin v2
// EUR/USD 1h/10m/15m (need to test)
// https://www.prorealcode.com/topic/center-of-gravity/
// https://www.prorealcode.com/prorealtime-indicators/mbfx-timing-v2/

DEFPARAM CUMULATEORDERS = false
DEFPARAM PRELOADBARS = 200


//==== Center of Gravity Belkhayate
p3= 5
k=p3 // Variable p3= 65
de48=DPO[k*2] (close)
if de48=de48[1] and de48[1]=de48[ 2] and de48[2]<>de48[ 3] then
flag=1
endif
n=(k*2)-4
p=(n/2)-1
d100=DPO[n]( close)
moy100=close- d100
co=(moy100-moy100[ 1]+(close[ p])/n)*n
if flag[1]=1 and flag[2]=0 then
hh=co[1]
endif
if flag[1]=1 then
co=hh
endif
n=p3 mod 2
p=(p3-n)/2
p3=(2*p)+1
once x=0
w=abs((p-x)/ p)
w=w*w*w
w=(1-w)
w=w*w*w
x=x+1
if barindex=p3 then
a=0
b=0
e=0
for i=1 to p3
z=barindex-i+ 1
a=a+w[z]
b=b+w[z]*(i)
e=e+(i)*(i)* w[z]
next
endif
if barindex>p3 then
c=0
d=0
for i=1 to p3
z=barindex-i+ 1
c=c+co[p3+p- i]*w[z]
d=d+co[p3+p- i]*w[z]*( i)
next
endif
alpha=(a*d-b* c)/(a*e-b* b)
beta=(c*e-b* d)/(a*e-b* b)
lowess=alpha* (p+1)+beta
if barindex < p3*2 then
lowess=undefined
endif

zz = close - lowess
zzsigma = STD[p3](zz)
bb1 = lowess + zzsigma
bb2 = lowess +1.618* zzsigma
bb3 = lowess +2* zzsigma
bl1 = lowess - zzsigma
bl2 = lowess - 1.618* zzsigma
bl3 = lowess - 2* zzsigma

graphonprice lowess coloured (0,0,255)
graphonprice bb1 coloured (200,200,0)
graphonprice bb2 coloured (255,0,0)
graphonprice bb3 coloured (255,0,0)
graphonprice bl1 coloured (200,200,0)
graphonprice bl2 coloured (255,0,0)
graphonprice bl3 coloured (255,0,0)

//===========================================================

//=== RC_MBFX timing 2 | indicator ==========================
//06.05.2020
//Nicolas @ www.prorealcode.com
//Sharing ProRealTime knowledge
//converted from MT4 version


// --- settings
Len = 21 //7
Filter = 0.0
// --- end of settings

li224=0
if (ld8 = 0.0) then
ld8 = 1.0
ld16 = 0.0
if (Len - 1 >= 5) then
ld0 = Len - 1.0
else
ld0 = 5.0
endif
ld80 = 100.0 * ((High[li224] + Low[li224] + Close[li224]) / 3.0)
ld96 = 3.0 / (Len + 2.0)
ld104 = 1.0 - ld96
else
if (ld0 <= ld8) then
ld8 = ld0 + 1.0
else
ld8 = ld8+1.0
endif
ld88 = ld80
ld80 = 100.0 * ((High[li224] + Low[li224] + Close[li224]) / 3.0)
ld32 = ld80 - ld88
ld112 = ld104 * ld112 + ld96 * ld32
ld120 = ld96 * ld112 + ld104 * ld120
ld40 = 1.5 * ld112 - ld120 / 2.0
ld128 = ld104 * ld128 + ld96 * ld40
ld208 = ld96 * ld128 + ld104 * ld208
ld48 = 1.5 * ld128 - ld208 / 2.0
ld136 = ld104 * ld136 + ld96 * ld48
ld152 = ld96 * ld136 + ld104 * ld152
ld56 = 1.5 * ld136 - ld152 / 2.0
ld160 = ld104 * ld160 + ld96 * Abs(ld32)
ld168 = ld96 * ld160 + ld104 * ld168
ld64 = 1.5 * ld160 - ld168 / 2.0
ld176 = ld104 * ld176 + ld96 * ld64
ld184 = ld96 * ld176 + ld104 * ld184
ld144 = 1.5 * ld176 - ld184 / 2.0
ld192 = ld104 * ld192 + ld96 * ld144
ld200 = ld96 * ld192 + ld104 * ld200
ld72 = 1.5 * ld192 - ld200 / 2.0
if (ld0 >= ld8 and ld80 <> ld88) then
ld16 = 1.0
endif
if (ld0 = ld8 and ld16 = 0.0) then
ld8 = 0.0
endif
endif

if (ld0 < ld8 and ld72 > 0.0000000001) then
ld24 = 50.0 * (ld56 / ld72 + 1.0)
if (ld24 > 100.0) then
ld24 = 100.0
endif
if (ld24 < 0.0) then
ld24 = 0.0
endif
else
ld24 = 50.0
endif

if (ld24>ld24[1]- Filter) then
dirbar=1
r=0
g=128
endif
if (ld24<ld24[1]+Filter) then
dirbar=-1
r=255
g=165
endif
if (ld24=ld24[1]+Filter) then
dirbar=0
endif
if dirbar<>dirbar[1] then
r=255
g=255
endif

graph ld24 coloured(r,g,0) as "MBFX timing"
graph 70 coloured(168,168,168)
graph 30 coloured(168,168,168)
graph 50 coloured(168,168,168)

// Conditions to enter long positions
IF (close crosses over bl3) AND (ld24<30) THEN
BUY 1 CONTRACTS AT MARKET
ENDIF


// Conditions to enter short positions
IF (close crosses under bb3) AND (ld24>70) THEN
SELLSHORT 1 CONTRACTS AT MARKET
ENDIF

// Stops and targets
//SET STOP PLOSS
//SET TARGET PPROFIT

// trailing stop atr
once trailingstoptype     = 1    // trailing stop - 0 off, 1 on

once trailingstoplong     = 3    // trailing stop atr relative distance
once trailingstopshort    = 3    // trailing stop atr relative distance

once atrtrailingperiod    = 16   // atr parameter value
once minstop              = 7   // minimum trailing stop distance
//----------------------------------------------
atrtrail = averagetruerange[atrtrailingperiod]((close/10)*pipsize)/1000
//atrtrail=averagetruerange[atrtrailingperiod]((close/1)*pipsize) (forex)
tgl = round(atrtrail*trailingstoplong)
tgs = round(atrtrail*trailingstopshort)
if trailingstoptype = 1 then
//
if not onmarket or ((longonmarket and shortonmarket[1]) or (longonmarket[1] and shortonmarket)) then
maxprice = 0
minprice = close
newsl = 0
endif
//
if longonmarket then
maxprice = max(maxprice,close)
if maxprice-tradeprice(1)>=tgl*pointsize then
if maxprice-tradeprice(1)>=minstop then
newsl = maxprice-tgl*pointsize
else
newsl = maxprice - minstop*pointsize
endif
endif
endif
//
if shortonmarket then
minprice = min(minprice,close)
if tradeprice(1)-minprice>=tgs*pointsize then
if tradeprice(1)-minprice>=minstop then
newsl = minprice+tgs*pointsize
else
newsl = minprice + minstop*pointsize
endif
endif
endif
//
if longonmarket then
if newsl>0 then
sell at newsl stop
endif
if newsl>0 then
if low < newsl then
sell at market
endif
endif
endif
//
if shortonmarket then
if newsl>0 then
exitshort at newsl stop
endif
if newsl>0 then
if high > newsl then
exitshort at market
endif
endif
endif
//graphonprice newsl coloured(0,0,255,255) as "trailingstop atr"
endif