I asked in the past if it was possible to consider the ProRealTrend automatic detections but seems it’s not.
Considering that, is there a way to code support and resistance in general for the charts? Or at least something similar to these “hot zones” for the prices?
It could be helpful for the development of the strategies, especially for forex.
A Donchian channel can work well for that:
//Donchian Channel
Upper = HIGHEST[10](HIGH[1])
Lower = LOWEST[10](LOW[1])
Middle = (Upper + Lower) / 2
c1 = close > Upper//breakout above resistance
c2 = close < Lower//breakdown below support
Adjust the number for how many bars to look back
Please describe how to find those support and resistance zones, you should start from the beginning.. 🙂
you should start from the beginning
July 8th, 1932 the Dow closed at 41.22 – that’s a pretty safe support level. I’ll start to get worried if we fall below that.
that’s a pretty safe support level
I reckon we may see the DJI around 23,500 as a floor before we start to go back up again?
Yeah could be … there’s a rising trend line at around 24,000, but still, takes a brave man to call it. I’ve got my stoploss at the 1932 low, so I know I’m safe. 😉
(nice bounce at the opening bell today, maybe it’s up from here?)
maybe it’s up from here?)
Most likely a sucker’s rally just like the same price action in the last few days between 2:30 and 3:00 ish? i
First of all, thanks all of you for the contibutions and the participatory spirit. That always remind me how beautiful this community is.
Coming back to the topic, i was talking about something very “dynamic”: the price touches n times a x wide zone (number of touches and width of the zone to be optimized for the specific timeframes of reference). Then the system “knows” that the n times touched and x wide zone is a support/resistance and i can operate on that.
The VERY PROBLEM with this idea is that could be very difficult to coding the spot of the obliques s/r, because of the inability to find a common price touch area.
I will read your guys topics and indicators suggestions as soon as possible, maybe i will find something also more interesting than this basic idea 🙂
To be considered over n and x, in a y number of last bars/time in order to “reset” support and resistance levels when a breakout occurs.
Thanks, i will study all the cases and try to develope the strategy I have in mind.
If someone has more hints it’s welcome 🙂
I think that one was great: https://www.prorealcode.com/prorealtime-indicators/zigzag-supdem-supply-and-demand-zones/
But you’ll have to change the zigzag indicator to something else to be able to use the code in ProOrder. I heard that zigzag would be usable in the future but i’m not sure if it is in the pipe or not.
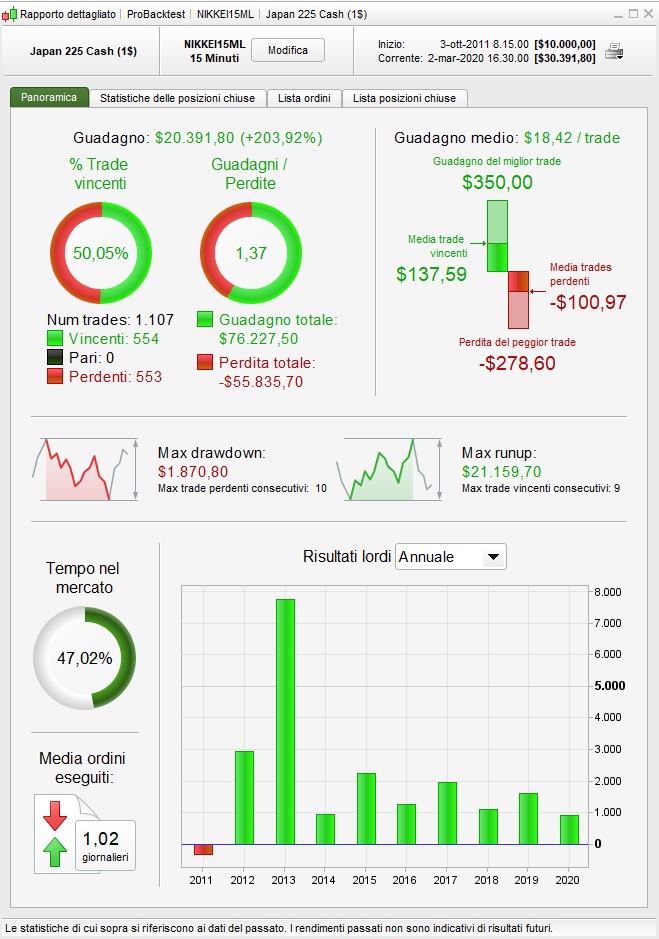
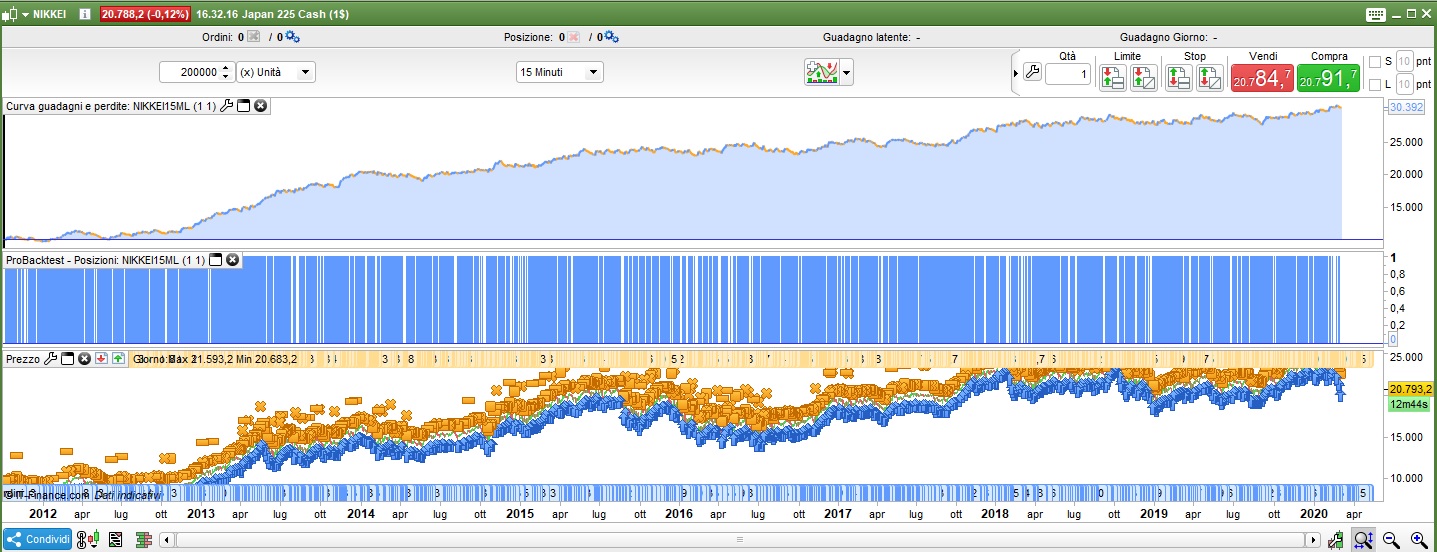
Here’s a first try on NIKKEI 15M. Not so bad also on robustness test, put it on demo test.
defparam cumulateorders = false

once longtrading=1
once shorttrading=0

// Robustness Tester
once j = 0
once flag = 1

if flag = 1 then
j = j + 1
if j > qty then
flag = -1
j = j - 1
endif
endif

if flag = -1 then
j = j - 1
if j = 0 then
j = j + random
flag = 1
endif
endif

tradeon = 1
if opendate >= 20000101 then
if barindex mod qty = 0 or barindex mod qty = j then
tradeon = 1
endif
endif

// General Settings
EMA1 = exponentialaverage[10](close)
EMA2 = exponentialaverage[70](close)
bullish = close>EMA1 and close>EMA2 and EMA1>EMA2

EMA1 = exponentialaverage[10](close)
EMA2 = exponentialaverage[70](close)
bearish = close<EMA1 and close<EMA2 and EMA1<EMA2

// Strategy Settings
f = 10
c1=high[f] >= highest[(f)*2+1](high)
c2=low[f] <= lowest[(f)*2+1](low)

if longtrading then
// Long
if bullish and tradeon then
if c2 then
buy 1 contracts at market
endif
endif
endif

if shorttrading then
// Short
if bearish and tradeon then
if c1 then
sellshort 1 contracts at market
endif
endif
endif

// Stops and Targets
set stop loss 100
set target profit 350

// Breakeven
StartBreakeven = 100
PointsToKeep = 25

if not onmarket then
BreakevenLevel=0
endif

// Breakeven Long
if longonmarket and close-tradeprice(1)>=startBreakeven*pipsize then
BreakevenLevel = tradeprice(1)+PointsToKeep*pipsize
endif

if BreakevenLevel>0 then
sell at BreakevenLevel stop
endif

// Breakeven Short
if shortonmarket and tradeprice(1)-close>startBreakeven*pipsize then
BreakevenLevel = tradeprice(1)-PointsToKeep*pipsize
endif

if BreakevenLevel>0 then
exitshort at BreakevenLevel stop
endif