

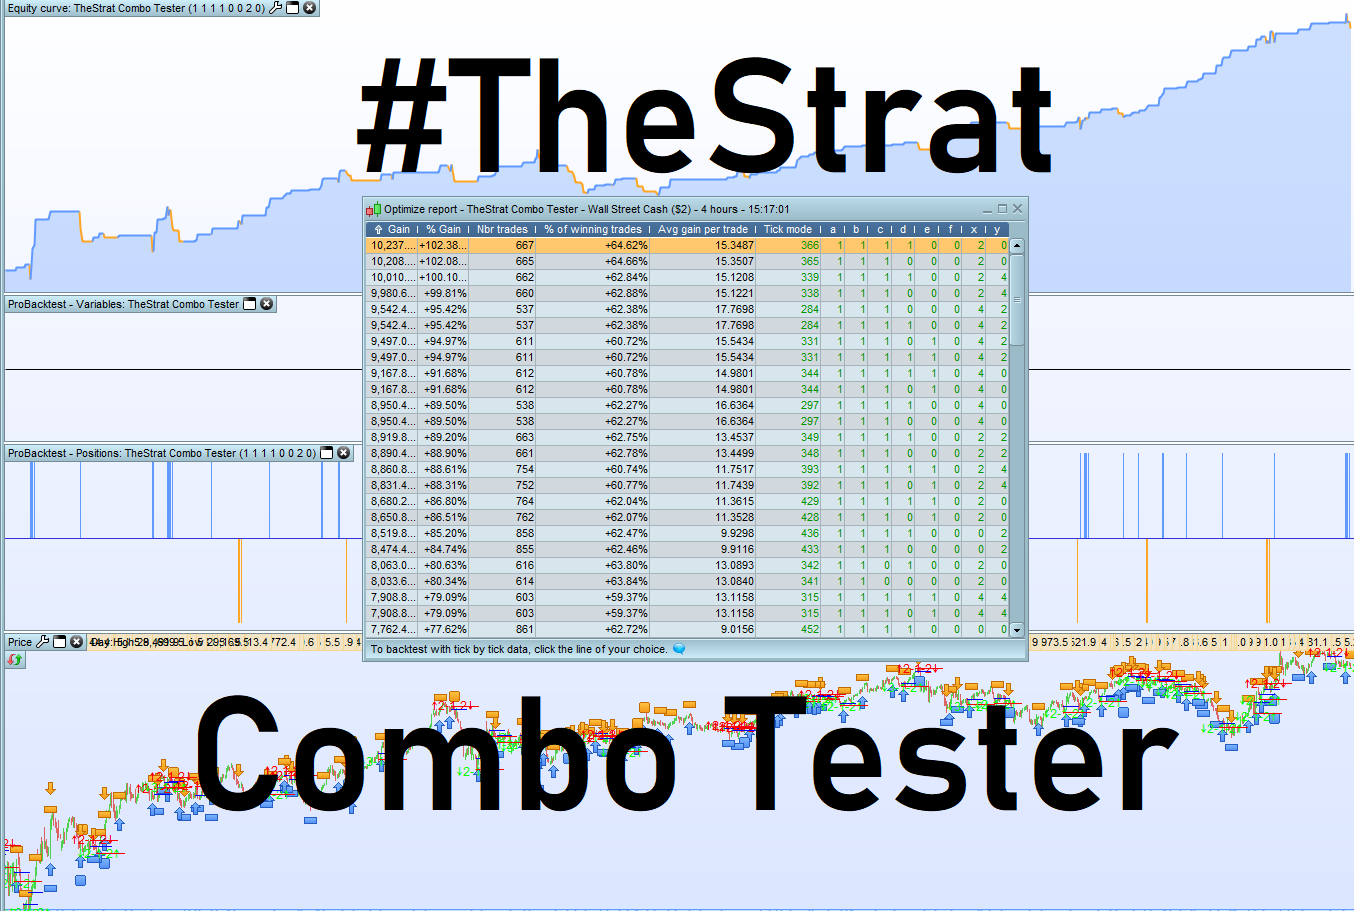
#TheStrat Combo Tester
This strategy is an add-on to the #TheStrat Reversals indicator (also posted in the library) which is a dedication to the work of @RobInTheBlack (Twitter Handle) who has helped countless traders with this pure price action based strategy that he developed over the past 27 years of trading, It is called #TheStrat
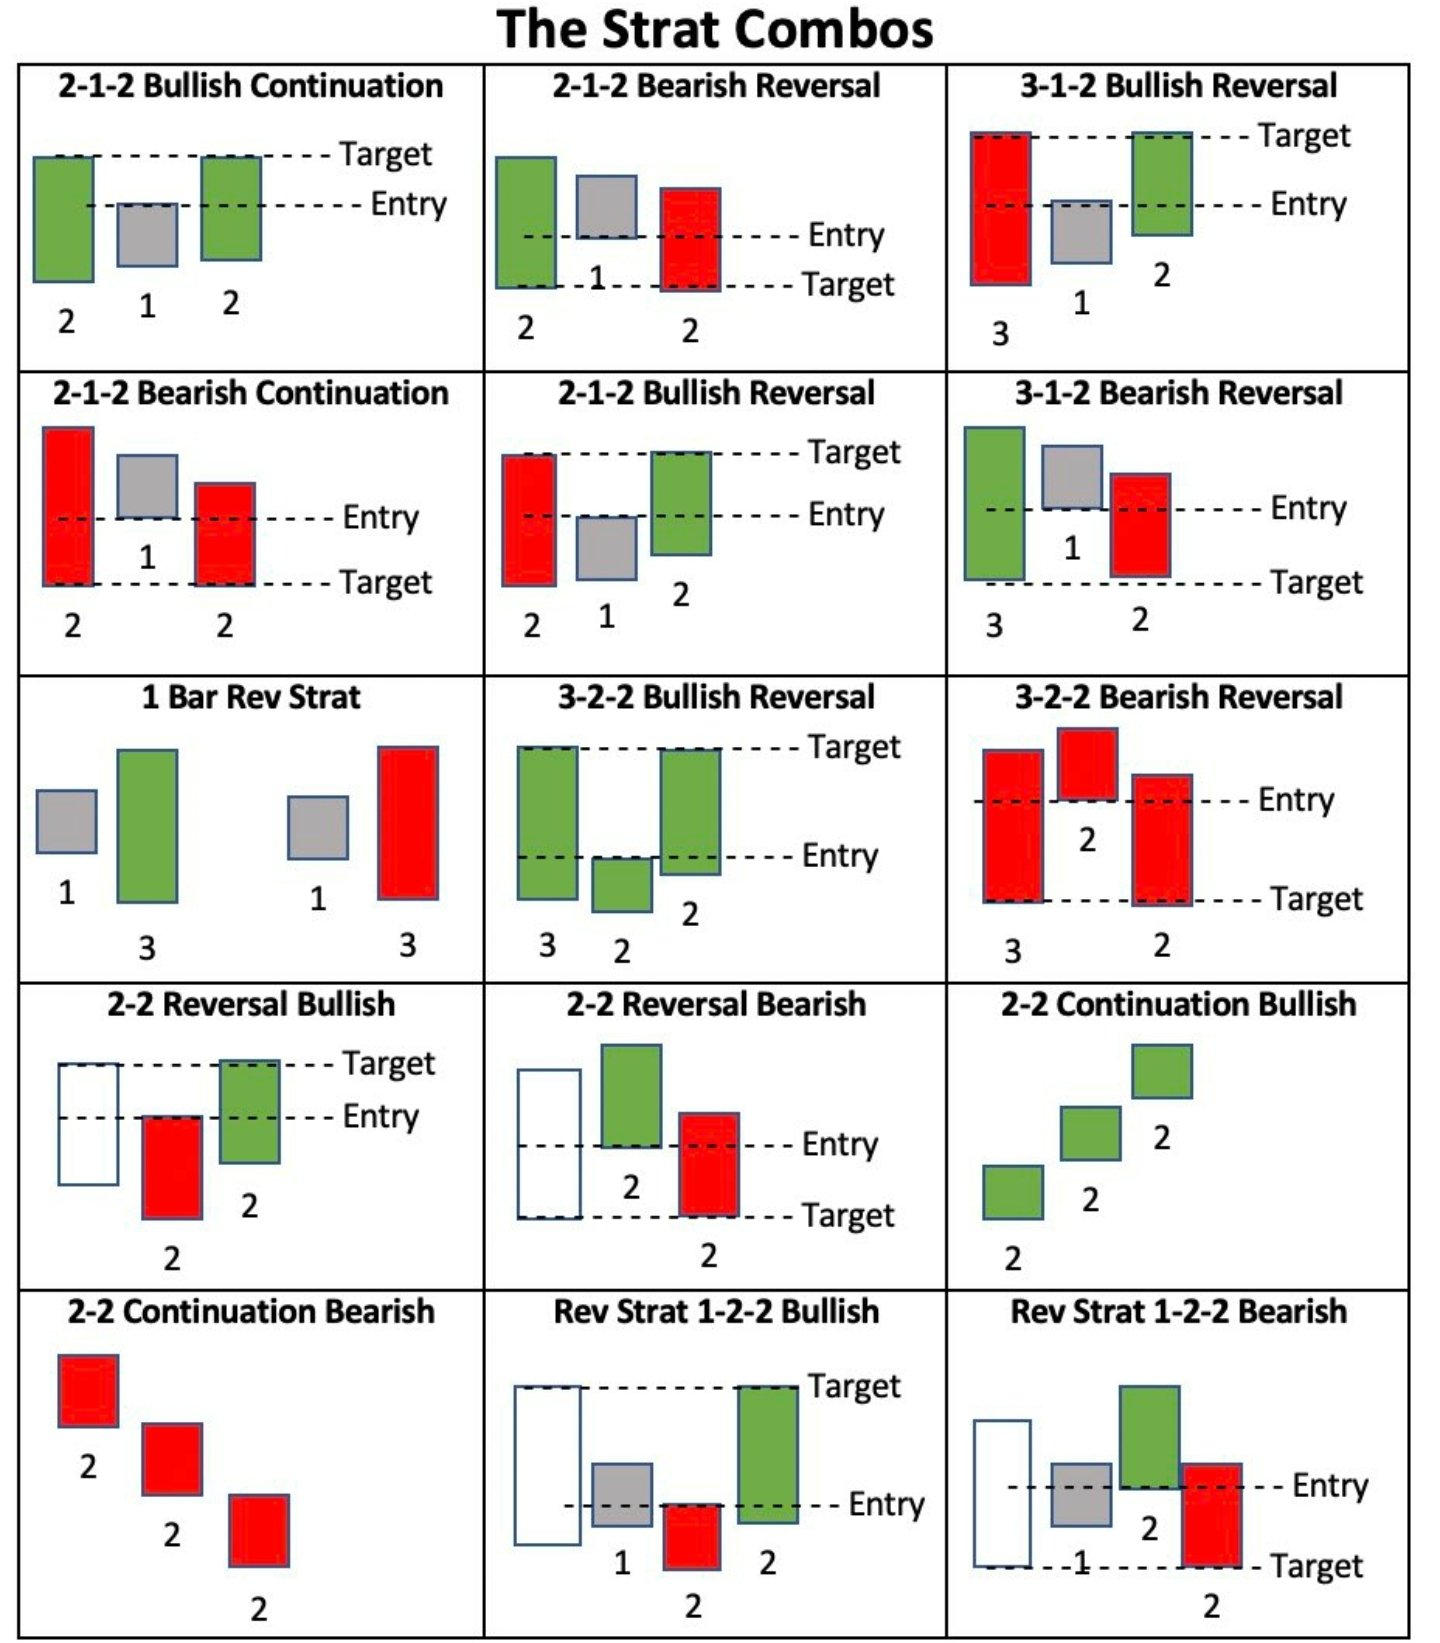
This strategy is dedicated to testing the various #TheStrat reversal (and continuation) setups as explained on the picture provided in the attached gallery which in itself is based on the 4 different Price Action scenarios discussed here: https://www.newtraderu.com/2019/02/13/what-do-we-know-to-be-true-about-price-action/
I recommend importing the .ITF in order to load the test variables, but for those interested here is the code (The x,y and a,b,c,d,e,f variables are used to test different combinations):
Defparam cumulateorders = False

possize = 1

Tollerance = x
OrderTollerance = x
SLBuffer = y
TPBuffer = y

Type2121 = a//TwoOneTwo Continuation
Type2122 = b//TwoOneTwo Reversal
Type312 = c//ThreeOneTwo Reversal
Type322 = d//ThreeTwoTwo Reversal
Type122 = e//OneTwoTwo
Type22 = f//TwoTwo

LongOnly = 0
ShortOnly = 0

InsideBar = high < high[1]-tollerance*pointsize and low > low[1]+tollerance*pointsize
OutsideBar = high > high[1]+tollerance*pointsize and low < low[1]-tollerance*pointsize

TwoUp = high > high[1]+tollerance*pointsize and low > low[1]+tollerance*pointsize
TwoDown = low < low[1]-tollerance*pointsize and high < high[1]-tollerance*pointsize

Up = close > open+tollerance*pointsize
Down = close < Open-tollerance*pointsize

If onmarket = 0 and Type2121 = 1 Then
 If TwoUp[1] and Up[1] and InsideBar and ShortOnly = 0 Then
  Buy possize contract at high+OrderTollerance stop
  SL = high-low
  TP = high[1]-high
 ElsIf TwoDown[1] and Down[1] and InsideBar and LongOnly = 0 Then
  Sellshort possize contract at low-OrderTollerance stop
  SL = high-low
  TP = low-low[1]
 EndIf
 Type = 2121
EndIf

If onmarket = 0 and Type2122 = 1 Then
 If TwoUp[1] and Up[1] and InsideBar and LongOnly = 0 Then
  Sellshort possize contract at low-OrderTollerance stop
  SL = high-low
  TP = low-low[1]
 ElsIf TwoDown[1] and Down[1] and InsideBar and ShortOnly = 0 Then
  Buy possize contract at high+OrderTollerance stop
  SL = high-low
  TP = high[1]-high
 EndIf
 Type = 2122
EndIf

If onmarket = 0 and Type312 = 1 Then
 If OutsideBar[1] and Up[1] and InsideBar and LongOnly = 0 Then
  Sellshort possize contract at low-OrderTollerance stop
  SL = high-low
  TP = low-low[1]
 ElsIf OutsideBar[1] and Down[1] and InsideBar and ShortOnly = 0 Then
  Buy possize contract at high+OrderTollerance stop
  SL = high-low
  TP = high[1]-high
 EndIf
 Type = 312
EndIf

If onmarket = 0 and Type322 = 1 Then
 If OutsideBar[1] and Up[1] and TwoDown and Up and ShortOnly = 0 Then
  Buy possize contract at high+OrderTollerance stop
  SL = high-low
  TP = high[1]-high
 ElsIf OutsideBar[1] and Down[1] and TwoUp and Down and LongOnly = 0 Then
  Sellshort possize contract at low-OrderTollerance stop
  SL = high-low
  TP = low-low[1]
 EndIf
 Type = 322
EndIf

If onmarket = 0 and Type122 = 1 Then
 If InsideBar[1] and TwoUp and Up and LongOnly = 0 Then
  Sellshort possize contract at low-OrderTollerance stop
  SL = high-low
  TP = low-low[2]
 ElsIf InsideBar[1] and TwoDown and Down and ShortOnly = 0 Then
  Buy possize contract at high+OrderTollerance stop
  SL = high-low
  TP = high[2]-high
 EndIf
 Type = 122
EndIf

If onmarket = 0 and Type22 = 1 Then
 If InsideBar[1] = 0 and TwoUp and Up and LongOnly = 0 Then
  Sellshort possize contract at low-OrderTollerance stop
  SL = high-low
  TP = low-low[1]
 ElsIf InsideBar[1] = 0 and TwoDown and Down and ShortOnly = 0 Then
  Buy possize contract at high+OrderTollerance stop
  SL = high-low
  TP = high[1]-high
 EndIf
 Type = 22
EndIf

Graph Type as "Type"

Set Stop loss SL+SLBuffer
Set Target profit TP+TPBuffer