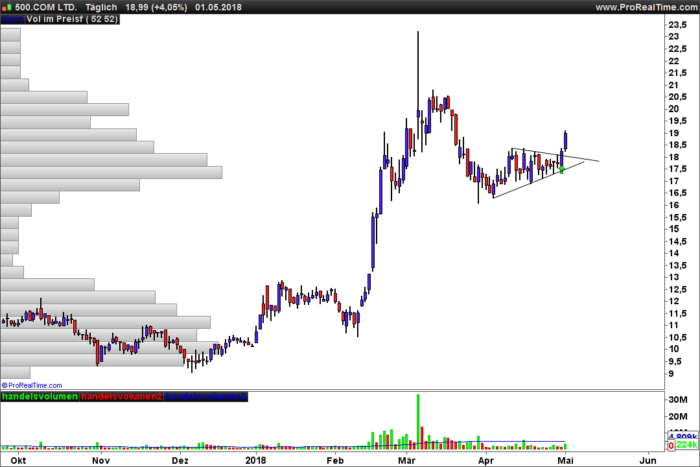
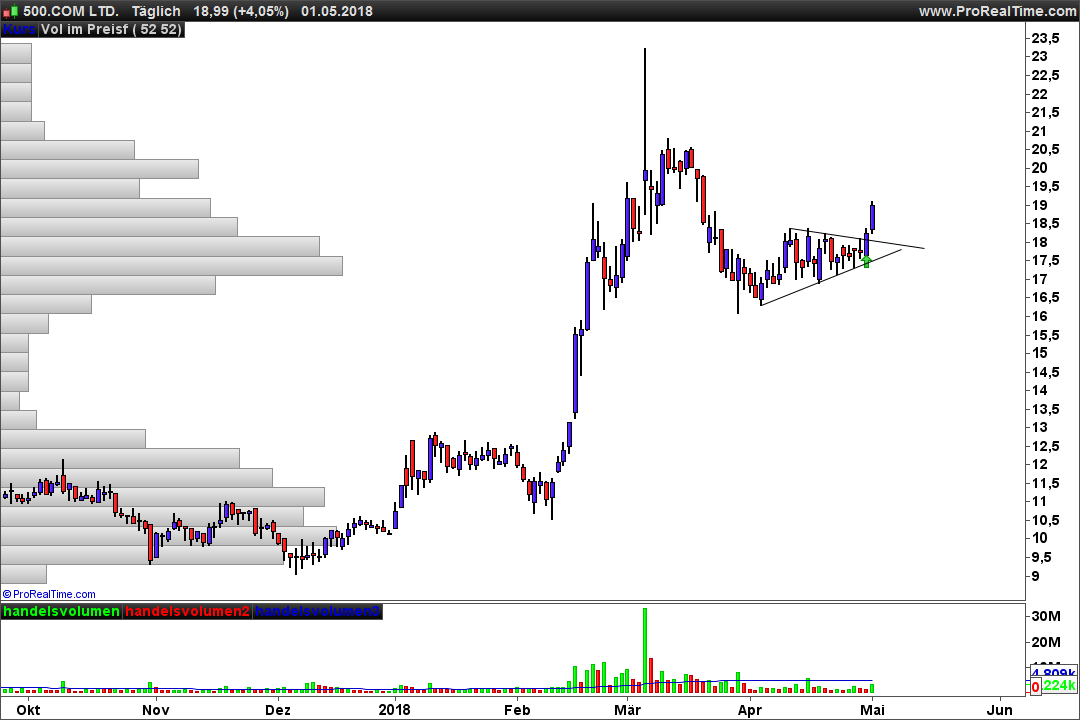
The Chart looks for a 3 Week Consolidation.
The high 3 weeks ago is > two weeks ago and so on. Vice versa with the lows.
So when you look on daily chart a nice Triangle Pattern should be found.
Not every candidate looks good but with a little routine and your eye, you can find some nice triangles in every market in some minutes and place you alert for order.
|
1 2 3 4 5 6 7 8 |
TIMEFRAME(weekly) c3 = Average[40](close*volume) > 3000000 c1 = high[2] >= high[1] and high[1] >= high c2 = low[2] <= low[1] and low[1] <= low SCREENER[c1 and c2 and c3 ](volume*close as "traded volume") |
Share this
No information on this site is investment advice or a solicitation to buy or sell any financial instrument. Past performance is not indicative of future results. Trading may expose you to risk of loss greater than your deposits and is only suitable for experienced investors who have sufficient financial means to bear such risk.
ProRealTime ITF files and other attachments :
Find other exclusive trading pro-tools on ![]()
PRC is also on YouTube, subscribe to our channel for exclusive content and tutorials


great screener, none of the results show the Triangle Pattern on the chart? do I need to change any settings? Thanks
Screeners dont plot anything on charts.
Hola puedes agragar marcos temporales como minimo y maximo en temporalidad del triangulo para ke exista
c3 = Average[40](close*volume) > 3000000
Hi to everyone. I need some help with this code. Does this mean traded volume of 3000000 stocks (number of stocks traded >3000000) or does this mean 3000000 volume of stock currency?
Best Thanks and greets.